

Recommended
More Related Content
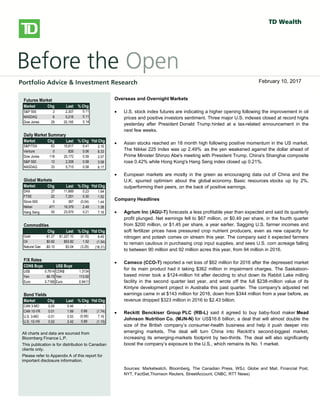
What's hot
What's hot (20)
Similar to Before the open february 10 2017
Similar to Before the open february 10 2017 (17)
More from John Pendrith
More from John Pendrith (20)
Recently uploaded
Recently uploaded (20)
Before the open february 10 2017
- 1. bbbsb Overseas/Overnight Markets U.S. stock index futures fell, taking a cue from European and Asian markets, as worries over global growth prospects and the outcome of Greece’s private-sector bond swap later this week weigh on sentiment. There is no U.S. economic data on the docket today. European stocks dropped, with banks and resource stocks among the `largest detractors. A report released this morning showed a 0.3% Q/Q contraction in the euro-area economy in Q4, confirming an initial estimate published on February 15. Large declines in investment, exports and consumer spending were to blame for the overall GDP contraction. Also weighing on investors was a memo from the Institute of International Finance that warned that a disorderly default would cause the euro zone more than 1 trillion euros ($1.36 trillion) in damage, Reuters reported. The report also stated that a default would likely force Italy and Spain to seek aid to prevent being engulfed in the region’s debt crisis. Private investors that have declared their participation in Greece’s debt restructuring hold about 20% of the bonds involved in a swap, the creditors’ stering committee said yesterday. The goal of the swap, which runs through March 8, is to reduce the amount of privately-held Greek debt by 53.5% and help secure Greece’s second rescue package. Asian stocks fell sharply, with miners among the top declines, following global markets lower on growth concerns. The Hang Seng shed 2.2%, while the Shanghai Composite fell 1.4%. Japan’s Nikkei gave up a more modest 0.6%. North American Market Highlights & Headlines Aecon Group Inc. (ARE-T) reported a 143% increase in quarterly earnings on Monday as margins improved on lower costs. Aecon reported EPS of $0.49, up from $0.20 a year ago. Revenue in the quarter was $790 million, down from $841 million, and well shy of the $859 million consensus estimate. Aecon's backlog stood at $2.39 billion at December 31, 2011. Futures Market Market Chg Last % Chg S&P 500 3 2,307 0.11 NASDAQ 6 5,218 0.11 Dow Jones 29 20,165 0.14 Daily Market Summary Market Chg Last % Chg Ytd Chg S&P/TSX 63 15,617 0.41 2.16 Venture 0 826 0.06 8.33 Dow Jones 118 20,172 0.59 2.07 S&P 500 13 2,308 0.58 3.08 NASDAQ 33 5,715 0.58 6.17 Global Markets Market Chg Last % Chg Ytd Chg DAX 27 11,669 0.23 1.64 FTSE 22 7,251 0.30 1.52 Stoxx 600 0 367 (0.04) 1.44 Nikkei 471 19,379 2.49 1.38 Hang Seng 50 23,575 0.21 7.16 Commodities Chg Last % Chg Ytd Chg Gold -$1.27 $1,227.10 (0.10) 6.49 Oil $0.82 $53.82 1.52 (1.54) Natural Gas -$0.10 $3.04 (3.25) (18.31) F/X Rates CDN$ Buys US$ Buys US$ 0.7614 CDN$ 1.3134 Yen 86.75 Yen 113.50 Euro 0.7166 Euro 0.9411 Bond Yields Market Chg Last % Chg Ytd Chg CAN 3-MO 0.00 0.46 - - CAN 10-YR 0.01 1.69 0.66 (1.74) U.S. 3-MO -0.01 0.53 (0.95) 7.16 U.S. 10-YR 0.02 2.42 0.89 (1.15) All charts and data are sourced from Bloomberg Finance L.P. This publication is for distribution to Canadian clients only. Please refer to Appendix A of this report for important disclosure information. Overseas and Overnight Markets U.S. stock index futures are indicating a higher opening following the improvement in oil prices and positive investors sentiment. Three major U.S. indexes closed at record highs yesterday after President Donald Trump hinted at a tax-related announcement in the next few weeks. Asian stocks reached an 18 month high following positive momentum in the US market. The Nikkei 225 Index was up 2.49% as the yen weakened against the dollar ahead of Prime Minister Shinzo Abe's meeting with President Trump. China's Shanghai composite rose 0.42% while Hong Kong's Hang Seng index closed up 0.21%. European markets are mostly in the green as encouraging data out of China and the U.K. spurred optimism about the global economy. Basic resources stocks up by 2%, outperforming their peers, on the back of positive earnings. Company Headlines Agrium Inc (AGU-T) forecasts a less profitable year than expected and said its quarterly profit plunged. Net earnings fell to $67 million, or $0.49 per share, in the fourth quarter from $200 million, or $1.45 per share, a year earlier. Sagging U.S. farmer incomes and soft fertilizer prices have pressured crop nutrient producers, even as new capacity for nitrogen and potash comes on stream this year. The company said it expected farmers to remain cautious in purchasing crop input supplies, and sees U.S. corn acreage falling to between 90 million and 92 million acres this year, from 94 million in 2016. Cameco (CCO-T) reported a net loss of $62 million for 2016 after the depressed market for its main product had it taking $362 million in impairment charges. The Saskatoon- based miner took a $124-million hit after deciding to shut down its Rabbit Lake milling facility in the second quarter last year, and wrote off the full $238-million value of its Kintyre development project in Australia this past quarter. The company's adjusted net earnings came in at $143 million for 2016, down from $344 million from a year before, as revenue dropped $323 million in 2016 to $2.43 billion. Reckitt Benckiser Group PLC (RB-L) said it agreed to buy baby-food maker Mead Johnson Nutrition Co. (MJN-N) for US$16.6 billion, a deal that will almost double the size of the British company’s consumer-health business and help it push deeper into emerging markets. The deal will turn China into Reckitt’s second-biggest market, increasing its emerging-markets footprint by two-thirds. The deal will also significantly boost the company’s exposure to the U.S., which remains its No. 1 market. Sources: Marketwatch, Bloomberg, The Canadian Press, WSJ, Globe and Mail, Financial Post, NYT, FactSet,Thomson Reuters, StreetAccount, CNBC, RTT News) February 10, 2017
- 2. Before the Open February 10, 2017 Page 2 Canadian Equities Upgrades - March 6 WeeklyCanada Economic Calendar - February06 to February10, 2017 Date/Time Event Period Consensus Actual Prior 02/06/201710:00 BloombergNanosConfidence 3-Feb -- 57.3 56.1 02/07/201708:30 Int'lMerchandiseTrade Dec 0.20b 0.92b 0.53b 02/07/201708:30 BuildingPermitsMoM Dec -3.00% -6.60% -0.10% 02/07/201710:00 IveyPurchasingManagersIndexSA Jan -- 57.2 60.8 02/08/201708:15 HousingStarts Jan 200.0k 207.4 207.0k 02/09/201708:30 NewHousingPriceIndexMoM Dec 0.20% 0.10% 0.20% 02/09/201708:30 NewHousingPriceIndexYoY Dec -- 3% 3.00% 02/10/201708:30 UnemploymentRate Jan 6.90% 6.80% 6.90% 02/10/201708:30 NetChangeinEmployment Jan -10.0k 48.3k 46.1k 02/10/201708:30 FullTimeEmploymentChange Jan -- 15.8 70.9 02/10/201708:30 PartTimeEmploymentChange Jan -- 32.4 -24.7 02/10/201708:30 ParticipationRate Jan 65.8 65.9 65.8 S&P/TSX Daily Performance 12000 12500 13000 13500 14000 14500 15000 15500 16000 Feb-16 Apr-16 Jun-16 Aug-16 Sep-16 Nov-16 Jan-17 Leaders - Prior Session Company Ticker % Change Birchcliff Energy Ltd BIR-T 7.72 Encana Corp ECA-T 6.50 Uni-Select Inc UNS-T 6.00 NuVista Energy Ltd NVA-T 5.54 Advantage Oil & Gas Ltd AAV-T 5.18 Laggards - Prior Session Company Ticker % Change Just Energy Group Inc JE-T -5.67 Mullen Group Ltd MTL-T -5.27 Home Capital Group Inc HCG-T -5.17 First Majestic Silver Corp FR-T -4.89 Asanko Gold Inc AKG-T -4.52 Canadian Equity Upgrades Precision Drilling Raised to Market Perform at Raymond James Gran Tierra Upgraded to Outperform at Credit Suisse Sirra Wireless Raised to Outperform at National bank Canadian Equity Downgrades Brookfield Asset Management Cut to Outperform at RBC Today's Earnings – Canada Hydro One Ltd $0.23, FirstService Corp $0.32, Emera Inc $0.59, Merus Labs International Inc -$0.03, IGM Financial Inc $0.80, Canacol Energy Ltd $0.03, Computer Modelling Group Ltd $0.07, TransAlta Renewables Inc $0.24, Grande West Transportation Group Inc $0.01
- 3. Before the Open February 10, 2017 Page 3 Weekly U.S. Economic Calendar - February 06 to February 10, 2017 Date/Time Event Period Consensus Actual Prior 02/07/2017 08:30 Trade Balance Dec -$45.0b -$44.3b -$45.2b 02/07/2017 10:00 JOLTS Job Openings Dec 5569 5501 5522 02/07/2017 15:00 Consumer Credit Dec $20.000b $14.16b $24.532b 02/08/2017 07:00 MBA Mortgage Applications 3-Feb -- 2.30% -3.20% 02/09/2017 08:30 Initial Jobless Claims 4-Feb 249k 234k 246k 02/09/2017 08:30 Continuing Claims 28-Jan 2065k 2078k 2064k 02/09/2017 09:45 Bloomberg Consumer Comfort 5-Feb -- 2.60% 0.50% 02/09/2017 10:00 Wholesale Trade Sales MoM Dec 1.00% 1.00% -- 02/09/2017 10:00 Wholesale Inventories MoM Dec F 0.30% 0.40% 0.50% 02/10/2017 08:30 Import Price Index MoM Jan -- 0.00% -0.10% 02/10/2017 08:30 Import Price Index ex Petroleum MoM Jan 3.40% 3.70% 2.00% 02/10/2017 08:30 Import Price Index YoY Jan 3.10% -- 1.80% 02/10/2017 10:00 U. of Mich. Sentiment Feb P 97.8 -- 98.5 02/10/2017 10:00 U. of Mich. Current Conditions Feb P -- -- 111.3 02/10/2017 10:00 U. of Mich. Expectations Feb P -- -- 90.3 02/10/2017 10:00 U. of Mich. 1 Yr Inflation Feb P -- -- 2.60% 02/10/2017 10:00 U. of Mich. 5-10 Yr Inflation Feb P -- -- 2.60% 02/10/2017 14:00 Monthly Budget Statement Jan $40.0b -- -$27.5b 02/10/2017 Revisions: Producer Price Index S&P 500 Daily Performance 1700 1800 1900 2000 2100 2200 2300 2400 Feb-16 Apr-16 Jun-16 Aug-16 Sep-16 Nov-16 Jan-17 Leaders - Prior Session Company Ticker % Change Microchip Technology Inc MCHP-US 6.00 Cognizant Technology Solutions CorpCTSH-US 4.95 Kohl's Corp KSS-US 4.32 Xerox Corp XRX-US 4.10 Nordstrom Inc JWN-US 4.09 Laggards - Prior Session Company Ticker % Change Akamai Technologies Inc AKAM UW -10.64 Gilead Sciences Inc GILD UW -8.61 CSRA Inc CSRA UN -6.91 Assurant Inc AIZ UN -6.75 Intercontinental Exchange Inc ICE UN -4.82 U.S. Equity Upgrades Melrose Industries Upgraded to Outperform at BNP Osram Raised to Equal Weight at Barclays U.S. Equity Downgrades Golub Capital Cut to Market Perform at Raymond James MTS Systems Cut to Neutral at JP Morgan Zurich Ins. Cut to Underperform at Macquarie Today's Earnings – U.S. Calpine Corp -$0.04, CBRE Group Inc $0.81, WildHorse Resource Development Corp -$0.02
- 4. Before the Open February 10, 2017 Page 4 Appendix A - Important Information General Research Disclaimer The statements and statistics contained herein are based on material believed to be reliable, but are not guaranteed to be accurate or complete. This report is for informational purposes only and is not an offer or solicitation with respect to the purchase or sale of any investment fund, security or other product. Particular investment, trading, or tax strategies should be evaluated relative to each individual’s objectives. Graphs and charts are used for illustrative purposes only and do not reflect future values or future performance. This document does not provide individual financial, legal, investment or tax advice. Please consult your own legal, investment and tax advisor. All opinions and other information in this document are subject to change without notice. The Toronto-Dominion Bank and its affiliates and related entities are not liable for any errors or omissions in the information or for any loss or damage suffered. TD Waterhouse Canada Inc. and/or its affiliated persons or companies may hold a position in the securities mentioned, including options, futures and other derivative instruments thereon, and may, as principal or agent, buy or sell such securities. Affiliated persons or companies may also make a market in and participate in an underwriting of such securities. Full disclosures for all companies covered by TD Securities Inc. can be viewed at https://www.tdsresearch.com/equities/welcome.important.disclosure.action Research Ratings Action List BUY: The stock’s total return is expected to exceed a minimum of 15%, on a risk-adjusted basis, over the next 12 months and it is a top pick in the Analyst’s sector. BUY: The stock’s total return is expected to exceed a minimum of 15%, on a risk-adjusted basis, over the next 12 months. SPECULATIVE BUY: The stock’s total return is expected to exceed 30% over the next 12 months; however, there is material event risk associated with the investment that could result in significant loss. HOLD: The stock’s total return is expected to be between 0% and 15%, on a risk-adjusted basis, over the next 12 months. TENDER: Investors are advised to tender their shares to a specific offer for the company’s securities. REDUCE: The stock’s total return is expected to be negative over the next 12 months. Technical Research Disclaimer The opinions expressed herein reflect a technical perspective and may differ from fundamental research on these issuers. Fundamental research can be obtained through your TD Wealth advisor or on the Markets and Research site within WebBroker. The technical research opinions contained in this report are based on historical technical data and expectations of the most likely direction of a market or security. No guarantee of that outcome is ever implied. Research Report Dissemination Policy TD Waterhouse Canada Inc. makes its research products available in electronic format. These research products are posted to our proprietary websites for all eligible clients to access by password and we distribute the information to our sales personnel who then may distribute it to their retail clients under the appropriate circumstances either by email, fax or regular mail. No recipient may pass on to any other person, or reproduce by any means, the information contained in this report without our prior written consent. Analyst Certification The Portfolio Advice and Investment Research analyst(s) responsible for this report hereby certify that (i) the recommendations and technical opinions expressed in the research report accurately reflect the personal views of the analyst(s) about any and all of the securities or issuers discussed herein, and (ii) no part of the research analyst’s compensation was, is, or will be, directly or indirectly, related to the provision of specific recommendations or views expressed by the research analyst in the research report. Conflicts of Interest The Portfolio Advice & Investment Research analyst(s) responsible for this report may own securities of the issuer(s) discussed in this report. As with most other employees, the analyst(s) who prepared this report are compensated based upon (among other factors) the overall profitability of TD Waterhouse Canada Inc. and its affiliates, which includes the overall profitability of investment banking services, however TD Waterhouse Canada Inc. does not compensate its analysts based on specific investment banking transactions.
- 5. Before the Open February 10, 2017 Page 5 Corporate Disclosure TD Wealth represents the products and services offered by TD Waterhouse Canada Inc. (Member – Canadian Investor Protection Fund), TD Waterhouse Private Investment Counsel Inc., TD Wealth Private Banking (offered by The Toronto-Dominion Bank) and TD Wealth Private Trust (offered by The Canada Trust Company). The Portfolio Advice and Investment Research team is part of TD Waterhouse Canada Inc., a subsidiary of The Toronto-Dominion Bank. Trade-mark Disclosures Bloomberg and Bloomberg.com are trademarks and service marks of Bloomberg Finance L.P., a Delaware limited partnership, or its subsidiaries. All rights reserved. “TD Securities” is the trade name which TD Securities Inc. and TD Securities (USA) LLC. jointly use to market their institutional equity services. TD Securities is a trade-mark of The Toronto-Dominion Bank representing TD Securities Inc., TD Securities (USA) LLC, TD Securities Limited and certain corporate and investment banking activities of The Toronto-Dominion Bank. All trademarks are the property of their respective owners. ® The TD logo and other trade-marks are the property of The Toronto-Dominion Bank. FTSE TMX Global Debt Capital Markets Inc. 2016 "FTSE®" is a trade mark of FTSE International Ltd and is used under licence. "TMX” is a trade mark of TSX Inc. and is used under licence. All rights in the FTSE TMX Global Debt Capital Markets Inc.'s indices and / or FTSE TMX Global Debt Capital Markets Inc.'s ratings vest in FTSE TMX Global Debt Capital Markets Inc. and/or its licensors. Neither FTSE TMX Global Debt Capital Markets Inc. nor its licensors accept any liability for any errors or omissions in such indices and / or ratings or underlying data. No further distribution of FTSE TMX Global Debt Capital Markets Inc.'s data is permitted without FTSE TMX Global Debt Capital Markets Inc.'s express written consent.