Book Partial Profits: PTC India Finance - Nirmal Bang
•
1 like•309 views

PTC India Financial Services is an NBFC subsidiary of PTC India Limited that provides debt financing to power projects. The document recommends buying PTC India Financial Services stock for the following key reasons: 1) The company has grown its loan book over 4 times in the last 4 years and aims to double its balance sheet in the next 12-18 months, driven by a large pipeline of sanctioned projects. 2) It has shifted focus to lower risk renewable energy projects and maintains healthy asset quality with zero net NPAs. 3) Profitability is expected to increase further from equity investment exits and growth in the loan book, driving higher return ratios. 4) Adequate capitalization will

Recommended
Recommended
More Related Content
What's hot
What's hot (20)
Similar to Book Partial Profits: PTC India Finance - Nirmal Bang
Similar to Book Partial Profits: PTC India Finance - Nirmal Bang (20)
More from IndiaNotes.com
More from IndiaNotes.com (20)
Book Partial Profits: PTC India Finance - Nirmal Bang
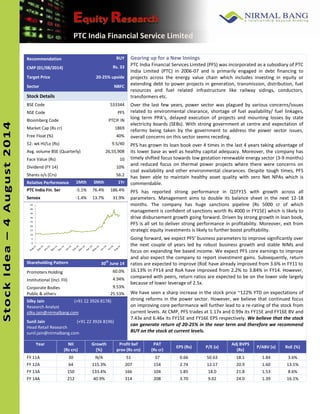
- 1. Ini t i a t in g Co ve ra ge PTC India Financial Service Limited Stock Idea –– 4 August 2014 4 Recommendation BUY Gearing up for a New Innings PTC India Financial Services Limited (PFS) was incorporated as a subsidiary of PTC India Limited (PTC) in 2006-07 and is primarily engaged in debt financing to projects across the energy value chain which includes investing in equity or extending debt to power projects in generation, transmission, distribution, fuel resources and fuel related infrastructure like railway sidings, conductors, transformers etc. Over the last few years, power sector was plagued by various concerns/issues related to environmental clearance, shortage of fuel availability/ fuel linkages, long term PPA’s, delayed execution of projects and mounting losses by state electricity boards (SEBs). With strong government at centre and expectation of reforms being taken by the government to address the power sector issues, overall concerns on this sector seems receding. PFS has grown its loan book over 4 times in the last 4 years taking advantage of its lower base as well as healthy capital adequacy. Moreover, the company has timely shifted focus towards low gestation renewable energy sector (3-9 months) and reduced focus on thermal power projects where there were concerns on coal availability and other environmental clearances. Despite tough times, PFS has been able to maintain healthy asset quality with zero Net NPAs which is commendable. PFS has reported strong performance in Q1FY15 with growth across all parameters. Management aims to double its balance sheet in the next 12-18 months. The company has huge sanctions pipeline (Rs 5000 cr of which management is confident of sanctions worth Rs 4000 in FY15E) which is likely to drive disbursement growth going forward. Driven by strong growth in loan book, PFS is all set to deliver strong performance in profitability. Moreover, exit from strategic equity investments is likely to further boost profitability. Going forward, we expect PFS’ business parameters to improve significantly over the next couple of years led by robust business growth and stable NIMs and focus on expanding fee based income. We expect PFS core earnings to improve and also expect the company to report investment gains. Subsequently, return ratios are expected to improve (RoE have already improved from 3.6% in FY11 to 16.13% in FY14 and RoA have improved from 2.2% to 3.84% in FY14. However, compared with peers, return ratios are expected to be on the lower side largely because of lower leverage of 2.5x. We have seen a sharp increase in the stock price ~122% YTD on expectations of strong reforms in the power sector. However, we believe that continued focus on improving core performance will further lead to a re-rating of the stock from current levels. At CMP, PFS trades at 1.17x and 0.99x its FY15E and FY16E BV and 7.43x and 6.46x its FY15E and FY16E EPS respectively. We believe that the stock can generate return of 20-25% in the near term and therefore we recommend BUY on the stock at current levels. CMP (01/08/2014) Rs. 33 Target Price 20-25% upside Sector NBFC Stock Details BSE Code 533344 NSE Code PFS Bloomberg Code PTCIF IN Market Cap (Rs cr) 1869 Free Float (%) 40% 52- wk HI/Lo (Rs) 9.5/40 Avg. volume BSE (Quarterly) 26,55,908 Face Value (Rs) 10 Dividend (FY 14) 10% Shares o/s (Crs) 56.2 Relative Performance 1Mth 3Mth 1Yr PTC India Fin. Ser - 5 . 1 % 76.4% 186.4% Sensex -1.4% 13.7% 31.9% 0 5 10 15 20 25 30 35 40 45 Shareholding Pattern 30th June 14 Promoters Holding 60.0% Institutional (Incl. FII) 4.94% Corporate Bodies 9.53% Public & others 25.53% Silky Jain (+91 22 3926 8178) Research Analyst silky.jain@nirmalbang.com Sunil Jain (+91 22 3926 8196) Head Retail Research sunil.jain@nirmalbang.com Year NII (Rs crs) Growth (%) Profit bef prov (Rs crs) PAT (Rs cr) EPS (Rs) P/E (x) Adj BVPS (Rs) P/ABV (x) RoE (%) FY 11A 30 N/A 51 37 0.66 50.63 18.1 1.84 3.6% FY 12A 64 115.3% 207 154 2.74 12.17 20.9 1.60 13.1% FY 13A 150 133.4% 166 104 1.85 18.0 21.8 1.53 8.6% FY 14A 212 40.9% 314 208 3.70 9.02 24.0 1.39 16.1%
- 2. Ini t i a t in g Co ve ra ge PTC India Financial Service Limited Stock Idea –– 4 August 2014 Investment Rationale PTC India - Strong Parentage: PTC India is the market leader in Power Trading with ~50% market share and owns ~60% in PTC India Financial (PFS). Over the years, PTC has worked towards development of the power sector in India and has emerged as a complete energy solution provider. We believe that the strong parentage of PTC India facilitates PFS to have an in-depth understanding of the power sector and of individual projects. PFS benefits from an early mover advantage in providing appropriate financing with the strong backing of PTC. The company has been able to build its loan book largely been driven by links provided from PTC India. Furthermore, most projects sanctions and disbursements have a PPA with PTC India which de-risks PFS business model. Healthy growth in loan book PFS’ loan book has witnessed CAGR growth of 103% over FY10-FY14. Going forward, PFS aims to double its loan book in the next 12-18 months. We believe that the company will be able to achieve its target considering the lower base which will be further backed by improvement in the overall power sector scenario. 302 680 1266 2296 4974 0 1,000 2,000 3,000 4,000 5,000 6,000 FY10 FY11 FY12 FY13 FY14 Loan book Source: Company data, Nirmal Bang Research Over the last 2 years, taking into consideration the issues in the thermal segment, PFS has strategically slowed sanctions in the thermal segment. It cancelled sanctions worth Rs 1000 cr in FY14. At the same time, PFS focused on increasing its non-thermal exposure where the gestation period is lower (3-9 months) and focused towards renewable segment, hydro segment etc. PFS has enhanced its focus on renewable energy as these projects do not have significant fuel and environmental clearance related risks, and receive regulatory, fiscal and non-fiscal support. The gestation period is also small. The Company has also forayed in other areas within the energy value chain such as development and operation of coal mines, development of private railway sidings, power transmission projects etc. The share of thermal segment declined from 49% in FY13 to 33% in FY14 and management targets to further reduce it to 30% levels. At present, renewable energy projects are 35% of the portfolio and the management is aiming to increase it to 65- 70% in the next one year.
- 3. Ini t i a t in g Co ve ra ge PTC India Financial Service Limited Stock Idea –– 4 August 2014 49% 45% 42% 41% 33% 40% 40% 39% 39% 35% 8% 8% 7% 7% 9% 3% 7% 12% 13% 22% 0% 10% 20% 30% 40% 50% 60% 70% 80% 90% 100% Q4FY13 Q1FY14 Q2FY14 Q3FY14 Q4FY14 Decreasing proportion of thermal projects Thermal Renewable Hydro Others Source: Company data, Nirmal Bang Research As per the management, it has a huge sanction pipeline of ~Rs 5000 cr and it is confident of increasing its disbursements in current year as well (targeting sanctions worth Rs 4000 cr in FY15E). Moreover, an improvement in overall power and infrastructure sectors, we believe that company will be able to maintain growth momentum in loan book as well as disbursements in long term. Steady margins The company has diversified its funding mix and now the funding constitutes of bank borrowings, bonds as well as external commercial borrowings (ECBs). PFS has A+ rating for short term and long term borrowings from ICRA, CRISIL. The current spread stands at about ~4.5%, as cost of fund is close to 9% and yield is close to 14% as the company has not leveraged its debt equity ratio. The current leverage of the company stands at 2.5x; while as NBFC the company can leverage up to 6:1. PFS also expects to get a “Public Financial Institution” status in FY15 which will help it to raise funds from insurance and mutual funds firms at lower rate of around 8-9%. Stable rating from credit agencies and optimal mix of funding will aid in lowering the cost of funds and thereby help PFS in maintaining steady margins. 4.6% 4.2% 5.7% 6.0% 5.5% 5.4% 4.6% 4.9% 4.7% 4.5% 6.4% 7.4% 9.1% 8.8% 8.3% 8.1% 7.0% 6.9% 6.8% 6.9% 0.0% 1.0% 2.0% 3.0% 4.0% 5.0% 6.0% 7.0% 8.0% 9.0% 10.0% NIMs Spreads Source: Company data, Nirmal Bang Research
- 4. Ini t i a t in g Co ve ra ge PTC India Financial Service Limited Stock Idea –– 4 August 2014 Equity investments- A big booster PFS is uniquely positioned to participate in various power value chain entities via strategic equity investments at the initial stages of a project. These investments were made at “AT PAR” with a lock-in of around 3-5 years. PFS has time bound exit route in these investments with an average IRR of ~23%. The company also keeps a close grip on the operational working of the companies. These equity investments are expected to create a huge value unlocking proposition for PFS over the next couple of years. PFS has exited from India Energy Exchange and Ind-Bharath Energy with decent IRR. In FY14, PFS exited Meenaxi Energy for Rs 82.2 cr and the company is planning to exit one more investment in FY15E which will further boost the profitability of the company. Source: Company data, Nirmal Bang Research Asset quality to remain broadly stable Gross NPAs of PFS stood at negligible 0.09% with zero net NPA in FY14. PFS has restructured Rs 150 cr loans till date and does not see any major restructuring pipeline in the near future. Going forward as the overall scenario in the power sector is likely to improve, we believe that asset quality is likely to remain stable at current levels and not witness any major deterioration. PFS has separate and robust credit appraisal and monitoring mechanisms for both debt and equity funded projects. In case of debt funded projects, out of seven proposals which come to the company for consideration, only one is passed which shows that the company is very cautious while selecting the borrower and have a very strong risk department. Equity investments Capacity (MW) O/S March 14 (Rs crs) Investment status Indian Energy Exchange Ltd N.A 1.52 Operational since June 2008 PFS holds 5% on fully diluted basis in the company Ind Barath Energy (Utkal) Ltd 700 105 Project execution is at advanced stage and is expected to be commissioned in 2014 All clearances received and project is expected to be commissioned by July 2013 East Coast Energy Pvt Ltd 1320 133.38 Construction activities are in progress. Phase I is expected to commissioned by December 2015 and phase II is expected by March 2016. Received FIPB approval for swap its shareholding into shares of the holding company R S India Wind Energy Pvt Ltd 99 61.12 Phase I (41.25 MW) is commissioned and phase II is under implementation WTG manufacturing facility housed in a group company is also commissioned Total 301.02
- 5. Ini t i a t in g Co ve ra ge PTC India Financial Service Limited Stock Idea –– 4 August 2014 Subsequent to a principal investment or disbursement of debt, PFS continues to monitor the development and performance of the relevant project, which also includes appointment of nominee directors in the case of certain principal investments. Moreover, a fairly diversified book also reduces the concentration risks. 0.18% 0.16% 0.15% 0.09% 0.09% 0.00% 0.02% 0.04% 0.06% 0.08% 0.10% 0.12% 0.14% 0.16% 0.18% 0.20% Q1FY14 Q2FY14 Q3FY14 Q4FY14 Q1FY15 Gross NPA Source: Company data, Nirmal Bang Research PFS maintains conservative provisioning strategy and provides 0.5% on standard loans as compared to 0.25% prescribed by RBI. It also has entirely provided for the NPAs leading to nil net NPAs. Adequate capital position augurs well for growth Healthy capital adequacy ratio has been an advantage for the company to enable it to grow its loan book at significant pace in tough times. After witnessing growth of nearly 4x in its loan book in the last 4 years, PFS still has a capital adequacy of 25.2% in FY14 which will enable it to grow at healthy pace in FY15E as well. However, we believe that PFS will require to raise capital by next year to maintain its current growth momentum. 88.3% 84.5% 67.0% 42.0% 25.2% 0.0% 20.0% 40.0% 60.0% 80.0% 100.0% FY10 FY11 FY12 FY13 FY14 Capital Adequacy Ratio Source: Company data, Nirmal Bang Research Dividend policy Right from the time PFS came with its IPO in March 2011, dividend was a major concern for the investors. As the overall sector was under pressure and the company’s growth was at nascent stage it did not paid any dividend. However, in FY13 it paid a dividend of Rs 0.40 per share which was further increased to Rs 1 in FY14. We believe that with increasing profitability of the company, the dividend payout is set to improve from current levels.
- 6. Ini t i a t in g Co ve ra ge PTC India Financial Service Limited Stock Idea –– 4 August 2014 Return ratios set to improve We expect PFS’ business parameters to improve significantly over the next couple of years led by robust business growth with stable NIMs. We expect PFS core earnings to improve and also expect the company to report investment gains. Subsequently, return ratios are expected to improve (RoE have already improved from 3.6% in FY11 to 16.13% in FY14 and RoA have improved from 2.2% to 3.84% in FY14. However, compared with peers, return ratios are expected to be on the lower side largely because of lower leverage of 2.5x. 4.0% 3.6% 13.1% 8.6% 16.1% 2.7% 2.2% 3.2% 3.6% 3.8% 0.0% 2.0% 4.0% 6.0% 8.0% 10.0% 12.0% 14.0% 16.0% 18.0% FY10 FY11 FY12 FY13 FY14 Return ratios RoE RoA Source: Company data, Nirmal Bang Research Q1FY15 Results snapshot Source: Company data, Nirmal Bang Research Particulars (Rs in cr) Q1FY15 Q1FY14 YoY Q4FY14 QoQ Interest income 167.6 79.3 111.3% 129.7 29.2% Finance cost 89.7 36.9 143.3% 65.0 38.0% Net Interest Income 78.0 42.5 83.5% 64.7 20.4% Other operating income 5.6 6.9 (18.7%) 19.7 (71.6%) Total income 173.2 86.2 100.9% 149.4 15.9% Employee costs 2.4 1.5 60.5% 2.3 4.8% Depreciation 1.0 0.9 20.8% 1.3 (20.1%) Other expenses 2.0 1.9 2.4% 2.5 (20.8%) Total expense 95.1 41.2 131.0% 71.1 33.8% Prov for std asset 3.1 4.9 (37.2%) 8.9 (65.5%) Loss on foreign currency 2.9 3.1 (7.2%) -0.3 N/A PBT 72.1 37.1 94.7% 69.7 3.5% Tax expenses 20.0 12.6 58.8% 23.3 (14.3%) PAT 52.1 24.4 113.2% 46.4 12.5% Adj PAT 54.2 26.5 104.6% 46.2 17.4% Adj EPS 1.0 0.5 0.8 Gross NPA 0.09% 0.18% 0.09% Net NPA 0.00% 0.00% 0.00%
- 7. Ini t i a t in g Co ve ra ge PTC India Financial Service Limited Stock Idea –– 4 August 2014 Outstanding loans increased 84% to Rs 4965 cr. Net Interest income increased 83.5% YoY and 20.4% QoQ and stood at Rs 78 crs. Margins stood at 4.36% during the quarter. Provisions for standard asset declined from Rs 4.9 cr in Q1FY14 to Rs 3.1 cr PAT increased 113.2% YoY and 12.5% QoQ to Rs 52.1 cr Gross NPA reduced from 0.18% last year to 0.09% (stable on QoQ basis) Risk Concerns Delay in power sector reforms can lead to increase in NPAs for the company High dependence on bank borrowing can pose to be a risk if interest rates continue to remain on the higher end. Inability to exit from equity investments at higher IRR can impact profitability Peer Comparison PFS is smaller player in the sector as compared to REC and PFC. As PFS business also includes strategic investments in power projects, it makes direct competition unviable. Moreover, as PFS has lower leverage, the return ratios are also on the lower side as compared to its peers. FY14 PFS PFC REC Outstanding loan 4974 189231 148641 Gross NPA 0.09% 0.65% 0.33% NIM 6.92% 4.94% 4.9% RoNW 11.4% 19.8% 22.7% RoA 3.84% 2.98% 3.4% CAR 25.2% 20.1% 16.0% P/E 10.32 6.46 6.41 P/BV 1.33 1.28 1.45 Source: Company data, Nirmal Bang Research 0.00 5.00 10.00 15.00 20.00 25.00 30.00 35.00 40.00 45.00 50.00 Mar-11 May-11 Jul-11 Sep-11 Nov-11 Jan-12 Mar-12 May-12 Jul-12 Sep-12 Nov-12 Jan-13 Mar-13 May-13 Jul-13 Sep-13 Nov-13 Jan-14 Mar-14 May-14 Jul-14 P/BV- Forward CMP 0.3x 0.6x 0.9x 1.2x 1.5x
- 8. Ini t i a t in g Co ve ra ge PTC India Financial Service Limited Stock Idea –– 4 August 2014 Company Background PTC India Financial Services (PFS) is a systemically important non deposit taking NBFC, promoted by PTC India Ltd (PTC). The company is primarily engaged in debt financing to projects across the energy value chain which includes investing in equity or extending debt to power projects in generation, transmission, distribution, fuel resources and fuel related infrastructure like railway sidings, conductors, transformers etc. PFS has been classified by the RBI as an Infrastructure Finance Company, or IFC. The IFC status enhances the company’s ability to raise funds on a cost-competitive basis and enables it to assume higher debt exposure in infrastructure projects.
- 9. Ini t i a t in g Co ve ra ge PTC India Financial Service Limited Stock Idea –– 4 August 2014 Financials Profitability (Rs. Crs) FY11 FY12 FY13 FY14 Balance Sheet (Rs. Crs) FY11 FY12 FY13 FY14 Interest earned 74 133 251 420 Equity capital 562 562 562 562 Interest expended 44 69 101 208 Reserves and surplus 456 610 664 787 Net interest income 30 64 150 212 Net worth 1,018 1,172 1,226 1,349 Income on investment 12 127 0 82 Total Loans 465 716 1,532 3,770 Other operating income 22 43 35 44 Curr Liab 209 65 114 242 Total income from operations 64 234 185 338 Deferred Tax 5 5 14 25 Employee cost 2 4 6 7 Others 2 7 12 29 Other expenses 11 23 14 16 Total liab and equity 1,699 1,964 2,899 5,414 Profit before prov 51 207 166 314 Cash and bank bal 483 198 68 33 Provisions 0 5 5 17 Investments 464 421 544 401 Loss on foreign currency 0 1 5 13 Loans 624 1,086 2,072 4,531 Profit before tax 51 202 155 285 Fixed assets 30 26 23 25 Tax 14 48 51 77 Other current assets 98 211 159 384 PAT 37 154 104 208 Other Long Term Assets 0 22 33 39 Adj PAT 37 153 100 198 Total assets 1,699 1,964 2,899 5,414 Quarterly (Rs. Crs) Sep.13 Dec.13 Mar.14 June.14 Key Ratios FY11 FY12 FY13 FY14 Net interest income 49 55 65 78 Non interest income 11 88 20 6 Yield Ratios Total income 61 143 84 84 Avg Yield on Loans 16.7% 15.6% 15.9% 12.7% Operating expenses 5 4 6 5 Cost of Int Bearing Liab 11.4% 11.6% 9.0% 7.9% Operating profit 56 139 78 78 Net interest spread 5.3% 3.9% 6.9% 4.9% Provisions 4 3 9 3 Net interest margin 6.4% 7.4% 8.6% 6.9% Profit before tax 52 136 69 75 Gross NPA 0.0% 0.0% 0.0% 0.1% Taxes 15 26 23 20 Net NPA 0.0% 0.0% 0.0% 0.0% Loss on foreign currency 6 3 0 3 Capital adequacy ratio 84.5% 67.0% 42.0% 25.2% Net profit 30 107 46 52 Profitability Ratios FY11 FY12 FY13 FY14 Per share data FY11 FY12 FY13 FY14 Cost / Income Ratio 20.2% 11.5% 10.5% 7.0% EPS 0.66 2.74 1.85 3.70 Net profit margin 38.4% 87.1% 35.1% 42.8% BVPS 18.1 20.9 21.8 24.0 RONW 3.6% 13.1% 8.6% 16.1% Adj BVPS 18.1 20.9 21.8 24.0 Return on Assets 2.18% 3.22% 3.59% 3.84% DPS 0.0 0.0 0.3 1.0 Growth Ratios FY11 FY12 FY13 FY14 Dividend yield 0.0% 0.0% 0.9% 3.0% Advances growth 134.2% 74.2% 90.8% 118.6% Borrowing growth 49.7% 53.9% 114.0% 146.0% Valuation Ratios FY11 FY12 FY13 FY14 NII growth 1417.3% 115.3% 133.4% 40.9% P/E 50.63 12.17 18.00 9.02 PAT growth 45.4% 313.5% -34.4% 97.5% P/BV 1.84 1.60 1.53 1.39 Pre prov profit growth 40.1% 303.4% -20.0% 89.3% P/ABV 1.84 1.60 1.53 1.39 Non interest inc growth -13.3% 391.7% -79.3% 258.3% Source: Company data, Nirmal Bang Research
- 10. Ini t i a t in g Co ve ra ge PTC India Financial Service Limited Stock Idea –– 4 August 2014 Disclaimer: This Document has been prepared by Nirmal Bang Research (A Division of Nirmal Bang Securities PVT LTD). The information, analysis and estimates contained herein are based on Nirmal Bang Research assessment and have been obtained from sources believed to be reliable. This document is meant for the use of the intended recipient only. This document, at best, represents Nirmal Bang Research opinion and is meant for general information only. Nirmal Bang Research, its directors, officers or employees shall not in anyway be responsible for the contents stated herein. Nirmal Bang Research expressly disclaims any and all liabilities that may arise from information, errors or omissions in this connection. This document is not to be considered as an offer to sell or a solicitation to buy any securities. Nirmal Bang Research, its affiliates and their employees may from time to time hold positions in securities referred to herein. Nirmal Bang Research or its affiliates may from time to time solicit from or perform investment banking or other services for any company mentioned in this document. Nirmal Bang Research (Division of Nirmal Bang Securities PVT LTD) B-2, 301/302, Marathon Innova, Nr. Peninsula Corporate Park Lower Parel W), Mumbai-400013 Board No. : 91 22 3926 8000/8001 Fax. : 022 3926 8010