1. 1 | P a g e
ICICIdirect | Equity Research
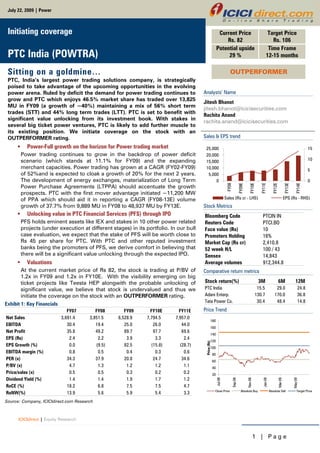
Exhibit 1: Key Financials
FY07 FY08 FY09 FY10E FY11E
Net Sales 3,691.4 3,851.5 6,528.9 7,794.5 7,957.0
EBITDA 30.4 19.4 25.0 26.0 44.0
Net Profit 35.8 49.2 89.7 97.7 69.6
EPS (Rs) 2.4 2.2 3.9 3.3 2.4
EPS Growth (%) 0.0 (9.5) 82.5 (15.8) (28.7)
EBITDA margin (%) 0.8 0.5 0.4 0.3 0.6
PER (x) 34.3 37.9 20.8 24.7 34.6
P/BV (x) 4.7 1.3 1.2 1.2 1.1
Price/sales (x) 0.5 0.5 0.3 0.2 0.2
Dividend Yield (%) 1.4 1.4 1.9 1.7 1.2
RoCE (%) 18.2 6.8 7.5 7.5 4.7
RoNW(%) 13.9 5.6 5.9 5.4 3.3
Source: Company, ICICIdirect.com Research
Analysts’ Name
Jitesh Bhanot
jitesh.bhanot@icicisecurities.com
Rachita Anand
rachita.anand@icicisecurities.com
Sales & EPS trend
0
5,000
10,000
15,000
20,000
25,000
FY08
FY09E
FY10E
FY11E
FY12E
FY13E
FY14E
0
5
10
15
Sales (Rs cr - LHS) EPS (Rs - RHS)
Stock Metrics
Bloomberg Code PTCIN IN
Reuters Code PTCI.BO
Face value (Rs) 10
Promoters Holding 16%
Market Cap (Rs cr) 2,410.8
52 week H/L 100 / 43
Sensex 14,843
Average volumes 912,344.8
Comparative return metrics
Stock return(%) 3M 6M 12M
PTC India 15.5 29.0 24.8
Adani Enterp. 130.7 170.0 36.8
Tata Power Co. 30.4 48.4 14.8
Price Trend
20
40
60
80
100
120
140
160
180
Jul-08
Sep-08
Nov-08
Jan-09
Mar-09
May-09
Price(Rs)
Close Price Absolute Buy Absolute Sell Target Price
July 22, 2009 | Power
Initiating coverage
PTC India (POWTRA)
Sitting on a goldmine…
PTC, India’s largest power trading solutions company, is strategically
poised to take advantage of the upcoming opportunities in the evolving
power arena. Ruled by deficit the demand for power trading continues to
grow and PTC which enjoys 46.5% market share has traded over 13,825
MU in FY09 (a growth of ~40%) maintaining a mix of 56% short term
trades (STT) and 44% long term trades (LTT). PTC is set to benefit with
significant value unlocking from its investment book. With stakes in
several big ticket power ventures, PTC is likely to add further muscle to
its existing position. We initiate coverage on the stock with an
OUTPERFORMER rating.
Power-Full growth on the horizon for Power trading market
Power trading continues to grow in the backdrop of power deficit
scenario (which stands at 11.1% for FY09) and the expanding
merchant capacities. Power trading has grown at a CAGR (FY02-FY09)
of 52%and is expected to cloak a growth of 20% for the next 2 years.
The development of energy exchanges, materialization of Long Term
Power Purchase Agreements (LTPPA) should accentuate the growth
prospects. PTC with the first mover advantage initiated ~11,200 MW
of PPA which should aid it in reporting a CAGR (FY08-13E) volume
growth of 37.7% from 9,889 MU in FY08 to 48,937 MU by FY13E.
Unlocking value in PTC Financial Services (PFS) through IPO
PFS holds eminent assets like IEX and stakes in 10 other power related
projects (under execution at different stages) in its portfolio. In our bull
case evaluation, we expect that the stake of PFS will be worth close to
Rs 45 per share for PTC. With PTC and other reputed investment
banks being the promoters of PFS, we derive comfort in believing that
there will be a significant value unlocking through the expected IPO.
Valuations
At the current market price of Rs 82, the stock is trading at P/BV of
1.2x in FY09 and 1.2x in FY10E. With the visibility emerging on big
ticket projects like Teesta HEP alongwith the probable unlocking of
significant value, we believe that stock is undervalued and thus we
initiate the coverage on the stock with an OUTPERFORMER rating.
Current Price
Rs. 82
Target Price
Rs. 106
Potential upside
29 %
Time Frame
12-15 months
OUTPERFORMER
2. 2 | P a g e
Company Background
PTC promoted by NTPC, Power Grid, PFC and NHPC was formed
with the primary objective of trading power, facilitating development
of power projects & power market and promoting exchange of
power with the neighbouring countries. PTC has enjoyed a
leadership position in power trading and currently commands
approx. 47% share in the trading market.
A range of services that are being offered by PTC include trading
activity, offering advisory services, fuel intermediation and
operations of small generation capacities. The company is trying to
move up the value chain and plans to be an integrated energy
player.
The company is focusing on acquisition of stakes in generating
assets through its subsidiaries. Going ahead, PTC plans to operate as
a private equity player providing all kinds of financing solutions to
the power projects. It has placed equity shares through the QIP route
twice in the past. In Jan 2008, the company raised Rs 1,200 crore at
the price of Rs 155 per share followed by an Rs 500 crore issue in
May 2009 at Rs 75 per share.
PTC has tied up for power tolling arrangements (PTA), which should
play a crucial role in driving the future growth. Under the
arrangement, PTC will purchase coal and route it to the power plant
for generation in return for a fixed consideration. The power
generated will then be owned by PTC which it will offer for sale.
PTC has entered into LTPPA with capacities close to 11,226 MW and
memorandum of understanding (MoU) of 25,907 MW. The MoUs
and PPAs are likely to materialise into operating performance of the
company gradually going forward.
Exhibit 2: Company structure
PTC India Ltd
PTC Financial Services (PFS) PTC Energy Athena Energy Ventures Ltd.
(AEVPL)
Teesta Energy Ventures
1200MW HEP
77.6% 100% 20% 11%
India Energy Exchange (IEX)
26%
Investments in Renewable
Energy
Wind Farm in Maharashtra
(6MW)
100%
Krishna Godavari Power
Utility 63MW of Coal
52%
Investments in conventional
energy
Source: Company, ICICIdirect.com Research
Share holding pattern (Q1FY10)
Shareholder % holding
Promoters 16.3
Institutional investors 67.1
Other investors 6.7
General public 10.0
Promoter & Institutional holding trend (%)
21.1%
21.1%
21.1%
16.3%
58.2%
59.7%
60.3%
67.1%
0%
20%
40%
60%
80%
100%
Q2 Q3 Q4 Q1
Promoter Holding Institutional Holding
3. 3 | P a g e
Nodal agency for cross border trades
PTC is the nodal agency for cross-border power trade. The coveted
position of being a nodal agency will offer additional upsides with
the long term visibility to PTC’s core business. India has been
exploring an opportunity to develop its relations in trading power
with three neighbouring countries with immense hydropower
potential as summarized in Exhibit 3.
Exhibit 3: Hydro Power capacities in Indian neighbourhood
Country Potential MW
Myanmar 100,000
Nepal 83,000
Bhutan 23,760
Source: CEA, ICICIdirect.com Research
Currently, PTC purchases power from three hydro-based generators
in Bhutan. The overall generation capacity of these three plants
being nearly 1,416 MW. PTC is also evaluating options for increasing
the cross-border power trade with Nepal. The company has an MOU
for power supply of 60 MW, and is evaluating an MOU for an
additional 200 MW. PTC entered a PPA with West Seti power project
in Nepal for 750 MW which is expected to commence operations in
2013.
Investment book
PTC enjoys a vital role of acting as an intermidiary in the power
market. It has provided assistance to a number of generators with
the objective of facilitating the financial closure of their projects. By
shopping for a minor ownership in several generators, PTC is able to
negotiate the LTPPA deal for trading their entire generation. Major
investments vehicles under which the company is actively scouting
for projects are summarized in Exhibit 4.
Exhibit 4: List of investments
Investments
Current
Stake (%)
Investment
Amount (Rs Cr)
Total Commitment
(Rs Cr)
PTC Financial Services 77.6 446 446
PTC Energy 100.0 41 41
Athena Energy ventures 20.0 30 150
Teesta Urja Limited 11.0 125 136
Krishna Godavari utility 52.0 15 40
Wind Power Project 100.0 36 36
Total Investment 693 849
Source: Company, ICICIdirect.com Research
PTC being the nodal agency enjoys
an eminent position in cross border
trades. This offers additional visibility
to PTC trading business
4. 4 | P a g e
INVESTMENT RATIONALE
Power-Full growth on the horizon for Power trading market
Traditionally power in India has been sold through the LTPPA‘s
between generators and distributors. The contracts essentially work
on an assured return mechanism promising a fixed cost plus ROE.
The power deficit situation has necessitated the need for trading.
However the trading market in India remains to be in an evolving
stage. Though the recent changes in key regulations like merchant
power and development of open access mechanism have aided the
development of trading market, we believe that the reforms will
continue to evolve in future as well and eventually benefit PTC.
We believe that the volume of traded power as a percentage of total
generation will continue to grow on the back of upcoming merchant
capacities, geographical generation & demand mismatch, evolving
regulations on energy exchanges and the contracted LTPPA’s which
are likely to kick in over the coming years.
Exhibit 5: Overall India generation viz.% of volumes traded
515,247
531,594
558,507
587,432
617,511
662,523
704,469
723,794
767,221
805,582
2.0 2.0 2.3
3.0
4.1
5.0 5.3
0.80.3 2.3
0
100,000
200,000
300,000
400,000
500,000
600,000
700,000
800,000
900,000
2002 2003 2004 2005 2006 2007 2008 2009E 2010E 2011E
0
2
4
6
8
10
Total Generation - MU (LHS) Volume traded % of total generation (RHS)
Source: Company, CEA, ICICIdirect.com Research
Power situation is likely to improve from an 11.1% deficit in FY09 to
8.3% in FY10E primarily led by softening GDP growth &
improvement in availability of gas. However we believe the deficit
will expand due to the increased demand due to the renewed
growth prospects of GDP. Total traded volumes have witnessed a
52% CAGR (FY02-FY09E). We expect the traded volume to grow at
20% over the next 2 years, thereby reaching 42,784 MU in FY11E.
Exhibit 6: Supply situation within the country and the volumes of traded units
400,000
500,000
600,000
700,000
800,000
900,000
2001
2002
2003
2004
2005
2006
2007
2008
2009
2010E
2011E
7
8
9
10
11
12
Deficit - RHS Demand MU - LHS Supply MU - LHS
Source: CEA, ICICIdirect.com Research
4,178
11,029
11,847
14,188
15,023
20,965
29,731
38,218
1,617
42,784
0
5,000
10,000
15,000
20,000
25,000
30,000
35,000
40,000
45,000
2002
2003
2004
2005
2006
2007
2008
2009E
2010E
2011E
Million Units (MU)
Generation continues to grow in
the backdrop of planned capacities
and the trading volumes are
expected to grow on the back of
upcoming merchant capacities,
demand – supply mismatch and
contracted LTPPA.
5. 5 | P a g e
On the supply side, we believe ~14,250 MW of captive and
merchant or uncommitted capacity is scheduled to come in over the
next 3-4 years, comprising of ~7,100 MW under merchant or
uncommitted category and the rest under the captive generation
thus ensuring the growth on the supply side over the coming years.
Exhibit 7: List of upcoming Merchant and Uncommitted capacities
Company Project
Capacity -
MW
Uncommitted/M
erchant
Power(MW) Likely CoD
Adani Power Mundra & Tiroda 6,600 1,900 2011-13
ADHPL Allain Duhangan 192 192 2010
GMR Kamlanga 1,050 210 2012
GMR Vemagiri - extn 800 800 2012
GVK Gautami, JP II 664 133 2009-2010
Jaiprakash Karcham Wangtoo 1,000 176 2012
JSW Energy Toranagallu, Vijaynagar 600 300 2010
JSW Energy Ratnagiri 1,200 1,200 2011-2012
Konaseema Konaseema 445 89 2009-2010
Lanco Infratech Kondapalli extn. 366 366 2010-2011
Relaince Power Rosa II 600 300 2012
Sterlite Energy Jharsuguda 600 600 2010
Teesta Energy Teesta III 1,200 360 2012-13
Tata Power Rithala 108 108 2011
Tata Power Haldia 120 90 2009
Tata Power Trombay 250 100 2009
Torrent Power Sugen 1,128 203 2009-2010
Total - (a) 16,923 7,127
Source: ICICIdirect.com Research
Exhibit 8: Upcoming capacity in the XI th 5 year plan
XIth 5 year plan (2008-2012) Units
Envisaged
capacity
Installed capacity
as on March 2007
Installed till June
2009
Commissioned in
the XI th plan
Under implementation
in XI th plan
Captive capacity - (b) MW 12,000.0 14,636.0 19,509.0 4,873.0 7,127.0
Total capacity under XI th plan ((a)+(b)) 14,254.0
Source: CEA, Planning commission, ICICIdirect.com Research
6. 6 | P a g e
PTC riding the first mover wave
As observed in Exhibit 9, PTC has been loosing market share
primarily to the newer entrants in the market. We expect PTC will
start realizing the benefit of it being the first mover in the power
trading arena. PTC after the relaxation of trading norms in 2003 has
been able to target several LTPPA’s which should help the company
regain its market share.
Exhibit 9: PTC market share in the overall traded volume
1,617
4,178
11,029
8,887
10,119
9,549
9,889
13,827
18,727
21,392
20,965
29,731
38,218
42,784
14,188
15,023
11,847
11,029
1,617
4,178
0
10,000
20,000
30,000
40,000
50,000
60,000
2002 2003 2004 2005 2006 2007 2008 2009E 2010E 2011E
0
20
40
60
80
100
PTC vols (MU) Total Trade vols(MU) PTC Market Share(%) - RHS
Source: Company, ICICIdirect.com Research
We expect short term volumes to stabilize for PTC around the
current levels. The competition within the short term trade category
is expected to fire up with the entry of newer players. However we
believe that the company will be able to retain its volumes in the
Short Term Trading (STT) category because of evolution of newer
variants of contracts at IEX.
Exhibit 10: Mix of Trading volumes - PTC
7,152
8,357
6,586
7,726
9,097
8,762
8,762
8,762
4,611
3,759
162
9,278
6,100
5,2781,751
419 1,735 1,762
38,681
2,963
9,630
12,630
14,490
0
6,000
12,000
18,000
24,000
30,000
36,000
42,000
48,000
2002 2003 2004 2005 2006 2007 2008 2009 2010E 2011E 2012E 2013E
Millionunits(MU)
Short Term Volume Long Term Volume
Source: Company, ICICIdirect.com Research
Volumes under LTPPA
are expected to report
a (FY08-FY13E) of
49%. For the
composition of
volumes under LTPPA
refer to the Annexures
LTPPA’s of ~11,200 MW
initiated by PTC as of March
2009 will start delivering the
volume growth
7. 7 | P a g e
Core trading & tolling arms to translate into a zooming profitability
PTC’s trading arm aided with PTA’s should act as catalysts in the
EBITDA growth which is expected to witness a CAGR (FY09E-FY13E)
of 88%. Margins in the power trading business are capped at Rs 0.04
per Kwh, however significant volume growth should aid the overall
growth in EBITDA. PTC has entered PTA’s of 360 MW for a period of
25 years which will provide significant boost to the margins from
FY11E onwards.
Exhibit 11: EBITDA to ride a sin curve
19.4 25.0 26.0 44.0
163.3
310.0
0.0
89.8
271.5
3.9
69.2
0.0
0
50
100
150
200
250
300
350
FY08 FY09 FY10E FY11E FY12E FY13E
-50
0
50
100
150
200
250
300
EBITDA - (Rs Cr.) LHS Growth (%) RHS
Source: Company, ICICIdirect.com Research
Margins of core business to expand after commencement of PTA
Risks and rewards of the Power Tolling Agreements(PTAs) are
significantly different from those of the trading business. In a PTA,
power will be owned by PTC after having provided for the fuel and
other requirements to the generator. This translates to job work
being done by the generator for a fixed charge. We expect the
revenues/unit from PTA’s to stabilize near the merchant tariff rates.
And we expect the merchant tariff rates to stabilize in the range of Rs
4-4.5/Kwh. For our financial estimates we have taken the lower end
of the range. Additionally, PTA’s will provide an opportunity for
higher margins.
The first PTA is with Simhapuri thermal power project which
achieved financial closure. Simhapuri project is expected to
commission the generation capacity by FY11. Out of 270 MW of total
generation from this particular unit, PTC has tied up for 190 MW.
PTC entered its second PTA with the Meenakshi group which is
setting up a 270 MW coal-based plant based on imported fuel. Out of
270 MW, PTC has tied up 160 MW of capacity.
Exhibit 12: Margins at core trading and tolling business
0.0
0.5
1.0
1.5
2.0
FY06 FY07 FY08 FY09 FY10E FY11E FY12E
EBITDA / Net Sales (%) EBIT / Net Sales (%)
Source: Company, ICICIdirect.com Research
Expansion of EBITDA margins
from 0.4% to 2.0% in FY13E after
the commencement of PTA
contracts.
The core business which operates
on an annuity based model is
likely to witness significant
growth and will inculcate further
strength to the company’s
financials
8. 8 | P a g e
Unlocking value in PTC Financial services through IPO
PTC financial services (PFS) holds eminent assets within its portfolio.
It is a promoter of niche assets like IEX and has about 10 other
projects under execution at different stages.
PFS is preparing to obtain an independent credit rating which will
help the company in raising debt and is a potential candidate for IPO
which will lead to significant unlocking of value for PTC, however the
size of the IPO is still undecided. We believe that 77.6% stake of PTC
in PFS will offer significant upside. Exhibit 13 details the projects
under development of PTC financial services.
Exhibit 13: Portfolio of PTC Financial Services
Projects
Stake
acquired(%)
Capacity -
MW State
Likely
commissioning
Energy Exchange
IEX 26.0 India June-08
Investments in Renewable Projects 0.0
Biomass Projects 26.0 10 Maharashtra 2009-10
Biomass Projects 26.0 12 Overall India 2010-11
Wind cum Bio Diesel project 37.0 100 Maharashtra 2009-10
Solar project 37.0 3 Haryana NA
Investments in conventional Projects 0.0
Thermal Coal 26.0 189 Tamil Nadu 2009-10
Thermal Coal 26.0 270 Andhra Pradesh 2010-11
Thermal Coal 10.0 700 Tamil Nadu NA
Thermal Coal NA 1,320 Andhra Pradesh 2012-13
Investments in equipment manufacturers
Wind Turbine manufacturing unit NA NA Haryana NA
Thin film and solar power module 49.0 NA Hyderabad NA
Total capacity 2,604
Source: Company, ICICIdirect.com Research
IEX and Power exchange India (PXIL) are the two operational power
exchanges and a third exchange is on the verge of getting
operational. IEX has witnessed strong growth in the average trading
volumes. Since inception from June 2008, IEX has traded more than
4,366 MU of power. The regulations for the energy exchange are still
evolving. Power exchanges currently are operating only a single
product in day ahead market, however we believe that with the
launch of new forward contracts in week ahead and month ahead
market, the volumes should increase significantly.
Exhibit 14: Daily volumes at IEX
0
4,000
8,000
12,000
16,000
20,000
24,000
28,000
Jul-08 Sep-08 Nov-08 Dec-08 Feb-09 Apr-09 May-09 Jul-09
Volumes(1000Kwh)
Source: IEX, ICICIdirect.com Research
9. 9 | P a g e
11% stake in Teesta energy HEP (1,200 MW) – a shining star
PTC has acquired 11% stake in Teesta Urja Limited (TUL), scheduled
for commissioning in 2012-13. The 5,700 crore project is financed in
a mix of 80% debt and 20% equity and the financial closure of the
project was received in Sept 2007. Rural Electrification Corporation
is the lead lender for the project.
The 1,200 MW hydroelectric power project has already received all
the clearances and the physical progress of the project is in line with
targeted deadline.
PTC has entered an off take arrangement for 35 years and we
believe that 30% of the generation which is to be sold through
merchant route which will offer significant upside. We also believe
that execution remains a key risk for a hydro power project of such a
size. Once clarity on the execution is established, TUL would be a
rewarding asset to be owned.
Exhibit 15 summarizes the profitability to PTC from Teesta Energy
HEP.
Exhibit 15: Per unit Profitability from Teesta Energy HEP to PTC
Total
Per unit
Rs
Total
Rs crore
Per unit
Rs
Total
Rs crore Rs crore
Revenues 2.8 895.3 4.0 557.6 1,452.9
Cost of production 0.5 162.6 0.5 69.7 232.3
EBITDA 2.3 732.7 3.5 487.9 1,220.6
Interest 1.2 383.0 1.2 164.2 547.2
Depreciation 0.6 210.7 0.6 90.3 301.0
PBT 0.4 139.0 1.7 233.4 372.4
Tax 0.0 15.3 0.2 25.7 41.0
PAT 0.4 123.7 1.5 207.7 331.4
Profit share for PTC @ 11% stake 36.5
Per share contribution to PTC 1.2
Capex(Rs Cr) 5,700
Capacity(in MW) 739.2 316.8 1,200
Units produced(in millions units) 3,252.5 1,393.9 5,280
Regulated Merchant
Source: Company, ICICIdirect.com Research
Power deficit in neighboring countries to provide additional opportunity
PTC has managed to increase the cross-border power trade with
Nepal as the country is facing severe power shortages since last
couple of months. PTC has been supplying close to 50 MW of power
since the last week of February 2009 and is rebuilding old
transmission capabilities to increase the cross-border trade. It has
negotiated for the supply of additional 30 MW which is likely to
commence by early May 2009.
In 4QFY09 the cross-border power trade with Bhutan had fallen by
17% compared to the same quarter last year. However, we expect
the scenario to be a minor aberration and the volumes should pick-
up from the next quarter onwards.
10. 1 0 | P a g e
RISKS & CONCERNS
Regulatory developments
Core business of PTC, that is, power trading, is a regulated business.
Any negative development on the regulatory front would impact the
prospects of the company. It may be noted that the regulator had
capped the margin at 4 paisa per unit two years ago.
According to recent policy initiatives, PTC is not entitled to charge
more than 4 paisa per unit of volume on the cross-border power
trades. This will reduce the pricing flexibility available to PTC for
negotiating fresh contracts. However, existing PPAs with Bhutan are
within the prescribed limit which will not bear the impact of the
recent policy initiatives.
Profitability under PTA to vary based on prevailing market rates
Power tolling arrangements (PTAs) made by the company have
significantly different risk and reward profiles. Power contracted with
power tolling parties is owned by PTC and will expose the company
to similar risk profile as that of a merchant power plant. The
company has been focusing on this business with the intent of
increasing margins.
Credit crunch may result in delay of upcoming capacities
Investments in generating assets at a time when capital is a scarce
commodity can be extremely risky. Business model of PTC under
such a situation will act as a double whammy. If the project gets
shelved or struck due to any reason, PTC will have to bear the
downside from the equity participation in the project. Also, this will
lead to a tapered growth in trading volumes of the company.
Dilution of equity expected in near future
Fresh dilution planned by the company is a significant concern. PTC
is already sitting on huge liquid investments in its book to the tune of
~ Rs 1,000 crore. Part of the liquidity is committed for future projects
which is already hampering their return ratios. The plan for fresh
dilution will impact the return ratios even further in the short run.
Weak position of JV partners
The turmoil in the global financial markets has significantly
hampered the ability of its JV partners to raise fresh capital in the
market. Capital contribution from the JV partners for future projects
cannot be considered and may impact the progress of several
projects. PTC may have to allocate additional funds in the project
which would have its own repercussions.
Uncertainties associated with trading volume
Short-term trading volumes of the company can be highly volatile
and long term PPA’s can witness some unexpected delays due to
several reasons. At present, the company is also exposed to
volatility in rainfall to a significant extent as significant portion of
capacity in the portfolio consists of hydro-based generators. With
the expectation of other capacities coming up in the future we
expect the dependence on rainfall to mitigate.
The fact that the company has
partnered with small and medium
size generators will exaggerate the
risk of delivering on the promised
capacity addition.
More than 75% of the overall
volumes are expected to come
from Long term trades in FY13. Any
major trading volume might impact
the performance of the company in
future
The fact that the company has
partnered with small and medium
size generators will exaggerate the
risk of delivering on the promised
capacity addition.
11. 1 1 | P a g e
FINANCIALS
Significant growth in top line over next 5 years
After having witnessed a volume growth at a CAGR (FY07-FY09E) of
20.3%, the revenues were seen to grow by 32% also contributed by
the increased realizations. The average realization grew by 9% to Rs
4.7 per Kwh during the same period. The volumes are expected to
grow by a CAGR (FY09E-FY13E) of 37.2% which should corroborate
to 24% growth in revenues after having taken a 10% hit on
realization to Rs 3.1 per Kwh.
Exhibit 16: Revenue growth pegged at 24% CAGR till FY13E
Source: Company, ICICIdirect.com Research
Blended gross margin per unit set to expand
After consolidation at the present levels the margins are set to
increase gradually over the years. With the commencement of PTA
in September 2011 the margin per unit will further move in a north
ward trajectory. Exhibit 17 depicts the movement of margins till
FY13 which would range 3.3-3.9 paisa per Kwh. We anticipate the
margins from PTA to be as high as 100 paisa per Kwh as compared
to the 4 paisa per Kwh cap on trade volumes.
Exhibit 17: Blended gross margin (Paisa per Kwh)
3.9 3.9
3.8
3.6
3.5
3.3
3.4
3.5
3.4
3.6
3.7
3.4
3.6
3.7
3.6
3.6
3.7
3.8
3.9
3.7
3.5
3.0
3.3
3.5
3.8
4.0
Jun-08
Sep-08
Dec-08
M
ar-09
Jun-09
Sep-09
Dec-09
M
ar-10
Jun-10
Sep-10
Dec-10
M
ar-11
Jun-11
Sep-11
Dec-11
M
ar-12
Jun-12
Sep-12
Dec-12
M
ar-13
Jun-13
Grossmargin-paisaperKwh
Source: Company, ICICIdirect.com Research
The volume growth is expected
to be realized from the long-
term PPAs which would start to
kick in from 2013 onwards
translating into a CAGR (FY09E-
FY13E) of 59% to 38,681 MU in
FY13E
3,766.5
3,906.1
6,528.9
7,794.5
7,957.0
8,887.7
15,197.8
0
2,000
4,000
6,000
8,000
10,000
12,000
14,000
16,000
FY07 FY08 FY09 FY10E FY11E FY12E FY13E
0
10
20
30
40
50
60
70
80
Revenue(Rs cr - LHS) Growth (% - RHS)
12. 1 2 | P a g e
Pressure on RoE and RoCE to relieve after the commencement of PTA
Return ratios of PTC are very low owing to the ongoing expansion
projects of the company. PTC has been on an expansion spree and
had raised around Rs 1,200 crore worth of QIP last year. A
significant part of the money raised is still in the process of being
deployed. PTC has been acquiring stakes in several projects through
its subsidiaries. However, considering that a majority of the projects
are at a nascent stage, we expect the strength in the business
operation to start getting reflected with a lag effect.
Exhibit 18: Low RoE & RoCE
0
3
6
9
12
15
18
21
FY07 FY08 FY09 FY10E FY11E FY12E FY13E
ROE(%) ROCE(%)
Source: Company, ICICIdirect.com Research
13. 1 3 | P a g e
VALUATIONS
PTC is a leading power trading utility in India. The power trading
market is still at a nascent stage in India. With many players entering
the market, the dynamics are likely to change slightly. PTC plans to
become an integrated energy player in the power sector.
India continues to witness accumulated peak deficit in power to the
tune of 11.1% in March 2009. The demand-supply situation
continues to witness significant pressure even at a time when
economic growth has eased off. Strategic investments like India’s
first energy exchange has given a bonanza for PTC with respect to
additional volumes in its core trading business. In considering the
overall valuation we have adopted a conservative approach and
factored in the expected possible delays of the up coming
generation capacities.
We have assigned a value of Rs 47 to the core trading and tolling
business based on DCF valuation methodology. Cash is valued at
1.0x book value(BV). The investments of the company are given a
multiple of 1.5x BV for operating assets and 1.0x BV for all the assets
under construction.
For PTA we have assumed the realisation per unit of Rs 4.0.
Significant upside to the stock is possible if PTC can manage an
average realisation exceeding Rs 4.0 per unit. In a scenario where
the company can mange an average realisation of Rs 4.5, we expect
the fair value to witness a significant increase to around Rs 121
levels.
PTC also stands at a favourable position as prices of power assets
have started witnessing a correction in the last couple of quarters
and with adequate cash in the books it places the company in a
powerful spot to negotiate for the assets at better valuations. This
will also help the company in negotiating investments at a better
price. We feel the stock will offers better margins of safety as the
company is expected to hold significant amount of liquidity ~Rs
1,000 crore at the end of Q4FY09. At the current market price of Rs
82, the stock is trading at P/BV of 1.2x in FY09 and 1.2x in FY10E.
With the visibility emerging on big ticket projects like Teesta HEP
alongwith the probable unlocking of significant value. Hence, we
initiate coverage on the stock with a OUTPERFORMER rating.
Exhibit 19: Valuation of projects for PTC India
Base case* Bull Case**
Projects Rs Crores per share Rs Crores per share
Value of Core business - Power Trading and Tolling business 1,375 46.8 1,375 46.8
Cash and Cash equivalents 1.0 x BV 245 8.3 245 8.3
PTC Financial Services 446 15.2 1,338 45.5
Athena Energy ventures 30 1.0 30 1.0
Teesta Urja Limited 125 4.3 375 12.8
Krishna Godavari utility 15 0.5 15 0.5
Wind Power Project 54 1.8 54 1.8
Other Investments at 1.0 x BV 836 28.4 836 28.4
Total Equity Value 3,127 106 4,269 145
* All the investments not under operations are taken at 1.0 x Book value
**Assumed - PTC financial services is successfully able to tap the IPO market at a P/B of 3 times.
Teesta energy is succesfully able to execute the 1200 MW hydel project
Source: Company, ICICIdirect.com Research
Value of core business along with
the treasury investments are worth
Rs 83 per share. The upside is
expected from the value unlocked
from its subsidiaries
Historical average realization for
PTC in 2008-09 has been Rs 4.7 per
unit.
14. 1 4 | P a g e
Key Financials
P&L Statement (Rs Crore) Key ratios (Profit & Loss Account) (%)
FY07 FY08 FY09E FY10E FY11E FY07 FY08 FY09E FY10E FY11E
Sales 3,766.5 3,906.1 6,528.9 7,794.5 7,957.0 Emp Exp 6.1 8.1 15.0 15.4 15.7
Growth (%) 0.0 3.7 67.1 19.4 2.1 Admin & General exp 8.8 9.4 15.3 18.8 19.2
Op. Expenditure 3,736.2 3,886.8 6,503.9 7,768.5 7,913.1 Average cost of debt 0.0 0.0 0.0 0.0 0.0
EBITDA 30.4 19.4 25.0 26.0 44.0 Effective Tax rate 22.7 17.3 20.1 27.9 29.5
Growth (%) -36.3 29.2 3.9 69.2 Profitability ratios (%)
Other Income 19.4 43.2 96.0 110.6 58.8 EBITDA Margin 0.8 0.5 0.4 0.3 0.6
Depreciation 3.4 3.1 6.2 1.1 4.0 PAT Margin 1.0 1.3 1.4 1.3 0.9
EBIT 46.4 59.5 114.8 135.5 98.8 Adj. PAT Margin 0.5 0.3 0.2 0.2 0.3
Interest 0.0 0.0 2.5 0.0 0.0 Per share data (Rs)
PBT 46.4 59.5 112.3 135.5 98.8 Revenue per share 251.1 171.8 287.1 265.0 270.6
Growth (%) 28.2 88.8 20.7 -27.1 EV per share 78.8 76.6 72.2 73.7 68.6
Tax 10.5 10.3 22.6 37.8 29.1 EV per unit traded 0.1 0.2 0.1 0.1 0.1
Extraordinary Item 0.0 0.0 0.0 0.0 0.0 Book Value 17.7 65.1 67.6 70.9 72.1
Rep. PAT before MI 35.8 49.2 89.7 97.7 69.6 Cash per share 3.2 5.4 9.8 8.3 13.4
Minority interest (MI) 0.0 0.0 0.0 0.0 0.0 EPS 2.4 2.2 3.9 3.3 2.4
Rep. PAT after MI 35.8 49.2 89.7 97.7 69.6 Cash EPS 2.6 2.3 4.2 3.4 2.5
Adjustments* 16.5 36.7 76.8 82.9 44.1 DPS 1.2 1.2 1.8 1.7 1.2
Adj. Net Profit 19.3 12.4 12.9 14.7 25.6 Costs as % to sales except tax rate and average cost of debt
Growth (%) -35.7 3.5 14.2 73.8
* Post Tax other income is excluded
Balance Sheet (Rs crore) Key ratios (Balance sheet) (%)
FY07 FY08 FY09E FY10E FY11E Return ratios FY07 FY08 FY09E FY10E FY11E
Equity Capital 150.0 227.4 227.4 294.1 294.1 RoNW 13.9 5.6 5.9 5.4 3.3
Preference capital 0.0 0.0 0.0 0.0 0.0 ROCE 23.6 18.2 6.8 7.5 7.5
Reserves & Surplus 115.6 1,252.1 1,309.1 1,791.3 1,826.1 Financial health ratio
Shareholder's Fund 265.6 1,479.6 1,536.5 2,085.4 2,120.2 Operating CF (Rs Cr) 7.2 23.1 74.5 -20.8 7.0
Minority Interest 0.0 0.0 0.0 0.0 0.0 FCF (Rs Cr) 6.6 -13.6 74.5 -320.8 7.0
Secured Loans 0.0 0.0 0.0 0.0 0.0 Cap. Emp. (Rs Cr) 263.9 1,477.2 1,536.5 2,085.4 2,120.2
Unsecured Loans 0.0 0.0 0.0 0.0 0.0 Debt to equity (x) 0.0 0.0 0.0 0.0 0.0
Deferred Tax Liab. 0.9 5.1 8.4 8.4 8.4 Debt to cap. emp. (x) - - - - -
Source of Funds 266.5 1,484.6 1,544.9 2,093.8 2,128.6 Interest Coverage (x) NA NA 45 NA NA
Gross Block 23.5 59.6 59.6 359.6 359.6 Debt to EBITDA (x) 0.0 0.0 0.0 0.0 0.0
Less: Acc. Depr. 6.5 7.6 9.9 11.0 15.0 DuPont ratio analysis
Net Block 17.0 52.0 49.7 348.6 344.6 PAT/PBT 0.8 0.8 0.8 0.7 0.7
Capital WIP 0.5 1.1 1.1 1.1 1.1 PBT/EBIT 1.7 3.7 6.0 5.4 2.5
Net Fixed Assets 17.5 53.1 50.8 349.7 345.8 EBIT/Net sales 0.0 0.0 0.0 0.0 0.0
Intangible asset 0.0 0.0 0.0 0.0 0.0 Net Sales/ Tot. Asset 14.3 4.4 4.3 4.3 3.8
Investments 211.1 1,326.3 1,287.7 1,505.9 1,389.0 Total Asset/ NW 1.7 4.6 6.7 7.0 7.2
Liquid investments - - - - - Spread of RoIC over WACC (?????) (%)
Trade Receivables 162.5 179.4 413.0 433.8 495.8 RoIC
Cash 48.2 123.5 222.8 245.4 393.3 WACC
Loans & Advances 52.3 69.6 129.1 135.6 154.9 EVA
Total Current Asset 263.0 372.6 764.8 814.8 1,044.1
Current Liab. & Prov. 227.3 268.0 563.2 581.5 655.1
Net Current Asset 35.7 104.6 201.7 233.3 389.0
Misc Expenditure 1.7 2.3 0.0 0.0 0.0
Application of funds 266.1 1,486.4 1,540.1 2,088.9 2,123.7
15. 1 5 | P a g e
contd...
Cash Flow Statement (Rs crore) Working Capital Ratios
FY07 FY08 FY09E FY10E FY11E FY07 FY08 FY09E FY10E FY11E
Profit after Tax 45.7 58.9 112.3 135.5 98.8 Working cap./Sales 0.0 0.0 0.0 0.0 0.0
Other Non Cash exp 2.0 1.7 0.8 0.0 0.0 Debtor turnover 15.8 16.8 23.1 20.3 22.7
Depreciation 1.4 1.4 3.1 1.1 4.0 Creditor turnover 16.2 17.9 27.3 23.7 26.7
Diect Tax Paid 11.8 2.0 18.0 37.8 29.1 Current Ratio 1.2 1.4 1.4 1.4 1.6
Interest Income 10.5 34.0 29.0 110.6 58.8 Quick ratio 1.2 1.4 1.4 1.4 1.6
CF before chg in WC 26.8 26.0 69.2 -11.9 14.8 Cash to abs. Liab. 0.2 0.5 0.4 0.4 0.6
Inc./(Dec.) in Curr Liab 35.0 40.7 295.2 18.3 73.6
Inc./(Dec.) in Curr Ass. 45.7 34.3 292.5 27.3 81.4 EBITDA
CF from operations 16.1 32.3 71.9 -20.8 7.0 Less: Tax
Purchase of Fixed Ass -0.5 -36.7 0.0 -300.0 0.0 NOPLAT
(Inc.)/Dec. in Inv (19.8) (1,115.2) 38.7 (218.3) 116.9 Capex
CF from Investing (0.9) (1,108.7) 67.7 (407.7) 175.7 Change in working cap.
Inc./(Dec.) in Debt - - - - - FCF
Inc./(Dec.) in NW - 1,191.9 - 500.0 -
CF from Financing - 1,191.9 - 500.0 -
Opening Cash bal 59.4 48.2 123.5 222.8 245.4
Closing Cash bal 48.2 123.5 222.8 245.4 393.3
16. 1 6 | P a g e
Annexure
Exhibit 20: Composition of Long term volumes in FY10E
Total Volume 9,630 MU
Torrent Sugen + Gas
based plants, 521
Other, 1,268
Ind Bharath group of
companies, 743
Imported Bhutan, 5,647
Other Long term PPA's,
174
Amarkantak Phase - I,
1,450
Baglihar, 1,095
Source: Company, ICICIdirect.com Research
Exhibit 21: Composition of long term volumes in FY13E
Total Volume 38,681 MU
Imported Bhutan, 5,610
Amarkantak Phase - II,
2,359
Dheeru, 3,538
Kamlanga, 4,644
Ind Bharath group of
companies, 1,486
Chattisgarh Project, 7,784
Baglihar, 1,095
Other, 5,726Malaxmi Phase - II, 5,307
Torrent Sugen + Gas
based plants, 1,341
Amarkantak Phase - I,
2,228
Karcham Wangtoo , 1,999
Other Long term PPA's,
1,292
Source: Company, ICICIdirect.com Research
17. 1 7 | P a g e
RATING RATIONALE
ICICIdirect endeavors to provide objective opinions and recommendations. ICICIdirect assigns
ratings to its stocks according to their notional target price vs current market price and then
categorizes them as Outperformer, Performer, Hold, and Underperformer. The performance
horizon is 2 years unless specified and the notional target price is defined as the analysts'
valuation for a stock.
Outperformer: 20% or more;
Performer: Between 10% and 20%;
Hold: +10% return;
UnderPerformer: -10% or more;
Pankaj Pandey Head – Research pankaj.pandey@icicidirect.com
ICICIdirect.com Research
Desk,
ICICI Securities Limited,
7th Floor, Akruti Centre Point,
MIDC Main Road, Marol Naka
Andheri (East)
Mumbai – 400 093
research@icicidirect.com
ANALYST CERTIFICATION
We /I, Jitesh Bhanot ACA Rachita Anand BE, MBA (Finance) research analysts, authors and the names subscribed to this report, hereby certify that all of the views expressed in this
research report accurately reflect our personal views about any and all of the subject issuer(s) or securities. We also certify that no part of our compensation was, is, or will be directly or
indirectly related to the specific recommendation(s) or view(s) in this report. Analysts aren't registered as research analysts by FINRA and might not be an associated person of the ICICI
Securities Inc.
Disclosures:
ICICI Securities Limited (ICICI Securities) and its affiliates are a full-service, integrated investment banking, investment management and brokerage and financing group. We along with
affiliates are leading underwriter of securities and participate in virtually all securities trading markets in India. We and our affiliates have investment banking and other business relationship
with a significant percentage of companies covered by our Investment Research Department. Our research professionals provide important input into our investment banking and other
business selection processes. ICICI Securities generally prohibits its analysts, persons reporting to analysts and their dependent family members from maintaining a financial interest in the
securities or derivatives of any companies that the analysts cover.
The information and opinions in this report have been prepared by ICICI Securities and are subject to change without any notice. The report and information contained herein is strictly
confidential and meant solely for the selected recipient and may not be altered in any way, transmitted to, copied or distributed, in part or in whole, to any other person or to the media or
reproduced in any form, without prior written consent of ICICI Securities. While we would endeavour to update the information herein on reasonable basis, ICICI Securities, its subsidiaries
and associated companies, their directors and employees (“ICICI Securities and affiliates”) are under no obligation to update or keep the information current. Also, there may be regulatory,
compliance or other reasons that may prevent ICICI Securities from doing so. Non-rated securities indicate that rating on a particular security has been suspended temporarily and such
suspension is in compliance with applicable regulations and/or ICICI Securities policies, in circumstances where ICICI Securities is acting in an advisory capacity to this company, or in
certain other circumstances.
This report is based on information obtained from public sources and sources believed to be reliable, but no independent verification has been made nor is its accuracy or completeness
guaranteed. This report and information herein is solely for informational purpose and may not be used or considered as an offer document or solicitation of offer to buy or sell or subscribe
for securities or other financial instruments. Though disseminated to all the customers simultaneously, not all customers may receive this report at the same time. ICICI Securities will not
treat recipients as customers by virtue of their receiving this report. Nothing in this report constitutes investment, legal, accounting and tax advice or a representation that any investment or
strategy is suitable or appropriate to your specific circumstances. The securities discussed and opinions expressed in this report may not be suitable for all investors, who must make their
own investment decisions, based on their own investment objectives, financial positions and needs of specific recipient. This may not be taken in substitution for the exercise of independent
judgement by any recipient. The recipient should independently evaluate the investment risks. The value and return of investment may vary because of changes in interest rates, foreign
exchange rates or any other reason. ICICI Securities and affiliates accept no liabilities for any loss or damage of any kind arising out of the use of this report. Past performance is not
necessarily a guide to future performance. Investors are advised to see Risk Disclosure Document to understand the risks associated before investing in the securities markets. Actual
results may differ materially from those set forth in projections. Forward-looking statements are not predictions and may be subject to change without notice.
ICICI Securities and its affiliates might have managed or co-managed a public offering for the subject company in the preceding twelve months. ICICI Securities and affiliates might have
received compensation from the companies mentioned in the report during the period preceding twelve months from the date of this report for services in respect of public offerings,
corporate finance, investment banking or other advisory services in a merger or specific transaction. ICICI Securities and affiliates expect to receive compensation from the companies
mentioned in the report within a period of three months following the date of publication of the research report for services in respect of public offerings, corporate finance, investment
banking or other advisory services in a merger or specific transaction. It is confirmed that Jitesh Bhanot ACA Rachita Anand BE, MBA (Finance) research analysts and the authors of this
report have not received any compensation from the companies mentioned in the report in the preceding twelve months. Our research professionals are paid in part based on the
profitability of ICICI Securities, which include earnings from Investment Banking and other business.
ICICI Securities or its subsidiaries collectively do not own 1% or more of the equity securities of the Company mentioned in the report as of the last day of the month preceding the
publication of the research report.
It is confirmed that Jitesh Bhanot ACA Rachita Anand BE, MBA (Finance) research analysts and the authors of this report or any of their family members does not serve as an officer,
director or advisory board member of the companies mentioned in the report.
ICICI Securities may have issued other reports that are inconsistent with and reach different conclusion from the information presented in this report. ICICI Securities and affiliates may act
upon or make use of information contained in the report prior to the publication thereof.
This report is not directed or intended for distribution to, or use by, any person or entity who is a citizen or resident of or located in any locality, state, country or other jurisdiction, where
such distribution, publication, availability or use would be contrary to law, regulation or which would subject ICICI Securities and affiliates to any registration or licensing requirement within
such jurisdiction. The securities described herein may or may not be eligible for sale in all jurisdictions or to certain category of investors. Persons in whose possession this document may
come are required to inform themselves of and to observe such restriction.
This report has not been prepared by ICICI Securities, Inc. However, ICICI Securities, Inc. has reviewed the report and, in so far as it includes current or historical information, it is believed to
be reliable, although its accuracy and completeness cannot be guaranteed.