Jubilant Life Sciences: Buy for an upside potential of 56.6%
•
1 like•646 views

Prabhudas Lilladher recommend Jubilant Life Sciences on upside potential of 56.6% #BrokerAdvice http://goo.gl/gUGxSV

Recommended
More Related Content
What's hot
What's hot (18)
Viewers also liked
Similar to Jubilant Life Sciences: Buy for an upside potential of 56.6%
Similar to Jubilant Life Sciences: Buy for an upside potential of 56.6% (20)
More from IndiaNotes.com
More from IndiaNotes.com (20)
Recently uploaded
Recently uploaded (20)
Jubilant Life Sciences: Buy for an upside potential of 56.6%
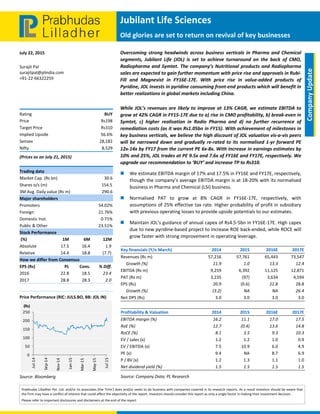
- 1. Jubilant Life Sciences Old glories are set to return on revival of key businesses July 22, 2015 Prabhudas Lilladher Pvt. Ltd. and/or its associates (the 'Firm') does and/or seeks to do business with companies covered in its research reports. As a result investors should be aware that the Firm may have a conflict of interest that could affect the objectivity of the report. Investors should consider this report as only a single factor in making their investment decision. Please refer to important disclosures and disclaimers at the end of the report Company Update Surajit Pal surajitpal@plindia.com +91‐22‐66322259 Rating BUY Price Rs198 Target Price Rs310 Implied Upside 56.6% Sensex 28,182 Nifty 8,529 (Prices as on July 21, 2015) Trading data Market Cap. (Rs bn) 30.6 Shares o/s (m) 154.5 3M Avg. Daily value (Rs m) 290.6 Major shareholders Promoters 54.02% Foreign 21.76% Domestic Inst. 0.71% Public & Other 23.51% Stock Performance (%) 1M 6M 12M Absolute 17.5 16.4 1.9 Relative 14.4 18.8 (7.7) How we differ from Consensus EPS (Rs) PL Cons. % Diff. 2016 22.8 18.5 23.4 2017 28.8 28.3 2.0 Price Performance (RIC: JULS.BO, BB: JOL IN) Source: Bloomberg 0 50 100 150 200 250 Jul‐14 Sep‐14 Nov‐14 Jan‐15 Mar‐15 May‐15 Jul‐15 (Rs) Overcoming strong headwinds across business verticals in Pharma and Chemical segments, Jubilant Life (JOL) is set to achieve turnaround on the back of CMO, Radiopharma and Symtet. The company’s Nutritional products and Radiopharma sales are expected to gain further momentum with price rise and approvals in Rubi‐ Fill and Magnevist in FY16E‐17E. With price rise in value‐added products of Pyridine, JOL invests in pyridine consuming front‐end products which will benefit in better realizations in global markets including China. While JOL’s revenues are likely to improve at 13% CAGR, we estimate EBITDA to grow at 42% CAGR in FY15‐17E due to a) rise in CMO profitability, b) break‐even in Symtet, c) higher realisation in Radio Pharma and d) no further recurrence of remediation costs (as it was Rs1.05bn in FY15). With achievement of milestones in key business verticals, we believe the high discount of JOL valuation vis‐a‐vis peers will be narrowed down and gradually re‐rated to its normalised 1‐yr forward PE 12x‐14x by FY17 from the current PE 6x‐8x. With increase in earnings estimates by 10% and 25%, JOL trades at PE 9.5x and 7.6x of FY16E and FY17E, respectively. We upgrade our recommendation to ‘BUY’ and increase TP to Rs310. We estimate EBITDA margin of 17% and 17.5% in FY16E and FY17E, respectively, though the company’s average EBITDA margin is at 18‐20% with its normalised business in Pharma and Chemical (LSI) business. Normalised PAT to grow at 8% CAGR in FY16E‐17E, respectively, with assumptions of 25% effective tax rate. Higher probability of profit in subsidiary with previous operating losses to provide upside potentials to our estimates. Maintain JOL’s guidance of annual capex of Rs4.5‐5bn in FY16E‐17E. High capex due to new pyridine‐based project to increase ROE back‐ended, while ROCE will grow faster with strong improvement in operating leverage. Key financials (Y/e March) 2014 2015 2016E 2017E Revenues (Rs m) 57,216 57,761 65,443 73,547 Growth (%) 11.9 1.0 13.3 12.4 EBITDA (Rs m) 9,259 6,392 11,125 12,871 PAT (Rs m) 3,235 (97) 3,634 4,594 EPS (Rs) 20.9 (0.6) 22.8 28.8 Growth (%) (3.2) NA NA 26.4 Net DPS (Rs) 3.0 3.0 3.0 3.0 Profitability & Valuation 2014 2015 2016E 2017E EBITDA margin (%) 16.2 11.1 17.0 17.5 RoE (%) 12.7 (0.4) 13.6 14.8 RoCE (%) 8.1 3.5 9.3 10.3 EV / sales (x) 1.2 1.2 1.0 0.9 EV / EBITDA (x) 7.5 10.9 6.0 4.9 PE (x) 9.4 NA 8.7 6.9 P / BV (x) 1.2 1.3 1.1 1.0 Net dividend yield (%) 1.5 1.5 1.5 1.5 Source: Company Data; PL Research
- 2. July 22, 2015 2 Jubilant Life Sciences Problems of business verticals behind JOL With completion of majority of correction measures and addressing concerns, JOL is expected to improve revenues in business verticals which have been the key reasons for its worst sales growth and operating margin in FY15. The company’s sales grew by 1%, while EBITDA decreased by 31%, which implied adj. EBITDA margin of 11.1% in FY15. JOL’s severe beating in financial performance (since FY05) was led by multiple headwinds: a) CMO business was impacted due to cGMP non‐compliance and plant shutdown, Rs1.18bn. b) Lower utilisation of Symtet production capacity due to stability issues in the plant, Rs350mn. c) Slump in global prices of Pyridine to US$3.5, which has been lowest in the price range US$3.5‐5/kg of Pyridine that prevailed over the past five years, Rs1.4bn. Hence, the overall EBITDA impact for the company was Rs9.3bn in FY15. Exhibit 1: Jubilant’s Revenue, growth, EBITDA margin FY10 FY11 FY12 FY13 FY14 FY15 Gross sales 33,859 34,464 42,780 51,660 58,030 58,263 Rev, gr (%) 13.9 1.8 24.1 20.8 12.3 0.4 Adj. EBITDA margin (%) 21.3 16.3 20.5 20.4 17.4 11.8 Source: Company Data, PL Research
- 3. July 22, 2015 3 Jubilant Life Sciences Exhibit 2: Jubilant Business structures Source: Company Data, PL Research Analysing JOL’s measures to address key concerns Contract manufacturing (CMO) business faces tough time in FY15 JOL received warning letters from USFDA for its two plants in Quebec (Canada) and Spokane (USA) in Feb 2013 and Nov 2013, respectively. This has led to comprehensive remediation measures, especially in Spokane, which was shutdown for 3‐4 months. The plants also took longer‐than‐expected time to stabilise post remediation and impacted productivity in CMO business. Lower productivity significantly reduced sales (by 38% in US$) to Rs4.4bn (US$72m) and profitability in FY15. Jubilant Life Sciences Pharmaceuticals (47%) Generics (24%) Active Pharmaceutical Ingredients (9%) Solid Dosage Formulations (15%) Specialty Pharmaceuticals (19%) Radiopharmaceuticals (4%) Allergy Therapy Products (3%) CMO of Sterile Injectables (12%) Drug Discovery Solutions (3%) Indian Branded Pharmaceuticals (1%) Life Science Ingredients (53%) Advanced Intermediates and Specialty Ingredients (23%) NutritionalProducts (7%) Life ScienceChemicals (23%)
- 4. July 22, 2015 4 Jubilant Life Sciences Exhibit 3: CMO set to overcome plant related issues in FY16 35 (20) 17 14 (2) (36) (40) (30) (20) (10) ‐ 10 20 30 40 ‐ 1,000 2,000 3,000 4,000 5,000 6,000 7,000 8,000 FY10 FY11 FY12 FY13 FY14 FY15 Revenues (Rs m) Growth (%) (RHS) Source: Company Data, PL Research Current regulatory status of the CMO plants With proactive initiative in achieving remediation milestone, JOL successfully achieved resolution for Quebec plant and improved regulatory status of Spokane plant within 16‐18 months of receipt of the warning letter from USFDA. The regulator issued resolution (close out) letter for Quebec plant in Sep 2014 and upgraded Spokane plant to VAI (Voluntary action indicated) from OAI (Official action indicated) which paves the way for final resolution in the near term. Current production to ramp‐up faster with better profitability While warning letter intends to put no restriction on production and supply, JOL has resorted to precautionary remediation measures which led to reduced productivity in CMO in FY15. With resolutions in the two plants, JOL’s CMO has been returning back into normalised production process in CMO which is noticed in Pharma sales growth of 8% to Rs7.6bn in Q4FY15. Spokane facility has also set up a second production line which will benefit higher revenues in FY16E‐17E. Jubilant’s current backlog of orders and improving plant stability will help in faster ramp‐up utilisation rate of CMO business.
- 5. July 22, 2015 5 Jubilant Life Sciences Exhibit 4: Sensitivity in Pharma business is largely influenced by CMO 25.8 10.8 26.7 27.8 22.4 16.6 35 (20) 17 14 (2) (36) ‐40.0 ‐30.0 ‐20.0 ‐10.0 0.0 10.0 20.0 30.0 40.0 FY10 FY11 FY12 FY13 FY14 FY15 Pharma EBITDA margin (%) CMO Rev growth (%) Source: Company Data, PL Research With normalised sales of Rs7bn in CMO, JOL lost sales of Rs2.4bn and lost operating profit of Rs1.18bn, which also included one‐off remediation costs in FY15. With gradual rise in utilization and stability, we expect CMO revenues to grow by 35% and 50% in FY16E and FY17E, respectively. Symtet plant stability issue to be resolved with operating break‐even in FY16E Encouraged by the strong success of the pilot project, JOL commissioned two manufacturing lines (24,000 MT) for commercial productions of Symtet in FY13. The company has a contractual supply agreement with Dow Chemical as Symtet constitutes key ingredient for agro‐chemical products of the company. The Symtet plant, however, has been struggling to achieve stability since commissioning for commercial productions. We believe that improvement in Symtet capacity utilization is the key for better financial performance of LSI business and higher captive use of pyridine when global realisation from unit sales of Pyridine is at the lowest range in the last five years. JOL has been able to utilize 15% capacity and incur annual operating loss of Rs350‐ 400m. JOL identified usage of acetyls in production of Symtet causing corrosion which lead to lack of stability in higher utilization of plant. Management expects current remediation measures to address the root cause of stability issues and increase utilisations in FY16E‐17E. With sensitivity of Rs20m operating profit/loss for 1% rise/fall in utilization, we expect JOL to achieve operating break‐even in 30% capacity utilization in FY16E. Management expects to achieve 50% utilization in FY17E with higher profitability.
- 6. July 22, 2015 6 Jubilant Life Sciences Pyridine: Impacted by multiple factors led by China JOL’s Pyridine business was impacted due to three main reasons a) China imposed anti‐dumping duty of 24.6% on JOL’s export, b) China govt’s ban on liquid Paraquat and c) Global slump in Pyridine price. These multiple factors impacted JOL’s PPES revenues by 14% (in US$) YoY and decreased profitability of LSI business by 550bps in FY15. Exhibit 5: China sales is strongly contributed by Pyridine prices and exports 4% 1% ‐2% 20% 18% ‐11% ‐15% ‐10% ‐5% 0% 5% 10% 15% 20% 25% ‐ 2,000 4,000 6,000 8,000 10,000 12,000 14,000 FY10 FY11 FY12 FY13 FY14 FY15 China sales (Rs m) PPES sales (Rs m) PPES growth (%) (RHS) Source: Company Data, PL Research Despite MOFCOM’s (Chinese regulator) imposition of anti‐dumping duty on low cost import of Pyridine, JOL maintained quantity of supply to China though at a lower profitability. The scenario, however, worsened further, post China govt’s decision to impose ban on the production of liquid Paraquat due to its toxicity and instructed agro‐chemical industry for use of alternatives. Pyridine being one of the key ingredients of Paraquat, the ban strongly misbalances demand‐supply economy of Pyridine in China. With more‐than‐required supply in China, the global price of Pyridine came down to its lowest average price in five years as China is the largest consumer and leading determinant of global price. Exhibit 6: JOL's offer of pyridine portfolio and industry usage Industry application Pyridine portfolio Agro‐chemcials Pyridine Pharmceuticals Alpha picoline Anti‐dandruff shampoos Beta picoline Photographic Chemcials Gamma picoline Dyestaffs & Textiles 2‐Cyanopyridine Rubber chemicals 3‐Cyanopyridine Metal finishes 4‐Cyanopyridine Marine paints Piperidine Electronics Source: Company Data, PL Research
- 7. July 22, 2015 7 Jubilant Life Sciences Pyridine issues: Multiple strategies to reduce dependence on China exports With 30% reduction in revenues from China, JOL’s management identified multiple strategies to control Chinese exports of Pyridine, which determine global pyridine price and indirectly impacts JOL’s export in non‐China market. While MOFCOM has accepted JOL’s application (in Nov 2014) to reconsider rationale of anti‐dumping duty, it allowed solid Paraquat for domestic use and liquid Paraquat only for exports. As a result, JOL reshuffles its strategies for Pyridine business without impacting volume of productions, which are: Captive use: Driving for more captive use of pyridines with investments in new ventures for value‐added products which consume pyridines as major raw materials. Management has planned capex of Rs4.5‐5bn each for FY16E and FY17E, with an aim to establish many ventures where pyridines constitute major raw material consumptions. For example, JOL has commissioned Zinc Pyrithione plant for production of value‐added (front‐end) products utilising Pyridines as major raw material in Q4FY15. Similarly, higher demand of JOL’s nutritional products, Niacinamide and better utilisation of Symtet will also address additional captive consumptions of Pyridine, going forward. Exhibit 7: Pyridine consumption by usage Agro‐ chemicals 39% Vitamin B3 38% Latexes 8% Others 15% Source: Company Data, PL Research Exhibit 8: Pyridine consumption by products Pyridine 43% Beta picoline 25% Alpha picoline 12% Gamma picoline 7% Others 13% Source: Company Data, PL Research Controlled supply in China to improve global price: Management plans to supply only required quantity of pyridines for Chinese market without flooding the market and help to improve price scenario in China and global market. Though solid Paraquat is allowed, there are no solid paraquat available globally and farmers in China are using alternative herbicides such as Diquat and Glyphosate. JOL reduces quantum of pyridine exports to China which will meet required quantity for productions of alternative herbicides and liquid Paraquat for exports.
- 8. July 22, 2015 8 Jubilant Life Sciences Exhibit 9: Global major producers of Pyridines Company Capacity (MT) Contribution Vertellus 59,000 33% Jubilant Life 42,000 24% Lonza 25,000 14% Red Sun 12,000 7% Others 40,000 22% Total production 178,000 100% Source: Company Data, PL Research Exploring new geography: JOL being one of the top‐3 producers of pyridines and major supplier to China has decided to expand substantially in other geographies along with controlled export to China. The exploration strategy will address two objectives— a) avoid concentration of pyridine supply in few markets and help in better realisations and b) determinant power of China to be reduced with lower consumption of pyridines. This will also improve realisation from pyridine sales in China. Exhibit 10: Ban on Paraquat impacted China sales and growth post Q1FY15 24 49 15 39 17 (35) (42) (51) (60) (40) (20) ‐ 20 40 60 ‐ 200 400 600 800 1,000 1,200 1,400 1,600 1,800 Q1FY14 Q2FY14 Q3FY14 Q4FY14 Q1FY15 Q2FY15 Q3FY15 Q4FY15 China Sales (Rs m) YoY Gr (%) (RHS) Source: Company Data, PL Research Current growth drivers to improve further Radio Pharma business to ramp‐up further on new approvals With resolution of manufacturing challenges of DTAA and MAA in Radio Pharma, Jubilant achieved 114% YoY revenue growth in Radio Pharma in FY15. With USFDA resolution on cGMP issues of Quebec plant, we expect 20% growth of Radio Pharma sales in FY16E and new approvals of Rubi‐Fill and Magnevist to help further growth of 22% in FY17E onwards.
- 9. July 22, 2015 9 Jubilant Life Sciences Exhibit 11: Radio Pharma: Sales ramps up faster post resolution of manufacturing issues 25 18 28 26 14 121 ‐ 20 40 60 80 100 120 140 ‐ 1,000 2,000 3,000 4,000 5,000 6,000 FY10 FY11 FY12 FY13 FY14 FY15 Radio Pharma sales (Rs m) YoY Gr (%) (RHS) Source: Company Data, PL Research With TAD (Target action day) from USFDA, we believe JOL could launch Rubi‐Fill (Rubidium Chloride RB‐82) generic in Q4FY16E or Q1FY17E while approval for Magnevist (Gadopentetate Dimeglumine) is expected in H2FY17E. JOL applied generic Rubi‐Fill through 505(b)(2) route for NDA application, which will lead to faster approval for non‐AB rated generic. With weak visibility of generic application from competitors for Rubi‐Fill, we expect JOL’s established channel partners (for current product Sestamibi) and sales team to gain major benefits from originator’s US$70m Rubi‐Fill market in US. As non‐AB rated drugs are not replaceable with patented drug by pharmacists, JOL plans to market its generic with brand and dedicated sales team as soon as the approval to be given in US. Exhibit 12: Competitors in sestamibi (JOL’s current prod) market in the US Companies Approvals Briefs Mallinckrodt Sep‐08 Marketing and distribution partnership with Covidien for US market Jubilant Life Sciences Apr‐09 Marketing and distribution partnership with GE for US market Cardinal Health Apr‐09 Own distribution network for radiopharmaceutical prodcuts Pharmalucense Jul‐09 Delayed launches in August 2009 Source: Company Data, PL Research Exhibit 13: JOL's product pipeline in Radiopharma in US Products Product detail Cardiolite (generic) sestamibi kit (Launched) Myocardial perfusion kit Ruby‐fill technetium generator Cardiac imaging Magnevist (generic) MRI contrast imaging Moly‐fill technetium generator Nuclear medical application Source: Company Data, PL Research
- 10. July 22, 2015 10 Jubilant Life Sciences US generics set to grow with better approval rate in US FDA While Methylprednisolone, Terazosin and Lamotrigine remain three major sales drivers, JOL expects better revenue growth in FY16E‐17E with improvement in rate of approvals by USFDA. The company also receives approval on day‐one generic competition (such as Diovan) post exclusivity in US. The company however faced challenging scenario in its key generics in US, which led to insipid sale growth in Dosage formulations in FY14 and FY15. Increasing competition in JOL’s dominant market share in limited competition drugs such as Methylprednisolone and Terazosin in US were the reasons for declining sales in Dosage formulations. With new approvals in day‐one generics and stable market share in limited competition portfolio, we expect 6% and 8% revenue growth in global formulations in FY16E and FY17E. JOL expects Mycophenolate Mofetil and Rizatriptan launch in Q1FY16E and Q2FY16E to be the key drivers in US generics in medium term. Exhibit 14: Dosage formulations to grow on new approvals in US 34 36 161 55 5 (3) (20) ‐ 20 40 60 80 100 120 140 160 180 ‐ 2,000 4,000 6,000 8,000 10,000 FY10 FY11 FY12 FY13 FY14 FY15 Generic Rev (Rs m) YoY Gr (%) (RHS) Source: Company Data, PL Research Exhibit 15: Methylprednisolone (including all strengths): Entry of new generics led to stable Rx share (10) ‐ 10 20 30 40 50 60 Jul‐11 Sep‐11 Nov‐11 Jan‐12 Mar‐12 May‐12 Jul‐12 Sep‐12 Nov‐12 Jan‐13 Mar‐13 May‐13 Jul‐13 Sep‐13 Nov‐13 Jan‐14 Mar‐14 May‐14 Jul‐14 Sep‐14 Nov‐14 Jan‐15 Mar‐15 May‐15 Jubilant Endo Sandoz Pfizer Source: Wolters Kluwer, PL Research
- 11. July 22, 2015 11 Jubilant Life Sciences Exhibit 16: Methylprednisolone 4mg remains competitive as ever (10) ‐ 10 20 30 40 50 60 Jul‐11 Oct‐11 Jan‐12 Apr‐12 Jul‐12 Oct‐12 Jan‐13 Apr‐13 Jul‐13 Oct‐13 Jan‐14 Apr‐14 Jul‐14 Oct‐14 Jan‐15 Apr‐15 Jubilant Endo Sandoz Pfizer Source: Wolters Kluwer, PL Research Exhibit 17: Importance of Methylprednisolone 8mg is reduced for JOL with limited Rx (20) ‐ 20 40 60 80 100 120 Jul‐11 Oct‐11 Jan‐12 Apr‐12 Jul‐12 Oct‐12 Jan‐13 Apr‐13 Jul‐13 Oct‐13 Jan‐14 Apr‐14 Jul‐14 Oct‐14 Jan‐15 Apr‐15 Pfizer Jubilant Source: Wolters Kluwer, PL Research Exhibit 18: Re‐entry of competitor normalises growth in Methylprednisolone 16mg (20) ‐ 20 40 60 80 100 120 Jul‐11 Oct‐11 Jan‐12 Apr‐12 Jul‐12 Oct‐12 Jan‐13 Apr‐13 Jul‐13 Oct‐13 Jan‐14 Apr‐14 Jul‐14 Oct‐14 Jan‐15 Apr‐15 Jubilant Pfizer Source: Wolters Kluwer, PL Research
- 12. July 22, 2015 12 Jubilant Life Sciences Exhibit 19: JOL stabilises its Rx share in Methylprednisolone 32mg since Q1FY14 (20) ‐ 20 40 60 80 100 120 Jul‐11 Oct‐11 Jan‐12 Apr‐12 Jul‐12 Oct‐12 Jan‐13 Apr‐13 Jul‐13 Oct‐13 Jan‐14 Apr‐14 Jul‐14 Oct‐14 Jan‐15 Apr‐15 Pfizer Jubilant Source: Wolters Kluwer, PL Research APIs—Maintain track record With filing of two additional APIs in Q4FY15, JOL has commercialised 39 APIs in global markets including 21 in US/North America, 24 in EU and 26 in ROW markets. Overall, the company has commercialised five products in the past three years and expect similar success in API commercialisations in key regulated markets. JOL has 77 DMFs filed in the US, of which, 47 are pending approvals including high value opportunities such as Aripiprazole (Abilify) and Esomeprazole (Nexium). The company expects revenues from supply of Abilify APIs in medium term, while supply of Nexium API is likely to be the growth driver post September 2015 when new generics are expected post exclusivity of Teva. Exhibit 20: Key opportunities in Abilify, Nexium to drive growth in FY16‐17E 11 19 33 13 4 2 ‐ 5 10 15 20 25 30 35 ‐ 1,000 2,000 3,000 4,000 5,000 6,000 FY10 FY11 FY12 FY13 FY14 FY15 APIs Rev (Rs m) YoY Gr (%) (RHS) Source: Company Data, PL Research
- 13. July 22, 2015 13 Jubilant Life Sciences JOL’s volume leadership in CVS and CNS drugs are conventional growth drivers of the company’s API business. In CNS drugs, JOL is the largest producer of Carbamazepine, Oxcarbazepine, Citalopram and Lamotrigine, while it remains in the top three producers for Risperidone, Donepezil and Olanzapine. In CVS drugs, JOL established niche in Sartan drugs such as Valsartan, Losartan, Candesartan and Irbesartan. Exhibit 21: JOL's leading API growth drivers other than Sartans Brands Originators Patent Expiry Molecules Market Size (USD mn) Therapeutic areas Aricept Eisai May‐11 Donepezil Hcl 1500 CNS Zyprexa Eli Lilly Oct‐11 Olanzapaine form‐I 2800 CNS Lexapro Forest Labs Mar‐12 Escitalopram Oxalate 2700 CNS Geodon Pfizer Mar‐12 Ziprasidone Hcl usp 1300 CNS Invega Johnson & Johnson Apr‐12 Paliperidone 357 CNS Seroquel Astrazeneca Apr‐12 Quetiapine Fumarate 3750 CNS Lipitor Pfizer May‐12 Atorvastatin Calcium (Amorphous) 8120 CVS Plavix Sanofi May‐12 Clopidogrel Bi‐sulfate usp 7000 CVS Zometa Novartis Sep‐12 Zoledronic Acid 775 CVS Aciphex Eisai Jun‐13 Rabeprazole Sodium 1230 GI Nexium Astrazeneca May‐14 Esomeprazole Magnesium 6300 GI Actonel Warner Chilcott Jun‐14 Risedronate Sodium 1100 Osteoporosis Abilify Otsuka Apr‐15 Aripiprazole 1733 CNS Vesicare Astellas Dec‐15 Solifenacin Succinate 1000 Antimuscarinic Source: Company Data, PL Research Domestic formulations—Foraying into new venture JOL has forayed into domestic formulations with more than 200 reps in FY15 post sale of its healthcare business. With revenues of Rs70m in FY15 and estimated 20% CAGR in FY15‐17E, we believe domestic formulations requires 24‐36 months to achieve sizeable contribution to JOL’s financial performance. Exhibit 22: JOL’s Revenue Break‐up Y/e March FY13 FY14 FY15 FY16E FY17E Pharmaceuticals Business (Pharma) 26,620 27,274 26,820 31,040 36,970 API (CRAMS) 5,080 5,280 5,410 5,936 6,530 Generics 12,170 13,000 15,630 17,561 19,742 Radio Pharmaceuticals (Specialty pharma) 2,090 2,380 5,250 6,401 7,809 Allergenic Extracts (Specialty Pharma) 1,770 1,860 1,870 1,995 2,035 Dosage forms 8,310 8,760 8,510 9,165 9,898 CMO of sterile/ non‐Sterile Products (CRAMS) 7,100 6,960 4,480 6,145 9,217 Drug Discovery services (DDDS) 2,080 1,840 1,230 1,312 1,378 Healthcare 190 194 70 86 103 Life Science Ingredients (LSI) 25,040 30,760 31,442 34,403 36,577 PPES 11,210 13,280 11,790 12,697 13,332 Nutritional Ingredients 2,650 3,960 4,860 5,925 6,518 Life science Chemicals (Acetates, Acetyl) 11,180 13,520 14,792 15,780 16,727 Net Sales 51,660 58,034 58,263 65,443 73,547 YoY gr 20.8% 12.3% 0.4% 12.3% 12.4% Source: Company Data, PL Research
- 14. July 22, 2015 14 Jubilant Life Sciences Better profitability to improve EBITDA growth and margin With better utilisation of CMO plants and Symtet facility, there is an opportunity for JOL to recover Rs1.6bn EBITDA in FY16E, including non‐recurrence of one‐off costs of Rs1,050m. Our estimates of 17% and 17.5% EBITDA margin in FY16E and FY17E, respectively, includes recovery of profitability in CMO, break‐even in Symtet, 6% upside in global pyridine price and 10% upside in Niacinamide price. We estimate 19% and 16% YoY growth in normalised EBITDA for FY16E and FY17E, respectively. Exhibit 23: EBITDA shows initial turnaround since Q4FY15 14.9 18.2 16.4 15.7 9.1 7.5 11.9 16.1 (13.4) (1.6) (5.8) 5.9 (38.8) (59.0) (25.8) 0.7 (70.0) (60.0) (50.0) (40.0) (30.0) (20.0) (10.0) ‐ 10.0 20.0 30.0 ‐ 500 1,000 1,500 2,000 2,500 3,000 Q1FY14 Q2FY14 Q3FY14 Q4FY14 Q1FY15 Q2FY15 Q3FY15 Q4FY15 EBITDA (Rs m) Margin (%) (RHS) YoY gr (%) (RHS) Source: Company Data, PL Research Gradual reductions of debt with better FCFs Currently, JOL has adjusted gross debt of Rs42.8bn, contributed by INR loan of Rs15.1bn and forex loan of Rs27.7bn (US$443m). The company has converted US$186m forex loan into INR loan which was swapped in to USD loan in FY13. As a result, forex loan contributes 60% of current debt portfolio and consequently its blended interest rate becomes 7.2% in FY16E and FY17E. With average FCF of Rs6.3bn, we expect overall gross debt to be US$619m in FY17E from US$673m in FY15 and Debt‐Equity ratio to be 1.2x in FY17E from 1.7x in FY15. Return ratios to improve gradually While capex plan (Rs3.55bn) was trimmed to match lower cash flow in strong business headwinds in FY15, management plans to expand annual capex plan to Rs4.5‐5bn each in FY16E and FY17E with better cash flow from turnaround business. We believe that higher capex plan is required to take benefit of price rise in Nutritional business and foray into high‐end ingredient business for higher captive use of pyridines. As a result, JOL’s normalised ROE and ROCE to improve to its average return of 15% and 10% respectively by FY17E.
- 15. July 22, 2015 15 Jubilant Life Sciences Exhibit 24: ROE and ROCE to improve at a different pace with reducing debt profile 15 12 17 15 13 0 12 13 12 9 14 16 16 10 16 18 ‐ 5 10 15 20 ‐ 10,000 20,000 30,000 40,000 50,000 FY10 FY11 FY12 FY13 FY14 FY15 FY16E FY17E Gross Debt (Rs m) ROE (%) (RHS) ROCE (%) (RHS) Source: Company Data, PL Research Valuations With JOL’s average PER within +/‐1sigma and PE 9.5x and 7.6x of FY16E and FY17E, we believe that the company’s turnaround is not yet reflected in its valuation. JOL’s prolonged setback in multiple business verticals has reduced normalized 1‐yr forward PEx to 6x‐8x since FY11. While the current valuation continues to discount downside potentials, we expect JOL’s PEx to be re‐rated to the company’s normalised PEx of 12x‐14x over FY16E‐17E, once key businesses turn around with better profitability. With average of FCFF and PEx, we have reached our TP of the company at Rs310 and hence, upgrade recommendation to ‘BUY’. Our TP at Rs310 implies 11.1x PE of FY17E. Exhibit 25: JOL’s Sales, EPS—PL vs. Consensus Sales Diff (%) EPS Diff (%) PL Consensus PL Consensus FY16E 65,443 65,586 (0.2) 22.3 18.5 20.4 FY17E 73,547 74,357 (1.1) 27.9 28.3 (1.5) Source: Company Data, Bloomberg, PL Research
- 16. July 22, 2015 16 Jubilant Life Sciences Exhibit 26: JOL remains highly undervalued, not yet reflecting changing fundamental for better performance ‐30.0 ‐20.0 ‐10.0 0.0 10.0 20.0 30.0 40.0 50.0 Mar‐05 Apr‐05 May‐05 Jun‐05 Jul‐05 Aug‐05 Sep‐05 Oct‐05 Nov‐05 Dec‐05 Jan‐06 Feb‐06 Mar‐06 Apr‐06 May‐06 Jun‐06 Jul‐06 Aug‐06 Sep‐06 Oct‐06 Nov‐06 Dec‐06 Jan‐07 Feb‐07 Mar‐07 Apr‐07 May‐07 Jun‐07 Jul‐07 Aug‐07 Sep‐07 Oct‐07 Nov‐07 Dec‐07 Jan‐08 Feb‐08 Mar‐08 P/E (x) Average (µ) (µ+σ) (µ‐σ) Source: Company Data, Bloomberg, PL Research Exhibit 27: One Year Forward Price / Earnings 8.0x 11.0x 14.0x 17.0x 20.0x ‐100 0 100 200 300 400 500 600 Mar‐05 Sep‐05 Mar‐06 Aug‐06 Feb‐07 Jul‐07 Jan‐08 Jul‐08 Dec‐08 Jun‐09 Nov‐09 May‐10 Oct‐10 Apr‐11 Oct‐11 Mar‐12 Sep‐12 Feb‐13 Aug‐13 Feb‐14 Jul‐14 Jan‐15 Jun‐15 Source: Company Data, Bloomberg, PL Research
- 17. July 22, 2015 17 Jubilant Life Sciences Income Statement (Rs m) Y/e March 2014 2015 2016E 2017E Net Revenue 57,216 57,761 65,443 73,547 Raw Material Expenses 24,421 26,617 27,420 30,669 Gross Profit 32,796 31,144 38,022 42,878 Employee Cost 11,052 10,903 12,041 13,238 Other Expenses 12,485 13,850 14,855 16,769 EBITDA 9,259 6,392 11,125 12,871 Depr. & Amortization 2,812 2,880 3,304 4,015 Net Interest 3,237 3,553 3,910 3,674 Other Income 1,008 926 935 944 Profit before Tax 4,218 884 4,846 6,125 Total Tax 696 805 1,211 1,531 Profit after Tax 3,521 79 3,634 4,594 Ex‐Od items / Min. Int. (4,004) (786) — — Adj. PAT 3,235 (97) 3,634 4,594 Avg. Shares O/S (m) 154.5 159.3 159.3 159.3 EPS (Rs.) 20.9 (0.6) 22.8 28.8 Cash Flow Abstract (Rs m) Y/e March 2014 2015 2016E 2017E C/F from Operations 8,026 3,585 10,087 11,424 C/F from Investing (1,744) (3,473) (4,966) (4,966) C/F from Financing (4,447) (5,997) (5,076) (6,422) Inc. / Dec. in Cash 1,834 (5,884) 45 36 Opening Cash 2,786 4,735 3,943 3,988 Closing Cash 4,735 (1,149) 3,988 4,024 FCFF 1,115 (2,823) 1,867 3,397 FCFE 2,616 (4,691) (1,182) 149 Key Financial Metrics Y/e March 2014 2015 2016E 2017E Growth Revenue (%) 11.9 1.0 13.3 12.4 EBITDA (%) (7.7) (31.0) 74.1 15.7 PAT (%) (6.2) NA NA 26.4 EPS (%) (3.2) NA NA 26.4 Profitability EBITDA Margin (%) 16.2 11.1 17.0 17.5 PAT Margin (%) 5.7 (0.2) 5.6 6.2 RoCE (%) 8.1 3.5 9.3 10.3 RoE (%) 12.7 (0.4) 13.6 14.8 Balance Sheet Net Debt : Equity 1.5 1.6 1.2 1.0 Net Wrkng Cap. (days) 145 125 123 112 Valuation PER (x) 9.4 NA 8.7 6.9 P / B (x) 1.2 1.3 1.1 1.0 EV / EBITDA (x) 7.5 10.9 6.0 4.9 EV / Sales (x) 1.2 1.2 1.0 0.9 Earnings Quality Eff. Tax Rate 16.5 91.0 25.0 25.0 Other Inc / PBT 23.9 104.7 19.3 15.4 Eff. Depr. Rate (%) 3.8 4.6 4.9 5.5 FCFE / PAT 80.9 NA (32.5) 3.2 Source: Company Data, PL Research. Balance Sheet Abstract (Rs m) Y/e March 2014 2015 2016E 2017E Shareholder's Funds 26,265 24,535 29,097 33,115 Total Debt 43,953 42,085 39,036 35,789 Other Liabilities 6,260 3,449 3,796 4,198 Total Liabilities 76,478 70,068 71,929 73,102 Net Fixed Assets 55,712 55,079 56,775 57,760 Goodwill — — — — Investments 340 395 407 419 Net Current Assets 17,153 11,026 11,142 11,391 Cash & Equivalents 4,795 3,943 3,988 4,024 Other Current Assets 24,485 23,336 24,048 25,209 Current Liabilities 12,128 16,254 16,893 17,842 Other Assets 3,274 3,569 3,604 3,532 Total Assets 76,478 70,068 71,929 73,102 Quarterly Financials (Rs m) Y/e March Q2FY15 Q3FY15 Q4FY15 Q1FY16E Net Revenue 13,711 14,455 15,365 15,886 EBITDA 1,110 1,853 2,474 2,986 % of revenue 8.1 12.8 16.1 18.8 Depr. & Amortization 692 795 662 682 Net Interest 743 858 792 794 Other Income 47 (42) (4) (3) Profit before Tax (278) 158 1,017 1,508 Total Tax 645 202 251 377 Profit after Tax (941) (112) 427 769 Adj. PAT (941) (112) 427 769 Key Operating Metrics (Rs m) Y/e March 2014 2015 2016E 2017E Pharmaceuticals 27,274 26,820 31,040 36,970 LSI 30,760 31,442 34,403 36,577 Source: Company Data, PL Research.
- 18. July 22, 2015 18 Jubilant Life Sciences Prabhudas Lilladher Pvt. Ltd. 3rd Floor, Sadhana House, 570, P. B. Marg, Worli, Mumbai‐400 018, India Tel: (91 22) 6632 2222 Fax: (91 22) 6632 2209 Rating Distribution of Research Coverage PL’s Recommendation Nomenclature 42.9% 39.8% 17.3% 0.0% 0% 10% 20% 30% 40% 50% BUY Accumulate Reduce Sell % of Total Coverage BUY : Over 15% Outperformance to Sensex over 12‐months Accumulate : Outperformance to Sensex over 12‐months Reduce : Underperformance to Sensex over 12‐months Sell : Over 15% underperformance to Sensex over 12‐months Trading Buy : Over 10% absolute upside in 1‐month Trading Sell : Over 10% absolute decline in 1‐month Not Rated (NR) : No specific call on the stock Under Review (UR) : Rating likely to change shortly DISCLAIMER/DISCLOSURES ANALYST CERTIFICATION We/I, Mr. Surajit Pal (PGDBA, CFA, M.Com), Research Analysts, authors and the names subscribed to this report, hereby certify that all of the views expressed in this research report accurately reflect our views about the subject issuer(s) or securities. We also certify that no part of our compensation was, is, or will be directly or indirectly related to the specific recommendation(s) or view(s) in this report. Terms & conditions and other disclosures: Prabhudas Lilladher Pvt. Ltd, Mumbai, India (hereinafter referred to as “PL”) is engaged in the business of Stock Broking, Portfolio Manager, Depository Participant and distribution for third party financial products. PL is a subsidiary of Prabhudas Lilladher Advisory Services Pvt Ltd. which has its various subsidiaries engaged in business of commodity broking, investment banking, financial services (margin funding) and distribution of third party financial/other products, details in respect of which are available at www.plindia.com This document has been prepared by the Research Division of PL and is meant for use by the recipient only as information and is not for circulation. This document is not to be reported or copied or made available to others without prior permission of PL. It should not be considered or taken as an offer to sell or a solicitation to buy or sell any security. The information contained in this report has been obtained from sources that are considered to be reliable. However, PL has not independently verified the accuracy or completeness of the same. Neither PL nor any of its affiliates, its directors or its employees accepts any responsibility of whatsoever nature for the information, statements and opinion given, made available or expressed herein or for any omission therein. Recipients of this report should be aware that past performance is not necessarily a guide to future performance and value of investments can go down as well. The suitability or otherwise of any investments will depend upon the recipient's particular circumstances and, in case of doubt, advice should be sought from an independent expert/advisor. Either PL or its affiliates or its directors or its employees or its representatives or its clients or their relatives may have position(s), make market, act as principal or engage in transactions of securities of companies referred to in this report and they may have used the research material prior to publication. PL may from time to time solicit or perform investment banking or other services for any company mentioned in this document. PL is in the process of applying for certificate of registration as Research Analyst under Securities and Exchange Board of India (Research Analysts) Regulations, 2014 PL submits that no material disciplinary action has been taken on us by any Regulatory Authority impacting Equity Research Analysis activities. PL or its research analysts or its associates or his relatives do not have any financial interest in the subject company. PL or its research analysts or its associates or his relatives do not have actual/beneficial ownership of one per cent or more securities of the subject company at the end of the month immediately preceding the date of publication of the research report. PL or its research analysts or its associates or his relatives do not have any material conflict of interest at the time of publication of the research report. PL or its associates might have received compensation from the subject company in the past twelve months. PL or its associates might have managed or co‐managed public offering of securities for the subject company in the past twelve months or mandated by the subject company for any other assignment in the past twelve months. PL or its associates might have received any compensation for investment banking or merchant banking or brokerage services from the subject company in the past twelve months. PL or its associates might have received any compensation for products or services other than investment banking or merchant banking or brokerage services from the subject company in the past twelve months PL or its associates might have received any compensation or other benefits from the subject company or third party in connection with the research report. PL encourages independence in research report preparation and strives to minimize conflict in preparation of research report. PL or its analysts did not receive any compensation or other benefits from the subject Company or third party in connection with the preparation of the research report. PL or its Research Analysts do not have any material conflict of interest at the time of publication of this report. It is confirmed that Mr. Surajit Pal (PGDBA, CFA, M.Com), Research Analysts of this report have not received any compensation from the companies mentioned in the report in the preceding twelve months Compensation of our Research Analysts is not based on any specific merchant banking, investment banking or brokerage service transactions. The Research analysts for this report certifies that all of the views expressed in this report accurately reflect his or her personal views about the subject company or companies and its or their securities, and no part of his or her compensation was, is or will be, directly or indirectly related to specific recommendations or views expressed in this report. The research analysts for this report has not served as an officer, director or employee of the subject company PL or its research analysts have not engaged in market making activity for the subject company Our sales people, traders, and other professionals or affiliates may provide oral or written market commentary or trading strategies to our clients that reflect opinions that are contrary to the opinions expressed herein, and our proprietary trading and investing businesses may make investment decisions that are inconsistent with the recommendations expressed herein. In reviewing these materials, you should be aware that any or all o the foregoing, among other things, may give rise to real or potential conflicts of interest. PL and its associates, their directors and employees may (a) from time to time, have a long or short position in, and buy or sell the securities of the subject company or (b) be engaged in any other transaction involving such securities and earn brokerage or other compensation or act as a market maker in the financial instruments of the subject company or act as an advisor or lender/borrower to the subject company or may have any other potential conflict of interests with respect to any recommendation and other related information and opinions. DISCLAIMER/DISCLOSURES (FOR US CLIENTS) ANALYST CERTIFICATION The research analysts, with respect to each issuer and its securities covered by them in this research report, certify that: All of the views expressed in this research report accurately reflect his or her or their personal views about all of the issuers and their securities; and No part of his or her or their compensation was, is or will be directly related to the specific recommendation or views expressed in this research report Terms & conditions and other disclosures: This research report is a product of Prabhudas Lilladher Pvt. Ltd., which is the employer of the research analyst(s) who has prepared the research report. The research analyst(s) preparing the research report is/are resident outside the United States (U.S.) and are not associated persons of any U.S. regulated broker‐dealer and therefore the analyst(s) is/are not subject to supervision by a U.S. broker‐dealer, and is/are not required to satisfy the regulatory licensing requirements of FINRA or required to otherwise comply with U.S. rules or regulations regarding, among other things, communications with a subject company, public appearances and trading securities held by a research analyst account. This report is intended for distribution by Prabhudas Lilladher Pvt. Ltd. only to "Major Institutional Investors" as defined by Rule 15a‐6(b)(4) of the U.S. Securities and Exchange Act, 1934 (the Exchange Act) and interpretations thereof by U.S. Securities and Exchange Commission (SEC) in reliance on Rule 15a 6(a)(2). If the recipient of this report is not a Major Institutional Investor as specified above, then it should not act upon this report and return the same to the sender. Further, this report may not be copied, duplicated and/or transmitted onward to any U.S. person, which is not the Major Institutional Investor. In reliance on the exemption from registration provided by Rule 15a‐6 of the Exchange Act and interpretations thereof by the SEC in order to conduct certain business with Major Institutional Investors, Prabhudas Lilladher Pvt. Ltd. has entered into an agreement with a U.S. registered broker‐dealer, Marco Polo Securities Inc. ("Marco Polo"). Transactions in securities discussed in this research report should be effected through Marco Polo or another U.S. registered broker dealer.