Solution Manual for Financial Accounting, 11th Edition by Robert Libby, Patri...
Firstcall shilpi cable_technologies_ltd_8_july15
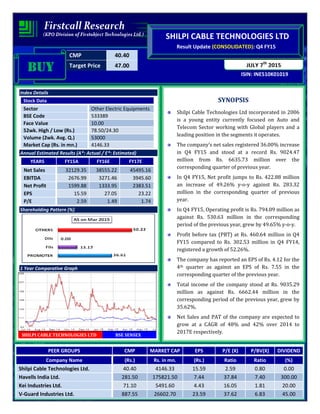
1. CMP 40.40
Target Price 47.00
ISIN: INE510K01019
JULY 7th
2015
SHILPI CABLE TECHNOLOGIES LTD
Result Update (CONSOLIDATED): Q4 FY15
BUYBUYBUYBUY
Index Details
Stock Data
Sector Other Electric Equipments
BSE Code 533389
Face Value 10.00
52wk. High / Low (Rs.) 78.50/24.30
Volume (2wk. Avg. Q.) 53000
Market Cap (Rs. in mn.) 4146.33
Annual Estimated Results (A*: Actual / E*: Estimated)
YEARS FY15A FY16E FY17E
Net Sales 32129.35 38555.22 45495.16
EBITDA 2676.99 3271.46 3945.60
Net Profit 1599.88 1333.95 2383.51
EPS 15.59 27.05 23.22
P/E 2.59 1.49 1.74
Shareholding Pattern (%)
1 Year Comparative Graph
SHILPI CABLE TECHNOLOGIES LTD BSE SENSEX
SYNOPSIS
Shilpi Cable Technologies Ltd incorporated in 2006
is a young entity currently focused on Auto and
Telecom Sector working with Global players and a
leading position in the segments it operates.
The company’s net sales registered 36.00% increase
in Q4 FY15 and stood at a record Rs. 9024.47
million from Rs. 6635.73 million over the
corresponding quarter of previous year.
In Q4 FY15, Net profit jumps to Rs. 422.88 million
an increase of 49.26% y-o-y against Rs. 283.32
million in the corresponding quarter of previous
year.
In Q4 FY15, Operating profit is Rs. 794.09 million as
against Rs. 530.63 million in the corresponding
period of the previous year, grew by 49.65% y-o-y.
Profit before tax (PBT) at Rs. 460.64 million in Q4
FY15 compared to Rs. 302.53 million in Q4 FY14,
registered a growth of 52.26%.
The company has reported an EPS of Rs. 4.12 for the
4th quarter as against an EPS of Rs. 7.55 in the
corresponding quarter of the previous year.
Total income of the company stood at Rs. 9035.29
million as against Rs. 6662.44 million in the
corresponding period of the previous year, grew by
35.62%.
Net Sales and PAT of the company are expected to
grow at a CAGR of 48% and 42% over 2014 to
2017E respectively.
PEER GROUPS CMP MARKET CAP EPS P/E (X) P/BV(X) DIVIDEND
Company Name (Rs.) Rs. in mn. (Rs.) Ratio Ratio (%)
Shilpi Cable Technologies Ltd. 40.40 4146.33 15.59 2.59 0.80 0.00
Havells India Ltd. 281.50 175821.50 7.44 37.84 7.40 300.00
Kei Industries Ltd. 71.10 5491.60 4.43 16.05 1.81 20.00
V-Guard Industries Ltd. 887.55 26602.70 23.59 37.62 6.83 45.00
2. QUARTERLY HIGHLIGHTS (CONSOLIDATED)
Results updates- Q4 FY15,
The company has achieved a turnover of Rs. 9024.47 million for the 4th quarter of the current year 2014-15 as
against Rs. 6635.73 million in the corresponding quarter of the previous year. EBITDA of Rs. 794.09 million in Q4
FY15 an increase of 49.65% against the corresponding period of last year. In Q4 FY15, net profit of Rs. 422.88
million against Rs. 283.32 million in the corresponding quarter of the previous year. The company has reported
an EPS of Rs. 4.12 for the 4th quarter as against an EPS of Rs. 7.55 in the corresponding quarter of the previous
year.
Break up of Expenditure
Rs. In million Mar-15 Mar-14 % Change
Net Sales 9024.47 6635.73 36.00
PAT 422.88 283.32 49.26
EPS 4.12 7.55 (45.44)
EBITDA 794.09 530.63 49.65
Break up of
Expenditure
(Rs. In millions)
Q4 FY15 Q4 FY14
%
Change
Purchase of Raw
Materials & Goods
7758.15 5719.74 36%
Manufacturing
Expenses
102.06 154.04 -34%
Employees benefits
expense
75.2 33.99 121%
Depreciation &
Amortization Expense
44.05 15.23 189%
Other Expenses 148.15 42.33 250%
3. COMPANY PROFILE
Shilpi Cable Technologies Limited, a separate wing of three decades old Shilpi Group was founded in the year
2006. Starting with a project to manufacture RF cables, Shilpi Cables has become a specialist across the varieties
of cables widely used in telecom, automobile and power sectors. An ISO 9001:2000 certified company Shilpi
Cables also owns the Type Approval Certificate for the products for GSM and CDMA applications as per the latest
specifications issued by various national & international organizations. Shilpi Cables' success in a very short span
is a result of its governing fundamentals. Shilpi believes in providing its customers the best quality products at
the most reasonable prices. Its research facilities, impeccable innovation and technological advancements help it
to understand the requirements of its clients and serve them better.
Shilpi Manufacturing Plants are located in Choupanki, and Bhiwadi, 1.5 hr drive from NCR, Shilpi Plant is spread
over 10.5 acres with ample space available for expansion. Shilpi is an ISO 9001: 2008; ISO TS 16949; ISO 14001:
2004; OHSAS 18001:2007 certified company with a capacity to produce over 850,000 km of wires and 9,000 km
of RF Feeder Cable in a year equipped with latest quality testing equipment, with Grid availability more than
95% with power back up systems in place, Effluent treatment plant & Rain water harvesting systems in place.
Radio Frequency Cables
The superlative quality Radio Frequency Corrugated Feeder Cables of Shilpi Cable Technologies Ltd. are outcome
of the state-of-the-art production facility of the company located in India at Chopanki in Rajasthan. With a view to
empower its clients with world class Radio Frequency Cables, Shilpi Cable has acquired the international class
manufacturing technology by Rosen Dahl. Shilpi Cable uses advanced 'Physical Foaming' along with 'Triple Layer
Extrusion' for achieving higher foaming percentage. Increased foaming percentage in Radio Frequency
Corrugated Feeder Cables reduces the chances of communication loss while the cable is in use.
Clients
• Bsnl
• Mtnl
• Airtel
• Tata indicom
• Idea
• Nokia
• Ericsson
• Videocon
• Zte
• Aircel
• Tata
• Reliance
4. Auto Wiring Facilities
The superlative quality Auto PVC insulated wires of Shilpi Cable Technologies Ltd. are outcome of the state-of-
the-art production facility of the company located in India at Chopanki in Rajasthan. With a vision of best quality
with best supplier for Auto wires and harnesses. Shilpi Cable has acquired the international class automated
manufacturing technology by Neihoff, Maillfer. Manufacturing as per standards referred by customer or
recognized internationally i.e. JIS 3406, ISO 6722 or ISO 14572.
Clients
• Ashok Leyland
• Hero
• Eicher
• Tata Motors
• Yamaha
• Bajaj
• TVS
• Honda
• Sonalika
Quality Assurance
The ISO 9001:2008 Quality Management System certification is successfully implemented and maintained for RF
Cable manufacturing.
The ISO/TS 16949:2009 Quality Management System certification is successfully implemented and maintained
for automotive cable manufacturing.
Products
• RF Cables
• RF Connectors
• RF Jumpers
• Automotive Cable
• PVC Insulated Battery Cable
• Photovoltaic Cables Solar
• Power Cord
• Power Energy Cables
• Control Cables
• Telephone Cables
• LAN Cable
• Co Axial Cables
• Solar Cables
• House Wire
• IBS
• PVC Insulated Power
Control Cable
• Wiring Harness
5. FINANCIAL HIGHLIGHT (CONSOLIDATED) (A*- Actual, E* -Estimations & Rs. In Millions)
Balance Sheet as at March 31, 2014 -2017E
FY14A FY15A FY16E FY17E
I. EQUITY AND LIABILITIES:
A. Shareholders’ Funds
a) Share Capital 493.16 1026.32 1026.32 1026.32
b) Reserves and Surplus 2894.25 4159.27 6110.21 8493.71
Sub-Total-Net worth 3387.41 5185.59 7136.53 9520.03
B. Share application money pending allotment 9.63 0.00 0.00 0.00
C. Non-Current Liabilities:
a) Long-term borrowings 594.41 938.23 1125.88 1317.27
b) Deferred Tax Liabilities [Net] 121.64 129.42 138.48 149.56
c) Long Term Provisions 5.05 12.53 18.17 23.62
Sub-Total-Long term liabilities 721.10 1080.18 1282.52 1490.45
D. Current Liabilities:
a) Short-term borrowings 1697.88 3516.64 4641.96 5848.88
b) Trade Payables 5489.93 7657.60 9495.42 11109.64
c) Other Current Liabilities 45.37 160.20 248.31 302.94
d) Short Term Provisions 104.02 171.52 214.40 252.99
Sub-Total-Current Liabilities 7337.20 11505.96 14600.10 17514.45
TOTAL-EQUITY AND LIABILITIES (A+B+C+D) 11455.34 17771.73 23019.15 28524.93
II. ASSETS:
E. Non-Current Assets:
Fixed Assets
Tangible Assets 959.95 1468.34 1894.16 2310.87
Capital work in progress 1.39 142.04 191.75 222.43
Intangible assets under development 0.00 4.31 4.53 4.66
Sub-Total-Fixed Assets 961.34 1614.69 2085.91 2533.31
Non Current Investments 143.10 143.11 151.70 157.76
Long Term Loans and Advances 239.41 14.23 14.37 14.66
Sub-Total-Non-Current Assets 1343.85 1772.03 2251.98 2705.73
F. Current Assets:
a) Inventories 1825.13 2469.76 2963.71 3497.18
b) Trade Receivables 6669.36 10283.30 13459.85 16889.26
c) Cash and Bank Balances 969.03 1645.99 2172.71 2694.16
d) Short Term Loans and Advances 186.99 334.04 460.98 567.00
e) Other Current Assets 460.98 1266.61 1709.92 2171.60
Sub-Total-Current Assets 10111.49 15999.70 20767.17 25819.20
TOTAL-ASSETS (E+F) 11455.34 17771.73 23019.15 28524.93
6. Annual Profit & Loss Statement for the period of 2014 to 2017E
Quarterly Profit & Loss Statement for the period of 30th Sep, 2014 to 30th June, 2015E
Value(Rs.in.mn) 30-Sep-14 31-Dec-14 31-Mar-15 30-Jun-15E
Description 3m 3m 3m 3m
Net sales 7457.71 8598.43 9024.47 9421.55
Other income 15.02 30.60 10.82 8.12
Total Income 7472.73 8629.03 9035.29 9429.66
Expenditure -6825.81 -7966.49 -8241.20 -8620.72
Operating profit 646.92 662.54 794.09 808.95
Interest -180.63 -196.09 -289.40 -254.67
Gross profit 466.29 466.45 504.69 554.27
Depreciation -15.79 -16.93 -44.05 -37.00
Profit Before Tax 450.50 449.52 460.64 517.27
Tax -48.93 -49.28 -37.76 -52.24
Net Profit 401.57 400.24 422.88 465.03
Equity capital 986.32 986.32 1026.32 1026.32
Face value 10.00 10.00 10.00 10.00
EPS 4.07 4.06 4.12 4.53
Value(Rs.in.mn) FY14A FY15A FY16E FY17E
Description 12m 12m 12m 12m
Net Sales 17529.40 32129.35 38555.22 45495.16
Other Income 54.27 63.73 71.38 78.52
Total Income 17583.67 32193.08 38626.60 45573.67
Expenditure -15817.78 -29516.09 -35355.14 -41628.07
Operating Profit 1765.89 2676.99 3271.46 3945.60
Interest -596.82 -807.59 -985.26 -1162.61
Gross profit 1169.07 1869.40 2286.20 2783.00
Depreciation -49.75 -90.69 -116.08 -134.66
Exceptional Items 0.43 0.00 0.00 0.00
Profit Before Tax 1119.75 1778.71 2170.12 2648.34
Tax -118.86 -178.83 -219.18 -264.83
Net Profit 1000.89 1599.88 1950.94 2383.51
Equity capital 493.16 1026.32 1026.32 1026.32
Reserves 2894.25 4159.27 6110.21 8493.71
Face value 10.00 10.00 10.00 10.00
EPS 20.30 15.59 19.01 23.22
8. OUTLOOK AND CONCLUSION
At the current market price of Rs. 40.40, the stock P/E ratio is at 1.49 x FY16E and 1.74 x FY17E respectively.
Earning per share (EPS) of the company for the earnings for FY16E and FY17E is seen at Rs.27.05 and
Rs.23.22 respectively.
Net Sales and PAT of the company are expected to grow at a CAGR of 48% and 42% over 2014 to 2017E
respectively.
On the basis of EV/EBITDA, the stock trades at 2.37 x for FY16E and 2.18 x for FY17E.
Price to Book Value of the stock is expected to be at 0.58 x and 0.44 x for FY16E and FY17E respectively.
We expect that the company surplus scenario is likely to continue for the next three years, will keep its
growth story in the coming quarters also. We recommend ‘BUY’ in this particular scrip with a target price of
Rs.47.00 for Medium to Long term investment.
INDUSTRY OVERVIEW
India is the world's second-largest telecommunications market, with 964 million subscribers as of November
2014. With 164.81 million internet subscriptions, India also stood third-highest in terms of total internet users in
2013. The number of internet subscribers increased at a compound annual growth rate (CAGR) of 52 per cent to
243 million in 2014 from 8.6 million in 2006. The wireless segment (97 per cent of total telephone subscriptions)
dominates the market, while the wireline segment accounts for the rest. During FY07-14, wireless subscriptions
increased at a CAGR of 27.5 per cent to 904.51 million. Telecom penetration in the nation's rural market is
expected to increase from 41 per cent as of March 2013 to 70 per cent by 2017.
The Indian auto components industry has experienced healthy sequential growth over the last one-and-a-half
years. The growth can be attributed to factors such as strong buoyancy in the end-user industry, recovery of the
global economy, improved consumer sentiment and return of adequate liquidity in the financial system. The
revival of the auto industry was initially driven by the fiscal stimulus programme of the government. The
industry currently accounts for almost seven per cent of India’s gross domestic product (GDP) and employs
about 19 million people, both directly and indirectly. The ever-increasing development in infrastructure, big
domestic market, increasing purchasing power and stable government framework have made India a favourable
destination for investment, as per the vision of Automotive Mission Plan (AMP) 2006–2016.
The rapidly globalising world is opening new avenues for the transportation industry, generating the need for
more efficient, safe and reliable modes of transportation, which is subsequently adding to the auto component
industry’s growing opportunities. According to a report by the Confederation of Indian Industry (CII), the Indian
auto component industry is set to become the third largest in the world by 2025. Also, by that time, newer
9. verticals and opportunities for component manufacturers will open up as the automobile market will shift
towards electric, electronic and hybrid cars, and newer technologies will have to be adopted via systematic
research and development. Indian auto component makers are well positioned to benefit from the globalisation
of the sector as exports potential could be increased by up to four times to US$ 40 billion by 2020.
Disclaimer:
This document is prepared by our research analysts and it does not constitute an offer or solicitation for the
purchase or sale of any financial instrument or as an official confirmation of any transaction. The information
contained herein is from publicly available data or other sources believed to be reliable but we do not represent that
it is accurate or complete and it should not be relied on as such. Firstcall Research or any of its affiliates shall not be
in any way responsible for any loss or damage that may arise to any person from any inadvertent error in the
information contained in this report. Firstcall Research and/ or its affiliates and/or employees will not be liable for
the recipients’ investment decision based on this document.
10. Firstcall India Equity Research: Email – info@firstobjectindia.com
C.V.S.L.Kameswari Pharma & Diversified
U. Janaki Rao Capital Goods
B. Anil Kumar Auto, IT & FMCG
M. Vinayak Rao Diversified
G. Amarender Diversified
Firstcall Research Provides
Industry Research on all the Sectors and Equity Research on Major Companies
forming part of Listed and Unlisted Segments
For Further Details Contact:
Tel.: 022-2527 2510/2527 6077 / 25276089 Telefax: 022-25276089
040-20000235 /20000233
E-mail: info@firstobjectindia.com
www.firstcallresearch.com