SlideShare a Scribd company logo
1 of 1
Download to read offline
Analysing	
  your	
  data	


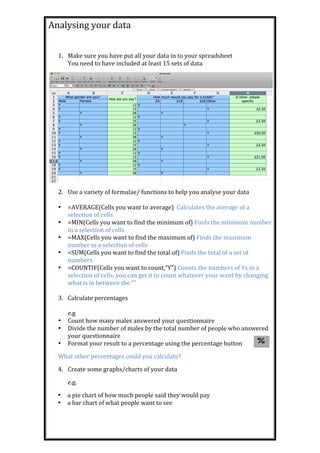
       1. Make	
  sure	
  you	
  have	
  put	
  all	
  your	
  data	
  in	
  to	
  your	
  spreadsheet	
  
          You	
  need	
  to	
  have	
  included	
  at	
  least	
  15	
  sets	
  of	
  data	


       2. Use	
  a	
  variety	
  of	
  formulae/	
  functions	
  to	
  help	
  you	
  analyse	
  your	
  data	


       • =AVERAGE(Cells	
  you	
  want	
  to	
  average)	
  	
  Calculates	
  the	
  average	
  of	
  a	
  
          selection	
  of	
  cells	
  
       • =MIN(Cells	
  you	
  want	
  to	
  find	
  the	
  minimum	
  of)	
  Finds	
  the	
  minimum	
  number	
  
          in	
  a	
  selection	
  of	
  cells	
  
       • =MAX(Cells	
  you	
  want	
  to	
  find	
  the	
  maximum	
  of)	
  Finds	
  the	
  maximum	
  
          number	
  in	
  a	
  selection	
  of	
  cells	
  
       • =SUM(Cells	
  you	
  want	
  to	
  find	
  the	
  total	
  of)	
  Finds	
  the	
  total	
  of	
  a	
  set	
  of	
  
          numbers	
  
       • =COUNTIF(Cells	
  you	
  want	
  to	
  count,”Y”)	
  Counts	
  the	
  numbers	
  of	
  Ys	
  in	
  a	
  
          selection	
  of	
  cells,	
  you	
  can	
  get	
  it	
  to	
  count	
  whatever	
  your	
  want	
  by	
  changing	
  
          what	
  is	
  in	
  between	
  the	
  “”	


       3. Calculate	
  percentages	


          e.g	
  
       • Count	
  how	
  many	
  males	
  answered	
  your	
  questionnaire	
  
       • Divide	
  the	
  number	
  of	
  males	
  by	
  the	
  total	
  number	
  of	
  people	
  who	
  answered	
  
          your	
  questionnaire	
  
       • Format	
  your	
  result	
  to	
  a	
  percentage	
  using	
  the	
  percentage	
  button	
  
       What	
  other	
  percentages	
  could	
  you	
  calculate?	
  
       4. Create	
  some	
  graphs/charts	
  of	
  your	
  data	
  

            e.g.	
  	
  
       •    a	
  pie	
  chart	
  of	
  how	
  much	
  people	
  said	
  they	
  would	
  pay	
  
       •    a	
  bar	
  chart	
  of	
  what	
  people	
  want	
  to	
  see	


More Related Content

Similar to Analyse Data

Data Collection & Analysis Educational Presentation in Pink and Blue Lined St...
Data Collection & Analysis Educational Presentation in Pink and Blue Lined St...Data Collection & Analysis Educational Presentation in Pink and Blue Lined St...
Data Collection & Analysis Educational Presentation in Pink and Blue Lined St...
MalikQadeer8
 
data science with python_UNIT 2_full notes.pdf
data science with python_UNIT 2_full notes.pdfdata science with python_UNIT 2_full notes.pdf
data science with python_UNIT 2_full notes.pdf
mukeshgarg02
 
PSUnit_IV_Lesson_1_Computing_the_Point_Estimate_of_a_Population_Mean.pptx
PSUnit_IV_Lesson_1_Computing_the_Point_Estimate_of_a_Population_Mean.pptxPSUnit_IV_Lesson_1_Computing_the_Point_Estimate_of_a_Population_Mean.pptx
PSUnit_IV_Lesson_1_Computing_the_Point_Estimate_of_a_Population_Mean.pptx
Erwin806347
 
How To Plan An Experiment
How To Plan An ExperimentHow To Plan An Experiment
How To Plan An Experiment
shas595
 

Similar to Analyse Data (20)

An-Introduction-to-SPSS-Workshop-SessionV2-2.pptx
An-Introduction-to-SPSS-Workshop-SessionV2-2.pptxAn-Introduction-to-SPSS-Workshop-SessionV2-2.pptx
An-Introduction-to-SPSS-Workshop-SessionV2-2.pptx
 
statistical inference.pptx
statistical inference.pptxstatistical inference.pptx
statistical inference.pptx
 
Data Collection & Analysis Educational Presentation in Pink and Blue Lined St...
Data Collection & Analysis Educational Presentation in Pink and Blue Lined St...Data Collection & Analysis Educational Presentation in Pink and Blue Lined St...
Data Collection & Analysis Educational Presentation in Pink and Blue Lined St...
 
New Microsoft PowerPoint Presentation.pptx
New Microsoft PowerPoint Presentation.pptxNew Microsoft PowerPoint Presentation.pptx
New Microsoft PowerPoint Presentation.pptx
 
Lecture 2 What is Statistics, Anyway
Lecture 2 What is Statistics, AnywayLecture 2 What is Statistics, Anyway
Lecture 2 What is Statistics, Anyway
 
Lec 3.pptx
Lec 3.pptxLec 3.pptx
Lec 3.pptx
 
Sampling
SamplingSampling
Sampling
 
Introduction to Descriptive Statistics
Introduction to Descriptive StatisticsIntroduction to Descriptive Statistics
Introduction to Descriptive Statistics
 
Spss (1)
Spss (1)Spss (1)
Spss (1)
 
data science with python_UNIT 2_full notes.pdf
data science with python_UNIT 2_full notes.pdfdata science with python_UNIT 2_full notes.pdf
data science with python_UNIT 2_full notes.pdf
 
Getting Started with R
Getting Started with RGetting Started with R
Getting Started with R
 
statics engineering mechanics slides.pdf
statics engineering mechanics slides.pdfstatics engineering mechanics slides.pdf
statics engineering mechanics slides.pdf
 
Organizing data
Organizing dataOrganizing data
Organizing data
 
MS-EXCEL Assignment Help
MS-EXCEL Assignment HelpMS-EXCEL Assignment Help
MS-EXCEL Assignment Help
 
DATA ANALYTICS ASSIGNMENT.pptx
DATA ANALYTICS ASSIGNMENT.pptxDATA ANALYTICS ASSIGNMENT.pptx
DATA ANALYTICS ASSIGNMENT.pptx
 
PSUnit_IV_Lesson_1_Computing_the_Point_Estimate_of_a_Population_Mean.pptx
PSUnit_IV_Lesson_1_Computing_the_Point_Estimate_of_a_Population_Mean.pptxPSUnit_IV_Lesson_1_Computing_the_Point_Estimate_of_a_Population_Mean.pptx
PSUnit_IV_Lesson_1_Computing_the_Point_Estimate_of_a_Population_Mean.pptx
 
L8 scientific visualization of data
L8 scientific visualization of dataL8 scientific visualization of data
L8 scientific visualization of data
 
1628 statistics
1628 statistics1628 statistics
1628 statistics
 
Software fundamentals
Software fundamentalsSoftware fundamentals
Software fundamentals
 
How To Plan An Experiment
How To Plan An ExperimentHow To Plan An Experiment
How To Plan An Experiment
 

Recently uploaded

Structuring Teams and Portfolios for Success
Structuring Teams and Portfolios for SuccessStructuring Teams and Portfolios for Success
Structuring Teams and Portfolios for Success
UXDXConf
 
Harnessing Passkeys in the Battle Against AI-Powered Cyber Threats.pptx
Harnessing Passkeys in the Battle Against AI-Powered Cyber Threats.pptxHarnessing Passkeys in the Battle Against AI-Powered Cyber Threats.pptx
Harnessing Passkeys in the Battle Against AI-Powered Cyber Threats.pptx
FIDO Alliance
 

Recently uploaded (20)

Secure Zero Touch enabled Edge compute with Dell NativeEdge via FDO _ Brad at...
Secure Zero Touch enabled Edge compute with Dell NativeEdge via FDO _ Brad at...Secure Zero Touch enabled Edge compute with Dell NativeEdge via FDO _ Brad at...
Secure Zero Touch enabled Edge compute with Dell NativeEdge via FDO _ Brad at...
 
Long journey of Ruby Standard library at RubyKaigi 2024
Long journey of Ruby Standard library at RubyKaigi 2024Long journey of Ruby Standard library at RubyKaigi 2024
Long journey of Ruby Standard library at RubyKaigi 2024
 
Using IESVE for Room Loads Analysis - UK & Ireland
Using IESVE for Room Loads Analysis - UK & IrelandUsing IESVE for Room Loads Analysis - UK & Ireland
Using IESVE for Room Loads Analysis - UK & Ireland
 
Simplified FDO Manufacturing Flow with TPMs _ Liam at Infineon.pdf
Simplified FDO Manufacturing Flow with TPMs _ Liam at Infineon.pdfSimplified FDO Manufacturing Flow with TPMs _ Liam at Infineon.pdf
Simplified FDO Manufacturing Flow with TPMs _ Liam at Infineon.pdf
 
ADP Passwordless Journey Case Study.pptx
ADP Passwordless Journey Case Study.pptxADP Passwordless Journey Case Study.pptx
ADP Passwordless Journey Case Study.pptx
 
TopCryptoSupers 12thReport OrionX May2024
TopCryptoSupers 12thReport OrionX May2024TopCryptoSupers 12thReport OrionX May2024
TopCryptoSupers 12thReport OrionX May2024
 
Structuring Teams and Portfolios for Success
Structuring Teams and Portfolios for SuccessStructuring Teams and Portfolios for Success
Structuring Teams and Portfolios for Success
 
2024 May Patch Tuesday
2024 May Patch Tuesday2024 May Patch Tuesday
2024 May Patch Tuesday
 
Introduction to FIDO Authentication and Passkeys.pptx
Introduction to FIDO Authentication and Passkeys.pptxIntroduction to FIDO Authentication and Passkeys.pptx
Introduction to FIDO Authentication and Passkeys.pptx
 
Overview of Hyperledger Foundation
Overview of Hyperledger FoundationOverview of Hyperledger Foundation
Overview of Hyperledger Foundation
 
Collecting & Temporal Analysis of Behavioral Web Data - Tales From The Inside
Collecting & Temporal Analysis of Behavioral Web Data - Tales From The InsideCollecting & Temporal Analysis of Behavioral Web Data - Tales From The Inside
Collecting & Temporal Analysis of Behavioral Web Data - Tales From The Inside
 
ERP Contender Series: Acumatica vs. Sage Intacct
ERP Contender Series: Acumatica vs. Sage IntacctERP Contender Series: Acumatica vs. Sage Intacct
ERP Contender Series: Acumatica vs. Sage Intacct
 
FDO for Camera, Sensor and Networking Device – Commercial Solutions from VinC...
FDO for Camera, Sensor and Networking Device – Commercial Solutions from VinC...FDO for Camera, Sensor and Networking Device – Commercial Solutions from VinC...
FDO for Camera, Sensor and Networking Device – Commercial Solutions from VinC...
 
How Red Hat Uses FDO in Device Lifecycle _ Costin and Vitaliy at Red Hat.pdf
How Red Hat Uses FDO in Device Lifecycle _ Costin and Vitaliy at Red Hat.pdfHow Red Hat Uses FDO in Device Lifecycle _ Costin and Vitaliy at Red Hat.pdf
How Red Hat Uses FDO in Device Lifecycle _ Costin and Vitaliy at Red Hat.pdf
 
Working together SRE & Platform Engineering
Working together SRE & Platform EngineeringWorking together SRE & Platform Engineering
Working together SRE & Platform Engineering
 
Microsoft CSP Briefing Pre-Engagement - Questionnaire
Microsoft CSP Briefing Pre-Engagement - QuestionnaireMicrosoft CSP Briefing Pre-Engagement - Questionnaire
Microsoft CSP Briefing Pre-Engagement - Questionnaire
 
State of the Smart Building Startup Landscape 2024!
State of the Smart Building Startup Landscape 2024!State of the Smart Building Startup Landscape 2024!
State of the Smart Building Startup Landscape 2024!
 
Where to Learn More About FDO _ Richard at FIDO Alliance.pdf
Where to Learn More About FDO _ Richard at FIDO Alliance.pdfWhere to Learn More About FDO _ Richard at FIDO Alliance.pdf
Where to Learn More About FDO _ Richard at FIDO Alliance.pdf
 
How we scaled to 80K users by doing nothing!.pdf
How we scaled to 80K users by doing nothing!.pdfHow we scaled to 80K users by doing nothing!.pdf
How we scaled to 80K users by doing nothing!.pdf
 
Harnessing Passkeys in the Battle Against AI-Powered Cyber Threats.pptx
Harnessing Passkeys in the Battle Against AI-Powered Cyber Threats.pptxHarnessing Passkeys in the Battle Against AI-Powered Cyber Threats.pptx
Harnessing Passkeys in the Battle Against AI-Powered Cyber Threats.pptx
 

Analyse Data

  • 1. Analysing  your  data     1. Make  sure  you  have  put  all  your  data  in  to  your  spreadsheet   You  need  to  have  included  at  least  15  sets  of  data     2. Use  a  variety  of  formulae/  functions  to  help  you  analyse  your  data     • =AVERAGE(Cells  you  want  to  average)    Calculates  the  average  of  a   selection  of  cells   • =MIN(Cells  you  want  to  find  the  minimum  of)  Finds  the  minimum  number   in  a  selection  of  cells   • =MAX(Cells  you  want  to  find  the  maximum  of)  Finds  the  maximum   number  in  a  selection  of  cells   • =SUM(Cells  you  want  to  find  the  total  of)  Finds  the  total  of  a  set  of   numbers   • =COUNTIF(Cells  you  want  to  count,”Y”)  Counts  the  numbers  of  Ys  in  a   selection  of  cells,  you  can  get  it  to  count  whatever  your  want  by  changing   what  is  in  between  the  “”     3. Calculate  percentages     e.g   • Count  how  many  males  answered  your  questionnaire   • Divide  the  number  of  males  by  the  total  number  of  people  who  answered   your  questionnaire   • Format  your  result  to  a  percentage  using  the  percentage  button   What  other  percentages  could  you  calculate?   4. Create  some  graphs/charts  of  your  data   e.g.     • a  pie  chart  of  how  much  people  said  they  would  pay   • a  bar  chart  of  what  people  want  to  see