Analyse Data
•
0 likes•157 views
This document provides instructions for analysing data that has been collected in a spreadsheet. It recommends including at least 15 sets of data and using formulas like AVERAGE, MIN, MAX, SUM and COUNTIF to analyse the data. It also suggests calculating percentages by dividing subsets of the data by the total. Finally, it recommends creating graphs and charts like pie charts and bar charts to visualize the analysed data.
Report
Share
Report
Share
Download to read offline
Recommended
8.1 Internet Addiction Leaflet
The document provides instructions for students to design an information leaflet about internet addiction for doctors' waiting rooms. It outlines the tasks of planning the layout and design of the leaflet, including the title, fonts, images and content. Students will then exchange designs with peers for feedback before finalizing their leaflet, which should define internet addiction, list symptoms, and advise what to do if addicted.
Advantages and disadvantages of social media
an interesting show about social media that you can find all the information and it also contains an interesting video with voice so u can understand what is the advantages and disadvantages of social media very clearly....................................................................................................................................................u just need to watch this u will be interested ,iam sure about that
InnerSoft STATS - Analyze
This document provides an overview and instructions for using the InnerSoft STATS software to analyze data. It describes 15 different analysis procedures that can be accessed from the software's Analyze Menu, including frequency tables, descriptive statistics, crosstabs, hypothesis tests, ANOVA, correlation, regression, and time series analysis. For each analysis procedure, it provides a brief overview and descriptions of the input options and statistical tests that can be selected. The document is intended to help users understand what types of analyses can be performed and how to set up and interpret the results.
4 CREATING GRAPHS A PICTURE REALLY IS WORTH A THOUSAND WORDS4 M.docx
4 CREATING GRAPHS A PICTURE REALLY IS WORTH A THOUSAND WORDS
4: MEDIA LIBRARY
Premium Videos
Core Concepts in Stats Video
· Examining Data: Tables and Figures
Lightboard Lecture Video
· Creating a Simple Chart
Time to Practice Video
· Chapter 4: Problem 3
Difficulty Scale
(moderately easy but not a cinch)
WHAT YOU WILL LEARN IN THIS CHAPTER
· Understanding why a picture is really worth a thousand words
· Creating a histogram and a polygon
· Understanding the different shapes of different distributions
· Using SPSS to create incredibly cool charts
· Creating different types of charts and understanding their application and uses
WHY ILLUSTRATE DATA?
In the previous two chapters, you learned about the two most important types of descriptive statistics—measures of central tendency and measures of variability. Both of these provide you with the one best number for describing a group of data (central tendency) and a number reflecting how diverse, or different, scores are from one another (variability).
What we did not do, and what we will do here, is examine how differences in these two measures result in different-looking distributions. Numbers alone (such as M = 3 and s = 3) may be important, but a visual representation is a much more effective way of examining the characteristics of a distribution as well as the characteristics of any set of data.
So, in this chapter, we’ll learn how to visually represent a distribution of scores as well as how to use different types of graphs to represent different types of data.
CORE CONCEPTS IN STATS VIDEO
Examining Data: Tables and Figures
X-TIMESTAMP-MAP=LOCAL: Examining data helps find data entry errors, evaluate research methodology, identify outliers, and determine the shape of a distribution in a data set. Researchers typically examine collected data in two ways, by creating tables and figures. Imagine you asked a group of friends to rate a movie they've seen on a one to five scale. A table helps identify the variable and the possible values of the variable. The sample size, often referred to as n, is 14 because there are ratings reported from 14 people. This is how large the total sample is. From this, we can determine how many in the sample have each value of the variable. We can also determine the percentage that the sample has of each possible value. Figures display variables from the table. Nominal and ordinal variables can be depicted with bar charts, while interval and ratio variables can be depicted using histograms and frequency polygons. For this data set, we can use a bar chart. Distributions of data can be characterized along three aspects or dimensions, modality, symmetry, and variability. In a unimodal distribution, a small range of values has the greatest frequency or mode of the set. However, it's possible for a distribution to have more than one mode. For a bimodal distribution, we see two values that seem to occur w.
Data Wrangling_1.pptx
Data wrangling is the process of removing errors and combining complex data sets to make them more accessible and easier to analyze. Due to the rapid expansion of the amount of data and data sources available today, storing and organizing large quantities of data for analysis is becoming increasingly necessary.Data wrangling is the process of removing errors and combining complex data sets to make them more accessible and easier to analyze. Due to the rapid expansion of the amount of data and data sources available today, storing and organizing large quantities of data for analysis is becoming increasingly necessary.Data wrangling is the process of removing errors and combining complex data sets to make them more accessible and easier to analyze. Due to the rapid expansion of the amount of data and data sources available today, storing and organizing large quantities of data for analysis is becoming increasingly necessary.
Descriptive Statistics
This document provides an overview of statistics concepts including descriptive and inferential statistics. Descriptive statistics are used to summarize and describe data through measures of central tendency (mean, median, mode), dispersion (range, standard deviation), and frequency/percentage. Inferential statistics allow inferences to be made about a population based on a sample through hypothesis testing and other statistical techniques. The document discusses preparing data in Excel and using formulas and functions to calculate descriptive statistics. It also introduces the concepts of normal distribution, kurtosis, and skewness in describing data distributions.
Introduction
This document provides an introduction to descriptive statistics and how to calculate them in Excel and Stata. It discusses measures like the mean, median, mode, variance, standard deviation, minimum and maximum values. It also covers how to create histograms, bar charts, line charts, and calculate the correlation coefficient in both programs. Examples using sample datasets demonstrate how to find these statistics and visualize the data.
ststs nw.pptx
Statistical concepts and their applications in various fields:
- Statistics involves collecting and analyzing numerical data to draw valid conclusions. It requires careful research planning and design.
- Descriptive statistics summarize data through measures of central tendency (mean, median, mode) and variability (range, standard deviation).
- Inferential statistics test hypotheses and make estimates about populations based on samples.
- Biostatistics is applied in community medicine, public health, cancer research, pharmacology, and demography to study disease trends, treatment effectiveness, and population attributes. It is also used in advanced biomedical technologies and ecology.
An-Introduction-to-SPSS-Workshop-SessionV2-2.pptx
This document provides an overview of an introduction to SPSS workshop. The workshop will cover starting and entering data into SPSS, the main features of SPSS, importing data from Excel, and performing simple data manipulations and descriptive statistics. The sessions will include starting SPSS, an overview of the main SPSS features like the menu bar and tool bar, entering sample pet survey data, importing an Excel file, recoding a variable, and generating frequency tables and descriptive statistics for categorical and numerical variables.
statistical inference.pptx
This chapter introduces statistical inference and how it is used to make statements about population characteristics based on sample data. It discusses the differences between descriptive and inferential statistics, and how inferential statistics is used for estimation and hypothesis testing. It also explains key concepts like random sampling, sample statistics, population parameters, sampling distributions, sampling error, and how the central limit theorem allows inferring characteristics of the population from a sample as long as the sample size is at least 30.
Data Collection & Analysis Educational Presentation in Pink and Blue Lined St...
This document outlines key concepts around data collection and analysis for middle school science students. It discusses the differences between qualitative and quantitative data, how to calculate mean, median, and mode from data sets, and the different types of graphs used to analyze and visualize data, including bar graphs, line graphs, and pie charts. The document provides examples and checks for understanding to reinforce the concepts.
New Microsoft PowerPoint Presentation.pptx
Data analysis involves inspecting, cleansing, transforming, and modeling data to enhance productivity and business growth. It refers to techniques used to analyze data to derive insights, generate reports, perform market analysis, and improve business strategies. Common data analysis tools include Tableau, Power BI, R, Python, and Apache Spark. Decision science uses quantitative techniques like decision analysis, risk analysis, and simulation modeling to inform decision-making. It is part of fields like operations research, microeconomics, and computer science.
Lecture 2 What is Statistics, Anyway
This document provides an overview of key concepts in statistics, including:
- Statistics is the mathematics of collecting and analyzing data to draw conclusions and make predictions.
- Variables, samples, populations, parameters, and statistics are introduced.
- Descriptive and inferential statistics are discussed, with probability serving as the bridge between the two.
- Common sampling techniques like simple random sampling, stratified sampling, and cluster sampling are described.
- The differences between observational and experimental studies are outlined. Experimental design and potential confounding variables are also covered.
- The importance of ethics in statistics, including protecting human subjects, is emphasized.
Lec 3.pptx
The document discusses different types of data sets that can be analyzed in data science. It describes record, graph and network, ordered, spatial, image and multimedia data. It then discusses key concepts related to data sets including data objects, attributes, attribute types (nominal, binary, numeric), and characteristics of data sets like dimensionality and sparsity. The document also lists some repositories for finding publicly available data sets and outlines strategies for getting data like being provided data, downloading data, or scraping data from the web. Finally, it introduces the topic of data visualization.
Sampling
This document discusses various sampling techniques used in research. It defines key terms like population, sample, census, and sampling frame. It describes probability sampling methods like simple random sampling, systematic sampling, stratified random sampling, cluster sampling, and multi-stage sampling. It also discusses non-probability sampling techniques like judgmental, quota, snowball, and convenience sampling. The document emphasizes the importance of selecting the most appropriate sampling technique based on the research question and having a representative sample.
Introduction to Descriptive Statistics
Lecture on Introduction to Descriptive Statistics - Part 1 and Part 2. These slides were presented during a lecture at the Colombo Institute of Research and Psychology.
Spss (1)
This document provides an overview of using the statistical software package SPSS. It discusses the four main windows in SPSS - the data editor, output viewer, syntax editor, and script window. It also covers the basics of managing data files, including opening SPSS, defining variables, and saving data. Finally, it demonstrates some common analyses in SPSS including frequencies, descriptives, and linear regression as well as how to interpret the outputs and plot regression lines. The overall purpose is to introduce the basics of using SPSS to perform statistical analysis and data management.
Getting Started with R
This document provides an introduction to advanced data analytics using R. It outlines the key steps in an analytics process: [1] understanding the domain; [2] obtaining and cleaning data; [3] reducing, transforming, and visualizing the data; [4] choosing analytical approaches; and [5] communicating results. As a first example, it analyzes a public dataset on ice cream consumption using R commands to summarize, visualize with histograms and boxplots, and explore relationships between variables like income, temperature, and consumption over time. The document demonstrates how to interpret these analyses and leverage additional tools in R to further understand the data.
statics engineering mechanics slides.pdf
This document provides an introduction to key concepts in statistics and experimental design. It defines descriptive and inferential statistics, and explains the difference between populations and samples. Descriptive statistics summarize and organize data, while inferential statistics make generalizations from samples to populations. The document also outlines important aspects of experimental design like control, randomization, replication, and blocking. It discusses different sampling methods and defines terms like experimental units, factors, levels, and treatments in the context of designed experiments.
Organizing data
This document provides information and instructions for organizing and describing data using line plots, measures of central tendency (mean, median, mode), and range. It also discusses how to make different types of graphs and charts, including bar graphs, circle graphs, pictographs, and line graphs. Specific instructions are given for constructing line plots and calculating the mean, median, mode, and range. The purpose is to help students understand how to organize numerical data in a clear way using various visual representations.
MS-EXCEL Assignment Help
The site present the assignment to the students in well- structured manner including all the information in the simplest form, so that students need not spend extra time and effort in completion of the assignment and along with these they can also gain all the content engraved in the brain.
DATA ANALYTICS ASSIGNMENT.pptx
Data analysis involves inspecting, cleansing, transforming, and modeling data to draw conclusions and make predictions that inform decision-making. It includes gathering hidden insights from data, generating reports, and performing market analysis to improve business strategies. Data analytics builds on data analysis by including additional processes like data science and engineering. It allows businesses to gain hidden patterns from customer behavior for more informed decisions, effective marketing, efficient operations, and cost cutting.
PSUnit_IV_Lesson_1_Computing_the_Point_Estimate_of_a_Population_Mean.pptx
This document discusses methods for estimating population parameters from sample data. It defines a point estimate as a specific numerical value of a population parameter, such as using the sample mean to estimate the population mean. An interval estimate provides a range of values that may contain the true population parameter. The document presents examples of how to calculate point estimates of population means by taking the average of sample means from subsets of data.
PSUnit_IV_Lesson_1_Computing_the_Point_Estimate_of_a_Population_Mean.pptx
Computing_the_Point_Estimate_of_a_Population_Mean
L8 scientific visualization of data
Tutorial for beginning graduate students. Basic exploration of multivariate experimental data can be done with freely downloadable software. We also discuss the use of Excel because it is commonly in use.
1628 statistics
This document provides information about statistics and how Dr. John Snow used statistics to identify the source of a cholera outbreak in London in 1840. It explains how Snow mapped deaths from cholera and found they were concentrated around a single water pump, showing the pump was contaminating the water and causing deaths. His use of statistics led to identifying the source of the outbreak and changes that saved thousands of lives. The document then provides definitions and examples of key statistical concepts like mean, median, mode, and frequency tables.
Software fundamentals
The very basics of Software Development Fundamentals. (A prerequisite of learning Object Oriented Programming).
zkStudyClub - LatticeFold: A Lattice-based Folding Scheme and its Application...
Folding is a recent technique for building efficient recursive SNARKs. Several elegant folding protocols have been proposed, such as Nova, Supernova, Hypernova, Protostar, and others. However, all of them rely on an additively homomorphic commitment scheme based on discrete log, and are therefore not post-quantum secure. In this work we present LatticeFold, the first lattice-based folding protocol based on the Module SIS problem. This folding protocol naturally leads to an efficient recursive lattice-based SNARK and an efficient PCD scheme. LatticeFold supports folding low-degree relations, such as R1CS, as well as high-degree relations, such as CCS. The key challenge is to construct a secure folding protocol that works with the Ajtai commitment scheme. The difficulty, is ensuring that extracted witnesses are low norm through many rounds of folding. We present a novel technique using the sumcheck protocol to ensure that extracted witnesses are always low norm no matter how many rounds of folding are used. Our evaluation of the final proof system suggests that it is as performant as Hypernova, while providing post-quantum security.
Paper Link: https://eprint.iacr.org/2024/257
Harnessing the Power of NLP and Knowledge Graphs for Opioid Research
Gursev Pirge, PhD
Senior Data Scientist - JohnSnowLabs
More Related Content
Similar to Analyse Data
An-Introduction-to-SPSS-Workshop-SessionV2-2.pptx
This document provides an overview of an introduction to SPSS workshop. The workshop will cover starting and entering data into SPSS, the main features of SPSS, importing data from Excel, and performing simple data manipulations and descriptive statistics. The sessions will include starting SPSS, an overview of the main SPSS features like the menu bar and tool bar, entering sample pet survey data, importing an Excel file, recoding a variable, and generating frequency tables and descriptive statistics for categorical and numerical variables.
statistical inference.pptx
This chapter introduces statistical inference and how it is used to make statements about population characteristics based on sample data. It discusses the differences between descriptive and inferential statistics, and how inferential statistics is used for estimation and hypothesis testing. It also explains key concepts like random sampling, sample statistics, population parameters, sampling distributions, sampling error, and how the central limit theorem allows inferring characteristics of the population from a sample as long as the sample size is at least 30.
Data Collection & Analysis Educational Presentation in Pink and Blue Lined St...
This document outlines key concepts around data collection and analysis for middle school science students. It discusses the differences between qualitative and quantitative data, how to calculate mean, median, and mode from data sets, and the different types of graphs used to analyze and visualize data, including bar graphs, line graphs, and pie charts. The document provides examples and checks for understanding to reinforce the concepts.
New Microsoft PowerPoint Presentation.pptx
Data analysis involves inspecting, cleansing, transforming, and modeling data to enhance productivity and business growth. It refers to techniques used to analyze data to derive insights, generate reports, perform market analysis, and improve business strategies. Common data analysis tools include Tableau, Power BI, R, Python, and Apache Spark. Decision science uses quantitative techniques like decision analysis, risk analysis, and simulation modeling to inform decision-making. It is part of fields like operations research, microeconomics, and computer science.
Lecture 2 What is Statistics, Anyway
This document provides an overview of key concepts in statistics, including:
- Statistics is the mathematics of collecting and analyzing data to draw conclusions and make predictions.
- Variables, samples, populations, parameters, and statistics are introduced.
- Descriptive and inferential statistics are discussed, with probability serving as the bridge between the two.
- Common sampling techniques like simple random sampling, stratified sampling, and cluster sampling are described.
- The differences between observational and experimental studies are outlined. Experimental design and potential confounding variables are also covered.
- The importance of ethics in statistics, including protecting human subjects, is emphasized.
Lec 3.pptx
The document discusses different types of data sets that can be analyzed in data science. It describes record, graph and network, ordered, spatial, image and multimedia data. It then discusses key concepts related to data sets including data objects, attributes, attribute types (nominal, binary, numeric), and characteristics of data sets like dimensionality and sparsity. The document also lists some repositories for finding publicly available data sets and outlines strategies for getting data like being provided data, downloading data, or scraping data from the web. Finally, it introduces the topic of data visualization.
Sampling
This document discusses various sampling techniques used in research. It defines key terms like population, sample, census, and sampling frame. It describes probability sampling methods like simple random sampling, systematic sampling, stratified random sampling, cluster sampling, and multi-stage sampling. It also discusses non-probability sampling techniques like judgmental, quota, snowball, and convenience sampling. The document emphasizes the importance of selecting the most appropriate sampling technique based on the research question and having a representative sample.
Introduction to Descriptive Statistics
Lecture on Introduction to Descriptive Statistics - Part 1 and Part 2. These slides were presented during a lecture at the Colombo Institute of Research and Psychology.
Spss (1)
This document provides an overview of using the statistical software package SPSS. It discusses the four main windows in SPSS - the data editor, output viewer, syntax editor, and script window. It also covers the basics of managing data files, including opening SPSS, defining variables, and saving data. Finally, it demonstrates some common analyses in SPSS including frequencies, descriptives, and linear regression as well as how to interpret the outputs and plot regression lines. The overall purpose is to introduce the basics of using SPSS to perform statistical analysis and data management.
Getting Started with R
This document provides an introduction to advanced data analytics using R. It outlines the key steps in an analytics process: [1] understanding the domain; [2] obtaining and cleaning data; [3] reducing, transforming, and visualizing the data; [4] choosing analytical approaches; and [5] communicating results. As a first example, it analyzes a public dataset on ice cream consumption using R commands to summarize, visualize with histograms and boxplots, and explore relationships between variables like income, temperature, and consumption over time. The document demonstrates how to interpret these analyses and leverage additional tools in R to further understand the data.
statics engineering mechanics slides.pdf
This document provides an introduction to key concepts in statistics and experimental design. It defines descriptive and inferential statistics, and explains the difference between populations and samples. Descriptive statistics summarize and organize data, while inferential statistics make generalizations from samples to populations. The document also outlines important aspects of experimental design like control, randomization, replication, and blocking. It discusses different sampling methods and defines terms like experimental units, factors, levels, and treatments in the context of designed experiments.
Organizing data
This document provides information and instructions for organizing and describing data using line plots, measures of central tendency (mean, median, mode), and range. It also discusses how to make different types of graphs and charts, including bar graphs, circle graphs, pictographs, and line graphs. Specific instructions are given for constructing line plots and calculating the mean, median, mode, and range. The purpose is to help students understand how to organize numerical data in a clear way using various visual representations.
MS-EXCEL Assignment Help
The site present the assignment to the students in well- structured manner including all the information in the simplest form, so that students need not spend extra time and effort in completion of the assignment and along with these they can also gain all the content engraved in the brain.
DATA ANALYTICS ASSIGNMENT.pptx
Data analysis involves inspecting, cleansing, transforming, and modeling data to draw conclusions and make predictions that inform decision-making. It includes gathering hidden insights from data, generating reports, and performing market analysis to improve business strategies. Data analytics builds on data analysis by including additional processes like data science and engineering. It allows businesses to gain hidden patterns from customer behavior for more informed decisions, effective marketing, efficient operations, and cost cutting.
PSUnit_IV_Lesson_1_Computing_the_Point_Estimate_of_a_Population_Mean.pptx
This document discusses methods for estimating population parameters from sample data. It defines a point estimate as a specific numerical value of a population parameter, such as using the sample mean to estimate the population mean. An interval estimate provides a range of values that may contain the true population parameter. The document presents examples of how to calculate point estimates of population means by taking the average of sample means from subsets of data.
PSUnit_IV_Lesson_1_Computing_the_Point_Estimate_of_a_Population_Mean.pptx
Computing_the_Point_Estimate_of_a_Population_Mean
L8 scientific visualization of data
Tutorial for beginning graduate students. Basic exploration of multivariate experimental data can be done with freely downloadable software. We also discuss the use of Excel because it is commonly in use.
1628 statistics
This document provides information about statistics and how Dr. John Snow used statistics to identify the source of a cholera outbreak in London in 1840. It explains how Snow mapped deaths from cholera and found they were concentrated around a single water pump, showing the pump was contaminating the water and causing deaths. His use of statistics led to identifying the source of the outbreak and changes that saved thousands of lives. The document then provides definitions and examples of key statistical concepts like mean, median, mode, and frequency tables.
Software fundamentals
The very basics of Software Development Fundamentals. (A prerequisite of learning Object Oriented Programming).
Similar to Analyse Data (20)
Data Collection & Analysis Educational Presentation in Pink and Blue Lined St...
Data Collection & Analysis Educational Presentation in Pink and Blue Lined St...
PSUnit_IV_Lesson_1_Computing_the_Point_Estimate_of_a_Population_Mean.pptx
PSUnit_IV_Lesson_1_Computing_the_Point_Estimate_of_a_Population_Mean.pptx
PSUnit_IV_Lesson_1_Computing_the_Point_Estimate_of_a_Population_Mean.pptx
PSUnit_IV_Lesson_1_Computing_the_Point_Estimate_of_a_Population_Mean.pptx
Recently uploaded
zkStudyClub - LatticeFold: A Lattice-based Folding Scheme and its Application...
Folding is a recent technique for building efficient recursive SNARKs. Several elegant folding protocols have been proposed, such as Nova, Supernova, Hypernova, Protostar, and others. However, all of them rely on an additively homomorphic commitment scheme based on discrete log, and are therefore not post-quantum secure. In this work we present LatticeFold, the first lattice-based folding protocol based on the Module SIS problem. This folding protocol naturally leads to an efficient recursive lattice-based SNARK and an efficient PCD scheme. LatticeFold supports folding low-degree relations, such as R1CS, as well as high-degree relations, such as CCS. The key challenge is to construct a secure folding protocol that works with the Ajtai commitment scheme. The difficulty, is ensuring that extracted witnesses are low norm through many rounds of folding. We present a novel technique using the sumcheck protocol to ensure that extracted witnesses are always low norm no matter how many rounds of folding are used. Our evaluation of the final proof system suggests that it is as performant as Hypernova, while providing post-quantum security.
Paper Link: https://eprint.iacr.org/2024/257
Harnessing the Power of NLP and Knowledge Graphs for Opioid Research
Gursev Pirge, PhD
Senior Data Scientist - JohnSnowLabs
Skybuffer SAM4U tool for SAP license adoption
Manage and optimize your license adoption and consumption with SAM4U, an SAP free customer software asset management tool.
SAM4U, an SAP complimentary software asset management tool for customers, delivers a detailed and well-structured overview of license inventory and usage with a user-friendly interface. We offer a hosted, cost-effective, and performance-optimized SAM4U setup in the Skybuffer Cloud environment. You retain ownership of the system and data, while we manage the ABAP 7.58 infrastructure, ensuring fixed Total Cost of Ownership (TCO) and exceptional services through the SAP Fiori interface.
Mutation Testing for Task-Oriented Chatbots
Conversational agents, or chatbots, are increasingly used to access all sorts of services using natural language. While open-domain chatbots - like ChatGPT - can converse on any topic, task-oriented chatbots - the focus of this paper - are designed for specific tasks, like booking a flight, obtaining customer support, or setting an appointment. Like any other software, task-oriented chatbots need to be properly tested, usually by defining and executing test scenarios (i.e., sequences of user-chatbot interactions). However, there is currently a lack of methods to quantify the completeness and strength of such test scenarios, which can lead to low-quality tests, and hence to buggy chatbots.
To fill this gap, we propose adapting mutation testing (MuT) for task-oriented chatbots. To this end, we introduce a set of mutation operators that emulate faults in chatbot designs, an architecture that enables MuT on chatbots built using heterogeneous technologies, and a practical realisation as an Eclipse plugin. Moreover, we evaluate the applicability, effectiveness and efficiency of our approach on open-source chatbots, with promising results.
Fueling AI with Great Data with Airbyte Webinar
This talk will focus on how to collect data from a variety of sources, leveraging this data for RAG and other GenAI use cases, and finally charting your course to productionalization.
AppSec PNW: Android and iOS Application Security with MobSF
Mobile Security Framework - MobSF is a free and open source automated mobile application security testing environment designed to help security engineers, researchers, developers, and penetration testers to identify security vulnerabilities, malicious behaviours and privacy concerns in mobile applications using static and dynamic analysis. It supports all the popular mobile application binaries and source code formats built for Android and iOS devices. In addition to automated security assessment, it also offers an interactive testing environment to build and execute scenario based test/fuzz cases against the application.
This talk covers:
Using MobSF for static analysis of mobile applications.
Interactive dynamic security assessment of Android and iOS applications.
Solving Mobile app CTF challenges.
Reverse engineering and runtime analysis of Mobile malware.
How to shift left and integrate MobSF/mobsfscan SAST and DAST in your build pipeline.
Leveraging the Graph for Clinical Trials and Standards
Katja Glaß
OpenStudyBuilder Community Manager - Katja Glaß Consulting
Marius Conjeaud
Principal Consultant - Neo4j
HCL Notes and Domino License Cost Reduction in the World of DLAU
Webinar Recording: https://www.panagenda.com/webinars/hcl-notes-and-domino-license-cost-reduction-in-the-world-of-dlau/
The introduction of DLAU and the CCB & CCX licensing model caused quite a stir in the HCL community. As a Notes and Domino customer, you may have faced challenges with unexpected user counts and license costs. You probably have questions on how this new licensing approach works and how to benefit from it. Most importantly, you likely have budget constraints and want to save money where possible. Don’t worry, we can help with all of this!
We’ll show you how to fix common misconfigurations that cause higher-than-expected user counts, and how to identify accounts which you can deactivate to save money. There are also frequent patterns that can cause unnecessary cost, like using a person document instead of a mail-in for shared mailboxes. We’ll provide examples and solutions for those as well. And naturally we’ll explain the new licensing model.
Join HCL Ambassador Marc Thomas in this webinar with a special guest appearance from Franz Walder. It will give you the tools and know-how to stay on top of what is going on with Domino licensing. You will be able lower your cost through an optimized configuration and keep it low going forward.
These topics will be covered
- Reducing license cost by finding and fixing misconfigurations and superfluous accounts
- How do CCB and CCX licenses really work?
- Understanding the DLAU tool and how to best utilize it
- Tips for common problem areas, like team mailboxes, functional/test users, etc
- Practical examples and best practices to implement right away
Essentials of Automations: Exploring Attributes & Automation Parameters
Building automations in FME Flow can save time, money, and help businesses scale by eliminating data silos and providing data to stakeholders in real-time. One essential component to orchestrating complex automations is the use of attributes & automation parameters (both formerly known as “keys”). In fact, it’s unlikely you’ll ever build an Automation without using these components, but what exactly are they?
Attributes & automation parameters enable the automation author to pass data values from one automation component to the next. During this webinar, our FME Flow Specialists will cover leveraging the three types of these output attributes & parameters in FME Flow: Event, Custom, and Automation. As a bonus, they’ll also be making use of the Split-Merge Block functionality.
You’ll leave this webinar with a better understanding of how to maximize the potential of automations by making use of attributes & automation parameters, with the ultimate goal of setting your enterprise integration workflows up on autopilot.
Driving Business Innovation: Latest Generative AI Advancements & Success Story
Are you ready to revolutionize how you handle data? Join us for a webinar where we’ll bring you up to speed with the latest advancements in Generative AI technology and discover how leveraging FME with tools from giants like Google Gemini, Amazon, and Microsoft OpenAI can supercharge your workflow efficiency.
During the hour, we’ll take you through:
Guest Speaker Segment with Hannah Barrington: Dive into the world of dynamic real estate marketing with Hannah, the Marketing Manager at Workspace Group. Hear firsthand how their team generates engaging descriptions for thousands of office units by integrating diverse data sources—from PDF floorplans to web pages—using FME transformers, like OpenAIVisionConnector and AnthropicVisionConnector. This use case will show you how GenAI can streamline content creation for marketing across the board.
Ollama Use Case: Learn how Scenario Specialist Dmitri Bagh has utilized Ollama within FME to input data, create custom models, and enhance security protocols. This segment will include demos to illustrate the full capabilities of FME in AI-driven processes.
Custom AI Models: Discover how to leverage FME to build personalized AI models using your data. Whether it’s populating a model with local data for added security or integrating public AI tools, find out how FME facilitates a versatile and secure approach to AI.
We’ll wrap up with a live Q&A session where you can engage with our experts on your specific use cases, and learn more about optimizing your data workflows with AI.
This webinar is ideal for professionals seeking to harness the power of AI within their data management systems while ensuring high levels of customization and security. Whether you're a novice or an expert, gain actionable insights and strategies to elevate your data processes. Join us to see how FME and AI can revolutionize how you work with data!
Apps Break Data
How information systems are built or acquired puts information, which is what they should be about, in a secondary place. Our language adapted accordingly, and we no longer talk about information systems but applications. Applications evolved in a way to break data into diverse fragments, tightly coupled with applications and expensive to integrate. The result is technical debt, which is re-paid by taking even bigger "loans", resulting in an ever-increasing technical debt. Software engineering and procurement practices work in sync with market forces to maintain this trend. This talk demonstrates how natural this situation is. The question is: can something be done to reverse the trend?
5th LF Energy Power Grid Model Meet-up Slides
5th Power Grid Model Meet-up
It is with great pleasure that we extend to you an invitation to the 5th Power Grid Model Meet-up, scheduled for 6th June 2024. This event will adopt a hybrid format, allowing participants to join us either through an online Mircosoft Teams session or in person at TU/e located at Den Dolech 2, Eindhoven, Netherlands. The meet-up will be hosted by Eindhoven University of Technology (TU/e), a research university specializing in engineering science & technology.
Power Grid Model
The global energy transition is placing new and unprecedented demands on Distribution System Operators (DSOs). Alongside upgrades to grid capacity, processes such as digitization, capacity optimization, and congestion management are becoming vital for delivering reliable services.
Power Grid Model is an open source project from Linux Foundation Energy and provides a calculation engine that is increasingly essential for DSOs. It offers a standards-based foundation enabling real-time power systems analysis, simulations of electrical power grids, and sophisticated what-if analysis. In addition, it enables in-depth studies and analysis of the electrical power grid’s behavior and performance. This comprehensive model incorporates essential factors such as power generation capacity, electrical losses, voltage levels, power flows, and system stability.
Power Grid Model is currently being applied in a wide variety of use cases, including grid planning, expansion, reliability, and congestion studies. It can also help in analyzing the impact of renewable energy integration, assessing the effects of disturbances or faults, and developing strategies for grid control and optimization.
What to expect
For the upcoming meetup we are organizing, we have an exciting lineup of activities planned:
-Insightful presentations covering two practical applications of the Power Grid Model.
-An update on the latest advancements in Power Grid -Model technology during the first and second quarters of 2024.
-An interactive brainstorming session to discuss and propose new feature requests.
-An opportunity to connect with fellow Power Grid Model enthusiasts and users.
June Patch Tuesday
Ivanti’s Patch Tuesday breakdown goes beyond patching your applications and brings you the intelligence and guidance needed to prioritize where to focus your attention first. Catch early analysis on our Ivanti blog, then join industry expert Chris Goettl for the Patch Tuesday Webinar Event. There we’ll do a deep dive into each of the bulletins and give guidance on the risks associated with the newly-identified vulnerabilities.
Astute Business Solutions | Oracle Cloud Partner |
Your goto partner for Oracle Cloud, PeopleSoft, E-Business Suite, and Ellucian Banner. We are a firm specialized in managed services and consulting.
Your One-Stop Shop for Python Success: Top 10 US Python Development Providers
Simplify your search for a reliable Python development partner! This list presents the top 10 trusted US providers offering comprehensive Python development services, ensuring your project's success from conception to completion.
Introduction of Cybersecurity with OSS at Code Europe 2024
I develop the Ruby programming language, RubyGems, and Bundler, which are package managers for Ruby. Today, I will introduce how to enhance the security of your application using open-source software (OSS) examples from Ruby and RubyGems.
The first topic is CVE (Common Vulnerabilities and Exposures). I have published CVEs many times. But what exactly is a CVE? I'll provide a basic understanding of CVEs and explain how to detect and handle vulnerabilities in OSS.
Next, let's discuss package managers. Package managers play a critical role in the OSS ecosystem. I'll explain how to manage library dependencies in your application.
I'll share insights into how the Ruby and RubyGems core team works to keep our ecosystem safe. By the end of this talk, you'll have a better understanding of how to safeguard your code.
Recently uploaded (20)
zkStudyClub - LatticeFold: A Lattice-based Folding Scheme and its Application...
zkStudyClub - LatticeFold: A Lattice-based Folding Scheme and its Application...
Harnessing the Power of NLP and Knowledge Graphs for Opioid Research
Harnessing the Power of NLP and Knowledge Graphs for Opioid Research
AppSec PNW: Android and iOS Application Security with MobSF
AppSec PNW: Android and iOS Application Security with MobSF
Leveraging the Graph for Clinical Trials and Standards
Leveraging the Graph for Clinical Trials and Standards
HCL Notes and Domino License Cost Reduction in the World of DLAU
HCL Notes and Domino License Cost Reduction in the World of DLAU
Essentials of Automations: Exploring Attributes & Automation Parameters
Essentials of Automations: Exploring Attributes & Automation Parameters
Overcoming the PLG Trap: Lessons from Canva's Head of Sales & Head of EMEA Da...
Overcoming the PLG Trap: Lessons from Canva's Head of Sales & Head of EMEA Da...
Driving Business Innovation: Latest Generative AI Advancements & Success Story
Driving Business Innovation: Latest Generative AI Advancements & Success Story
Astute Business Solutions | Oracle Cloud Partner |
Astute Business Solutions | Oracle Cloud Partner |
9 CEO's who hit $100m ARR Share Their Top Growth Tactics Nathan Latka, Founde...
9 CEO's who hit $100m ARR Share Their Top Growth Tactics Nathan Latka, Founde...
Your One-Stop Shop for Python Success: Top 10 US Python Development Providers
Your One-Stop Shop for Python Success: Top 10 US Python Development Providers
Nordic Marketo Engage User Group_June 13_ 2024.pptx
Nordic Marketo Engage User Group_June 13_ 2024.pptx
Introduction of Cybersecurity with OSS at Code Europe 2024
Introduction of Cybersecurity with OSS at Code Europe 2024
Analyse Data
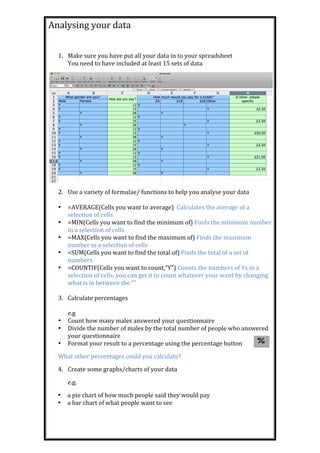
- 1. Analysing your data 1. Make sure you have put all your data in to your spreadsheet You need to have included at least 15 sets of data 2. Use a variety of formulae/ functions to help you analyse your data • =AVERAGE(Cells you want to average) Calculates the average of a selection of cells • =MIN(Cells you want to find the minimum of) Finds the minimum number in a selection of cells • =MAX(Cells you want to find the maximum of) Finds the maximum number in a selection of cells • =SUM(Cells you want to find the total of) Finds the total of a set of numbers • =COUNTIF(Cells you want to count,”Y”) Counts the numbers of Ys in a selection of cells, you can get it to count whatever your want by changing what is in between the “” 3. Calculate percentages e.g • Count how many males answered your questionnaire • Divide the number of males by the total number of people who answered your questionnaire • Format your result to a percentage using the percentage button What other percentages could you calculate? 4. Create some graphs/charts of your data e.g. • a pie chart of how much people said they would pay • a bar chart of what people want to see