
Recommended
More Related Content
Viewers also liked
Viewers also liked (16)
Similar to ALIS VALUE ADDED REPORT SPLUS 2008
Similar to ALIS VALUE ADDED REPORT SPLUS 2008 (20)
ALIS VALUE ADDED REPORT SPLUS 2008
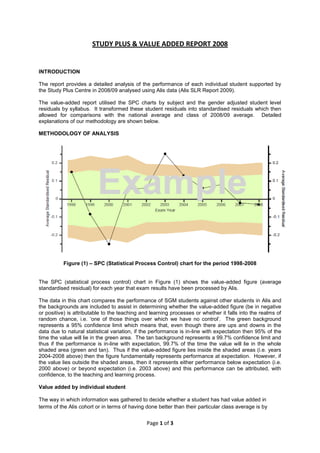
- 1. Page 1 of 3 STUDY PLUS & VALUE ADDED REPORT 2008 INTRODUCTION The report provides a detailed analysis of the performance of each individual student supported by the Study Plus Centre in 2008/09 analysed using Alis data (Alis SLR Report 2009). The value-added report utilised the SPC charts by subject and the gender adjusted student level residuals by syllabus. It transformed these student residuals into standardised residuals which then allowed for comparisons with the national average and class of 2008/09 average. Detailed explanations of our methodology are shown below. METHODOLOGY OF ANALYSIS Figure (1) – SPC (Statistical Process Control) chart for the period 1998-2008 The SPC (statistical process control) chart in Figure (1) shows the value-added figure (average standardised residual) for each year that exam results have been processed by Alis. The data in this chart compares the performance of SGM students against other students in Alis and the backgrounds are included to assist in determining whether the value-added figure (be in negative or positive) is attributable to the teaching and learning processes or whether it falls into the realms of random chance, i.e. ‘one of those things over which we have no control’. The green background represents a 95% confidence limit which means that, even though there are ups and downs in the data due to natural statistical variation, if the performance is in-line with expectation then 95% of the time the value will lie in the green area. The tan background represents a 99.7% confidence limit and thus if the performance is in-line with expectation, 99.7% of the time the value will lie in the whole shaded area (green and tan). Thus if the value-added figure lies inside the shaded areas (i.e. years 2004-2008 above) then the figure fundamentally represents performance at expectation. However, if the value lies outside the shaded areas, then it represents either performance below expectation (i.e. 2000 above) or beyond expectation (i.e. 2003 above) and this performance can be attributed, with confidence, to the teaching and learning process. Value added by individual student The way in which information was gathered to decide whether a student has had value added in terms of the Alis cohort or in terms of having done better than their particular class average is by
- 2. Page 2 of 3 looking at the statistical process control charts for each subject. To show clearly the way is which this works, the methodology will be demonstrated using a student supported by SPLUS in 2008 i.e. Masoud Ali (id #: 20081214). Masoud’s average GCSE score was 6.4 which meant he was predicted to achieve 39.7 UCAS points by the Alis regression model at the end of the year for Mathematics. In fact, he did much better than predicted, and scored 50 UCAS points (an additional 10.3 UCAS points - which after being adjusted for gender worked out to be an additional 9.2 UCAS points). From the gender adjusted residual the standardised residual score was determined to be +0.579 (value-added figure for named student). The SPC chart in Figure (2) for A1-Mathematics shows that a standardised residual of +0.579 lies well outside the Alis 99.7% confidence limits and above the 2009 SGM class figure. This would indicate that the standardised residual for the said individual student is beyond expectation and can be attributed confidently to the teaching and learning process outside of the Mathematics department e.g. in Study Plus. Figure (2) – SPC chart for A1-Mathematics for the period 2002-2009 STANDARDISED RESIDUALS FOR EACH SPLUS SUPPORTED STUDENT The standardised residuals for each student supported by SPLUS in 2008/09 are attached as an appendix to this report. This is the Average standardised residual for AS Mathematics in 2009. It is below the value added figure for Masoud Ali (+0.579) and hence in relation to his peers, Masoud did significantly better, which can be attributed to factors external to the classroom e.g. study plus support.
- 3. Page 3 of 3 VALUE ADDED CHARTS Figure (3) – Chart showing the proportion of A2 supported students whose standardised residual score was above their class average. Figure (4) - Chart showing the proportion of AS supported students whose standardised residual score was above their class average. Figures (3) and (4) show the percentage of AS and A2 supported students in 2008 who had a statistically significant value added rating. The charts are fairly similar to each other (proportionally), however the AS students exhibited +4% more value-added compared to their A2 supported colleagues. Approximately 40% of all supported students received no significant statistical value added rating, however, that does not mean the support received by them was of no value. For the first time we have been able to quantify the work of the Study Plus centre statistically, and the results look very positive indeed! 56% 44% Value Added - for A2 Supported students Significant Value Added No Significant Value added 60% 40% Value Added - for AS Supported students Significant Value Added No Significant Value added