
Recommended
Recommended
More Related Content
Similar to Discussion QuestionAre Americans becoming ruder in their inter.docx
Similar to Discussion QuestionAre Americans becoming ruder in their inter.docx (14)
More from elinoraudley582231
More from elinoraudley582231 (20)
Recently uploaded
Recently uploaded (20)
Discussion QuestionAre Americans becoming ruder in their inter.docx
- 1. Discussion Question Are Americans becoming ruder in their interactions with one another in the business environment? Explain and document your reasoning using scholarly and peer reviewed journal articles and/or texts. 350 words APA Format Page 221 Academy of Educational Leadership Journal, Volume 18, Number 4, 2014 USING EXCELS PIVOT TABLE FUNCTION FOR VISUAL DATA ANALYSIS OF EXAM RESULTS: A SUPPLEMENTAL PROCEDURE TO CLASSICAL TEST THEORY Robert D. Slater, University of North Florida Mary Beal-Hodges, University of North Florida Anita Reed, Texas A&M University Corpus Christi
- 2. ABSTRACT This paper demonstrates how Excel’s Pivot Table Function can be used to visually examine electronic exam results. Pivot tables allow users to visually analyze data such as exam results effectively and efficiently. The paper provides a short discussion of Classical Test Theory statistics such as Item Difficulty and Item Discrimination. Examples are then presented where exam questions seemed to perform poorly when analyzed using only the statistical measurements. When the same examples are explored using visual analysis from Excel’s Pivot Table as a supplement to the statistical methods the results are better understand. Keywords: Item Analysis, Assessment, Pivot-Table, Item Discrimination, Item Difficulty, Classical Test Theory INTRODUCTION In this paper a graphical method of analyzing exam question results using Excel’s Pivot Table function is proposed. We argue that visual analysis of exam data should be used as a supplement to the traditional statistical approaches of item analysis. Performing detailed item analyses on exam question responses allows instructors to understand not only how well students are grasping the material on the exam as a whole but also to understand how well each question is measuring the student’s knowledge. However, as Crisp &
- 3. Palmer (2007) and Vyas & Supe (2008) point out, many instructors are not specialists in educational theory or the discipline of assessment and are limited in the statistical training needed to analyze assessment results. Therefore, it is common practice for many instructors to create an exam, grade it, report the students’ scores and then give the exam no further thought. In other words, validation of exams and their results tend to be based around ‘academic acumen rather than quantitative evidence’ (Crisp & Palmer, 2007; Knight, 2006; Price, 2005). Even when exam item analyses are conducted often times the Page 222 Academy of Educational Leadership Journal, Volume 18, Number 4, 2014 measures may be misunderstood. Course management systems such as Blackboard now offer exam item analysis measures such as Item Discrimination and Item Difficulty. These measures can easily be misinterpreted if instructors are not aware of how they are calculated and their sensitivity to the data being measured. Graphically analyzing electronic exam results gives instructors a method to cross-validate traditional quantitative analyses. Ackerman (1996) illustrated how graphical analyses enhanced interpretations of item responses. Performing an analysis of exam results using Excel’s Pivot Table function allows professors to evaluate each question’s overall effectiveness and to identify
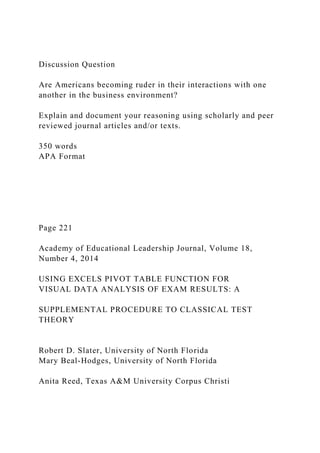
- 4. questions where students have performed poorly. The graphical results provided by the pivot table provides an opportunity for instructors to recognize those questions that might need to be revised or thrown out or that need further review before being used in future assessments. The pivot table simultaneously presents students’ overall performance on the test, question performance, and the student performance on each test question. This visual exam analysis is intended to complement the traditional quantitative item statistics provided by Blackboard and/or other standard electronic exam result analysis software. PIVOT TABLES FOR DATA VISUALIZATION ANALYSIS In this paper we propose using a pivot table and conditional formatting to conduct an exam item analysis graphically. A pivot table is a data visualization tool that is included in most spreadsheet programs such as Microsoft Excel. Pivot tables allow for multidimensional representation of data as can be seen in Figure 1 below. Figure 1 demonstrates the analysis of exam data. The itemized data was downloaded from Blackboard into an Excel spreadsheet. In Figure 1, each student is represented by a row in the table and each question from the exam is represented by a column in the table. Each student’s performance on a particular question can be found at the intersection of each column and row. In the example below, each question was worth two points and any student who answered the question correctly would have a “2” at the intersection of the column and row corresponding with that
- 5. student’s identification number. Pivot tables allow users to select, view, and sort a large amount of data in a short period of time. In Figure 1 below, the data has been sorted by both student performance on the exam and by question performance. As can be seen on the right hand side of Figure 1, students who performed poorly on the exam appear near the top of the table and students who performed well on the exam appear on the bottom of the table. The student grades on this exam ranged from a low of 42 to a high of 96. At the bottom of Figure 1 is the total score of each question. This score represents the students who answered this question correctly with higher values representing easier questions. The question performance has been sorted from high to low with easy questions presented on the left hand side of the chart and more difficult questions presented on the right hand side of the chart. At the top left of Figure 1, a Report Filter has been used. Excel’s Pivot Table function includes the report filter which allows the data in the table to be filtered by user based criteria. In Page 223 Academy of Educational Leadership Journal, Volume 18, Number 4, 2014 this example, each question has been assigned to a category based on the particular construct the question is measuring. The current configuration for Figure 1 is showing all of the constructs in the exam. Several columns have been hidden in Figure 1 to
- 6. enhance the quality of the image. Conditional formatting is another data analysis visualization tool that is available in Microsoft Excel. The benefits of conditional formatting have been demonstrated in this pivot table analysis. In Figure 1 below, conditional formatting has been used to highlight any value in the pivot table which equals zero. By using conditional formatting the instructor can easily see not only missed questions, but the patterns that have developed for particular questions and the exam overall. Figure 1: Pivot Table showing exam item analysis In Figure 1, it is also easy to quickly identify the questions that are easy and the questions that are difficult. The two most difficult questions appear to be questions 47 and 49. One interesting observation is that the two highest performing students on the exam both missed these questions. Another pattern that can be seen is that for the most part students who answered one of the questions correctly also answered the other question correctly as can be seen by the non-red values Page 224 Academy of Educational Leadership Journal, Volume 18, Number 4, 2014 that appear paired in the diagram. Further, question 14 is the
- 7. third most difficult question and was answered correctly by most of the students who performed well on the test overall. The visual analysis of the pivot table can supplement traditional statistical analysis. Many of the statistical measures are subject to false positive outcomes indicating problematic exam questions that need further review. This paper provides specific examples where statistical measures indicate there may be problems with particular exam questions and the visual analysis (pivot table) provides a better understanding of the items responses. The visual analysis may also help to eliminate questions that need to be thrown out. Identifying poorly worded questions before an exam is reviewed with students in class can save classroom time and instructor effort. For some professors, the first time they realize a question is poorly worded is only after students publically bring a flawed question to their attention. STATISTICAL MEASURES FOR ITEM ANALYSIS Classical Test Theory (CTT) comprises a set of concepts and methods that provides a basis for many of the measurement tools and statistics that are commonly used by higher education instructors to both construct and evaluate exams. Around since the early 20th century, CTT is the easiest and most widely used form of analysis. In recent decades attention has turned to Item Response Theory which examines how test performance relates to the underlying abilities that are measured by the items in the test (Hambleton and Jones, 1993). Item Response Theory, as the
- 8. name implies, tends to focus on item-level performance. It has very stringent assumptions such as the fact that the set of items that compose the test measure a single common trait or ability. However, CTT forms the basis of the item analysis provided in Blackboard and in other popular item analysis software such as Softscore or ScorePak. The popularity of CTT is partly due to the relatively weak statistical assumptions needed to run analyses combined with simple mathematical procedures. Most procedures in CTT analysis focus on the test as a whole (mean, standard deviation, etc.) rather than on the individual questions. However, important item-level statistics such as difficulty and discrimination can still be calculated as part of Classical Theory. Additional detail about the mathematical and theoretical components of Classical Test Theory can be found in a variety of books and articles including Baker (1997); Crocker et. al (1986); Fan (1998); and Hambleton & Jones (1993). Blackboard uses both Item Difficulty and Item Discrimination measures in the Item Analysis function. While these measures are helpful in understanding question performance, both measures have limitations which may be seen quite clearly using a visual analysis of the exam results (such as in a pivot table). Next, Item Difficulty and Item Discrimination will be discussed and it will be illustrated how a visual tool such as a pivot table can supplement an exam analysis using these two measures. Item Difficulty is a measure used to show the percentage of students who answered a particular question correctly (for items with one correct
- 9. alternative). Item Difficulty is reported on Page 225 Academy of Educational Leadership Journal, Volume 18, Number 4, 2014 a range from 0 to 100% whereby higher item difficulty percentages represent easier questions. According to Lord (1952) desirable difficulty levels are slightly higher than midway between chance (arriving at correct choice by guessing) and perfect scores for the item. Figure 2 below represents Lord’s (1952) desirable difficulty levels based on the question format: Figure 2: Question Format and Ideal Item Difficulty Question Format Ideal Difficulty Five-response multiple choice 70 Four-response multiple choice 74 Three-response multiple choice 77 True-false 85 Blackboard arbitrarily classifies questions with percentages greater than 80% as “Easy” and less than 30% as “Hard” and flags these questions for review. Questions where students have performed poorly may fall into one of several categories: 1) incorrectly keyed answers, 2) confusing text, 3) content that was not covered during class, or 4) higher level questions. By only looking at a measurement like
- 10. the percentage of students who answered a question correctly, professors may accidently throw out higher level questions. Using Excel’s Pivot Table function to visually analyze the exam results allows instructors to visually identify and categorize these questions. For example, question 14 in Figure 1, was given an Item Difficulty of 29.2% which according to Lord would be much lower than ideal. Question 14 would also be flagged by Blackboard for further review since the Item Difficulty was lower than 30%. Based on the visual analysis presented by the pivot table it can be seen that most of the students who received an “A” on the exam answered this question correctly. This question may be a valid question that tests higher level constructs than the other questions. However, the analysis reveals that two students who performed poorly on the overall exam still received credit for this question. Whether these two poorly performing students actually knew the material being tested in the question and received credit from “informed guessing” or if their correct responses were a function of “statistical guessing” cannot be determined from either Item Difficulty or Visual Analysis (Burton 2001). Another statistical method common in Classical Test Theory and also presented by Blackboard is Item Discrimination. Item Discrimination refers to the ability of a question to differentiate among students on the basis of how well each student knows the overall material being tested. Item Discrimination is a measure of the degree to which students with high overall exam scores also answered a particular question correctly. A question is a good discriminator when
- 11. students who answer the question correctly also do well on the test. One common item discrimination index is a point biserial correlation coefficient between students’ responses to a particular question and total scores on all other questions on the test. However, a discrimination value cannot be calculated when the question’s difficulty is 100% or when all students receive the same score on a question (Blackboard Learn). Point biserial values can range from -1.0 to +1.0. Page 226 Academy of Educational Leadership Journal, Volume 18, Number 4, 2014 Questions with discrimination values above 0.3 are arbitrarily classified as “Good”; between 0.1 and 0.3 as “Fair”; and those less than 0.1 are considered “Poor” and flagged for review by Blackboard. The visual analysis from the pivot table can help with the review of items which scored low on the point biserial scale. For example in Figure 1, question 46 scored a .056 point biserial rating in Blackboard, suggesting that further review is required. In the pivot table it is shown that 20 out of 24 students answered this question correctly. A couple of students with lower overall exam grades missed this question while students with even lower overall grades answered the question correctly. This type of pattern heavily influences the point biserial statistic but visually shows that there is nothing wrong with the question. The four
- 12. students who missed this question may have just marked the wrong response on their exam or they may not have studied that particular construct being tested. One problem with item discrimination methods such as the point biserial statistic is that the calculation assumes that an individual question is measuring the same construct as the rest of the questions on a particular test. In higher education, exams often have questions from multiple chapters that cover different constructs. So, a question with a low or negative discrimination index (point biserial value) might indicate a concept that is covered sparingly throughout the exam. In other words a student could do very well on this construct but still score poorly on the overall exam. There would be nothing inherently wrong with the question but statistical tests may flag the question for review. The report filter in the pivot table can help with this type of item classification and analysis. An example using the Report Filter function is demonstrated in Figure 3 below. In Figure 3, the report has been filtered by each question’s category. In this filtered report, only questions measuring students’ knowledge of the REA Diagraming construct have been included. Below the pivot table the Item Difficulty and Item Discrimination statistics are presented. The Item Difficulty rating is question specific and does not change when the report is filtered. However, the point biserial (item discrimination) may be recalculated for this subset of questions to see how well each question measures the construct being tested. In the example in Figure 3, questions 47 and 49 which were the most difficult questions on the overall exam (as reported in
- 13. Figure 1 for all question categories) are still the most difficult question for the REA Diagraming category. The visual analysis also clearly highlights that these two questions are pretty good “higher level” questions. That is, these questions can discriminate between high performing students and lower performing students for questions in the category REA Diagraming. A comparison of the Item Discrimination measure for how well these questions correlate with students overall exam scores (Original Discrimination) versus how well these questions correlate with the overall score of just questions in the REA Diagraming category (Revised Discrimination) shows a significant difference. In the Original Discrimination results there were three questions (31, 47, and 49) that seemed to test only fair when compared with the overall exam scores. The Revised Discrimination results show that these three questions actually correlate very well with the total scores for the just the category of REA Diagraming. Page 227 Academy of Educational Leadership Journal, Volume 18, Number 4, 2014 Figure 3: Pivot Table Using Report Filter to Show Only Questions Measuring a Particular Construct (REA Diagraming).
- 14. Page 228 Academy of Educational Leadership Journal, Volume 18, Number 4, 2014 SUMMARY In this paper we have demonstrated that a visual analysis of exam results using Excel’s Pivot Table Function can supplement traditional Classical Test Theory measures such as Item Difficulty and Item Discrimination. Examples were provided for both Item Difficulty and Item Discrimination where the calculated statistics indicated further analysis of exam questions would be needed. It was demonstrated how the visual analysis in Excel’s Pivot Table could easily show that questions with high item difficulty measures may be valid questions that were only answered correctly by the students who performed better on the exam. The sensitivity of Item Discrimination measures such as the point biserial statistic to small anomalies in the exam data was also illustrated. For instance, when students who performed poorly on an exam answered questions correctly, they heavily influenced the Item Discrimination measure. Visualization analysis of the questions indicated that these students performance on the question being examined may be caused by random guessing rather than informed guessing (Burton 2001). It was also demonstrated how violations to a required
- 15. assumption of the point biserial measure may impact the measurements effectiveness. When multiple constructs are being measured in a single exam the results of the point biserial statistic may not be applicable to the exam as a whole. Using the report filter function in the pivot table allows the user to view questions from the exam based on the question’s category. Viewing the questions by a single category allowed for a re-calculation of the point biserial measurement to examine how well each question correlated to the other measures of a single category. Page 229 Academy of Educational Leadership Journal, Volume 18, Number 4, 2014 REFERENCES Al Muhaidib, Nouriya Saab. 2010. “Types of Item-Writing Flaws in Multiple Choice Question Pattern—A Comparative Study.” Journal of Educational & Psychological Sciences 10-44. Ackerman, T. 1996. “Graphical Representation of Multidimensional Item Response Theory Analyses”, Applied Psychological Measurement, 20(4). Baker, R. 1997, “Classical Test Theory and Item Response Theory in Test Analysis.” Blackboard Learn 2013. “Running Item Analysis on a Test.” https://help.blackboard.com/en-
- 16. us/Learn/9.1_SP_10_and_SP_11/Instructor/070_Tests_Surveys_ Pools/112_Running_Item_Analysis_on_a_ Test accessed September 8, 2013. Burton, R. F. 2001. “Quantifying the Effects of Chance in Multiple Choice and True/False Tests: question selection and guessing of answers.” Assessment & Evaluation in Higher Education, 26(1), 41-50. Crisp, G. T. And E. J. Palmer. 2007. Engaging Academics with A Simplified Analysis of Their Multiple-Choice Questions (MCQ) Assessment Results.” Journal of University Teaching & Learning Practice. 4(2):88-106. Crocker, Linda and James Algina. 1986. Introduction to Classical and Modern Test Theory. Holt, Rinehart, and Winston., Orlando, Florida. De Champlain, Andre F. 2010. “A primer on classical test theory and item response theory for assessments in medical education.” Medical Education. 44(1): 109-117. Fan, Xitao. 1998. “Item Response Theory and Classical test theory: an empirical comparison of their item/person statistics.” Educational and Psychological Measurement 58(3): 357-382. Hambleton, Ronald and Russell W. Jones. 1993. “An NCME Instructional Module on Comparison of Classical Test Theory and Item Response Theory and Their Applications to Test Development.” Educational Measurement: Issues and Practice. 12(3): 38-47. Hambleton, Ronald and Hariharan Swaminathan and H. Jane Rogers. 1991. Fundamentals of Item Response Theory.
- 17. Sage Publications Inc. Newbury Park, London, New Delhi. Kline, Theresa J.B. 2005. Psychological Testing: A Practical Approach to Design and Evaluation. Sage Publications, Inc. Thousand Oaks, London, New Delhi. 91-165. Knight, P. 2006. “The Local Practices of Assessment.” Assessment & Evaluation in Higher Education. 31(4): 435- 452. Lord, F.M. 1952. “The Relationship of the Reliability of Multiple-Choice Test to the Distribution of Item Difficulties.” Psychometrika, 18: 181-194. Price, M. 2005. “Assessment Standards: The Role of Communities of Practice and the Scholarship of Assessment. Assessment & Evaluation in Higher Education. 30(3): 215-230. Vyas, R and A Supe. 2008. “Multiple Choice Questions: A Literature Review on the Optimal Number of Options.” The National Medical Journal of India. 21(3), 130-133. Weiss, David and Michael E. Yoes. 1991. “Item Response Theory.” Advances in Educational and Psychological Testing: Theory and Applications. Kluwer Academic/Plenum Publishers New York: New York. 69-95. Reproduced with permission of the copyright owner. Further reproduction prohibited without permission.
- 18. There’s a powerful summary feature in Excel called a pivot table. This feature cross tabulates data using column and row categories. The tabulation can be done for totals, counts, or averages. This is such a useful feature of Excel that people often ask me how to do pivot tables in Access. There are two ways that you can do similar cross tabulation work with your data in Access. You can create a pivot table view for a select query, or you can create a crosstab query. You also can create a pivot chart view of the select query if you want to graph your data. Pivot Table Query View Create a select query, and include the fields that you want to use for the
- 19. columns and row headings and the value field to summarize for your pivot. Then select PivotTable View from the View but- ton on the Design ribbon (see Figure 1). Drag your row, column, and value fields to the appropriate places, similar to creating a pivot table in Excel. You can print a pivot table or e-mail it as an attachment in various file formats. You can also export the pivot table data in various file formats such as .XLS or .TXT. Pivot Chart Query View You can also turn your data into a pivot chart by creating a select query that includes the fields you want to chart. Change the view to PivotChart View on the Design ribbon. Then, as when creat- ing a pivot chart in Excel, drag the filter,
- 20. data, category, and series fields to the appropriate places. Use the tools on the Design ribbon to customize the chart. Right-click areas of the chart and choose Properties to cus- tomize the titles, scale, or font. Right-click and choose Change Chart Type to change the chart to a pie, line, bar chart, etc. You can easily print a pivot chart as well as e- mail it, though the underlying pivot table data will be sent, not the actual chart. Crosstab Queries Another way to cross tabulate your data is to design a crosstab query. To start, create a new query, and add the tables with the data you want to summarize. In the Query Type section of the Design ribbon, click Crosstab. This will add two new lines to the Query by Example
- 21. design grid: Total and Crosstab will appear between the Table and Sort lines. To indicate the row and column headings, go to the appropriate field in the Query by Example grid and select Group By on the Title line and Row Heading, or Column Heading, in the Crosstab line. Often, column headings are years or other time frames. Usually there’s only one column heading select- ed. For the field that contains the data you want to summarize, select Value for TECHNOLOGY ACCESS Cross Tabulate Your Data By Patricia Cox 5 2 S T R AT E G I C F I N A N C E I O c t o b e r 2 0 0 9 Figure 1: Selecting PivotChart
- 22. or PivotTable View the Crosstab line and Sum or Count (or another appropriate choice) for the Total line. Figure 2 is an example that will cross tabulate data for extended sales by State and Product Category. When you’re ready to see the cross tabulated data, run the query. Hints and Cautions Here are several things to keep in mind when using these processes: You can filter or sort row or column contents by clicking the dropdowns on the screen (see Figure 3). If there is a null value in a column heading field,
- 23. the query will give you an error message when you run it. To resolve this, make sure all the values for the fields are entered or add Is Not Null to the criteria line for this field. If you create a report from a crosstab query and the column headings later change, you may have to adjust the report as time goes by to reflect these changes. The report won’t update the fields automatically when they change. When you save a query and reopen it, you may find that Access has reor- ganized your fields a bit. This is because when Access saves a query, it’s actually saving the SQL code
- 24. behind the query. When the query is reopened in design view, Access rebuilds the query from the SQL code. If you want to see what the SQL code looks like, you can select SQL View from the View tab on the Design ribbon. Finally, you can export a report as a snapshot to save a copy of it outside of Access. Next month we’ll look at make-table queries and discuss when to use them and when to avoid them. SF Patricia Cox has taught Excel and Access to management account- ing students at Alverno College in Milwaukee, Wisc., and has consulted
- 25. with local area businesses to create database reporting systems since 1998. She is a member of IMA’s Greater Milwau- kee Chapter. To send Patricia a question to address in the Access column, e-mail her at [email protected] O c t o b e r 2 0 0 9 I S T R AT E G I C F I N A N C E 5 3 Figure 3: Figure 2: Crosstab Query Example Reproduced with permission of the copyright owner. Further reproduction prohibited without permission.