
Recommended
Recommended
More Related Content
Similar to Determinants of Economic growth in a panel of Asean and developing countries.pdf
Similar to Determinants of Economic growth in a panel of Asean and developing countries.pdf (20)
More from HanaTiti
More from HanaTiti (20)
Recently uploaded
Recently uploaded (20)
Determinants of Economic growth in a panel of Asean and developing countries.pdf
- 1. UNIVERSITY OF ECONOMICS HO CHI MINH CITY VIET NAM INSTITUTE OF SOCIAL STUDIES THE HAGUE THE NETHERLANDS VIET NAM –THE NETHERLANDS PROGRAMME FOR MASTER OF DEVELOPMENT ECONOMICS ---------------------------------- DETERMINANTS OF ECONOMIC GROWTH IN A PANEL OF ASIA PACIFIC COUNTRIES FINAL THESIS Supervisor: Nguyen Hoang Bao Student: Tran Luu Quoc Vuong Class: MDE-16 ---------------------------------------------- HO CHI MINH CITY, DECEMBER 2013
- 2. APPENDICES A: List of chosen countries and territories in Asia Pacific Region 51 B: Scatterplot matrix of variables 52 C: Tests 53 LIST OF FIGURES Figure 3.1. Conceptual framework of the study 14 Figure 4.1. Growth rate versus Level of Per capita GDP (simple relation) 27 LIST OF TABLES Table 3.1 Summary of variables 20 Table 4.1. Summary Statistic on the sample observations 29 Table 4.2. Correlation on the sample observations 30 Table 4.3. Basic Cross-Country Growth Regression 31 Table 4.4. Heteroskedasticity – White test 32 Table 4.5. Basic Cross-Country Growth Regression (robust) 33 Table 4.6. Multicollinearity testing 34 Table 4.7. Restricted Model (1) 35 Table 4.8. Restricted Model (2) 36 Table 4.9. Model Comparison 37 Table 4.10. Extended models 43
- 3. ABBREVIATIONS IMF : International Monetary Fund WB : World Bank UN : United Nations GDP : Gross Domestic Products GNP : Gross National Products R&D : Research and Development OECD : The Organization for Economic Co-operation and Development
- 4. Table of Contents 1. CHAPTER 1: INTRODUCTION ..........................................................................2 1.1. Problem statement......................................................................................................... 2 1.2. Objectives of study........................................................................................................ 3 1.3. Research questions........................................................................................................ 4 1.4. Scope of the research .................................................................................................... 4 1.5. Structure of the thesis.................................................................................................... 4 2. CHAPTER 2: THEORETICAL AND EMPIRICAL BACKGROUND..................6 2.1. Theoretical background:................................................................................................ 6 2.2. Empirical review ........................................................................................................... 9 2.3. Summary ..................................................................................................................... 12 3. CHAPTER 3: RESEARCH METHODOLOGY ..................................................13 3.1. Conceptual framework................................................................................................ 13 3.2. Variables ..................................................................................................................... 14 3.2.1 Dependent variables............................................................................................ 14 3.2.2 Explanatory variables.......................................................................................... 15 3.3. Data ............................................................................................................................. 22 3.4. Econometric model ..................................................................................................... 22 3.5. Summary ..................................................................................................................... 24 4. CHAPTER 4: DATA ANALYSIS.......................................................................26 4.1. Growth rate and convergence...................................................................................... 26 4.2. Descriptive analysis .................................................................................................... 27 4.3. Regression Results for Growth rates........................................................................... 30 4.3.1 Basic Regression ................................................................................................. 30 4.3.2 Hypothesis tests................................................................................................... 32 4.3.3 The Determinants of Growth rate........................................................................ 39 4.3.4 The extended models........................................................................................... 42 4.4. Summary ..................................................................................................................... 44
- 5. Determinants of economic growth in a panel of Asia Pacific countries Thesis Proposal Tran Luu Quoc Vuong – MDEk16 1 5. CHAPTER 5: CONCLUSION AND POLICY IMPLICATIONS ........................45 5.1. Main findings and policy implications........................................................................ 45 5.2. Limitation of the research and Recommendation for further studies.......................... 45 6. REFERENCES.....................................................................................................48
- 6. Determinants of economic growth in a panel of Asia Pacific countries Thesis Proposal Tran Luu Quoc Vuong – MDEk16 2 1. CHAPTER 1: INTRODUCTION 1.1.Problem statement Nowadays, there are over 200 countries on over the world with different institutions, with different growth rates. These growth rates vary hugely across countries and between developing countries to developed countries. According to recent surveys of many international organizations (IMF, WB, UN and so on), de- veloping countries and economies in transition continue to register much stronger growth than developed economies. After the end of the World War II, the world started to recover economic and the growth became an important part of economic science. Economists have tried to apply other theories with a lot of empirical model to understand the process of economic growth and explain enormous differences in economic performance across countries. In the early, economists used Keynesian theories to discuss about the stability of the growth path. Next, they focused on steady state growth rates exogenously determined by technological progress. After that, Solow (1956) and Swan (1956) became the pioneers who enriched neoclassical economic growth model, and followed by a lot of others. From 1980s, economists developed growth theory, which use endogenous economic growth model to evaluate the roles of knowledge, innovation and human capital. Improvements of economic theories and hundreds of researches have pro- vided acceptable explanation for a particular phenomenon of recent decades: the great divergence in economic performance. But, indeed, the income of underde- veloped economies, as a whole, are failing to catch up the income of the developed countries. Realizing this inadequacy, economic growth studies have shifted their focus to find out the reason of this problems. There were a lot of researches discuss about this problem, such as: Solow (2000), Aghion and Howitt (1998), Kenny and Williams (2001), Temple (1999),
- 7. Determinants of economic growth in a panel of Asia Pacific countries Thesis Proposal Tran Luu Quoc Vuong – MDEk16 3 Bosworth and Collins (2003) and Rogers (2003). They identified main contribu- tions to the recent growth literature, especially relevant institution factors. The main objects these economists aimed were developing countries in the Asian Pa- cific area. They wanted to understand how recent developments in the growth lit- erature contribute to economic development of Asian Pacific countries. In this study, the research examine the relationship between per capita growth rate to a set of quantifiable explanatory variables with a conditional con- vergence term: the growth rate rise when the initial level of real per capita GDP is low relative to the staring human capital and for given values of other policies, institutions and national characteristic variables. This research will use panel data of 25 countries and territories of Asian Pacific region for the period of 1990 - 2010. This study use panel data approach and apply three-stage less squared re- gression to examine the determinants of the growth rate. The regression, which uses panel data, has many advantages with regards to typical cross-country regres- sion that was advanced by Raftery (1995), Sala-i-Martin et al. (2004). First, using panel data, we will eliminate constraint by limited number of countries available. Second, this method allows addressing the inconsistency of empirical estimates. This inconsistency appears with omitted country-specific effects correlated with other regressors, or with endogenous variables which assumed to be exogenous. 1.2.Objectives of study This research will examine the relationship between per capita growth rate and a set of quantifiable explanatory variables: human capital (education and health), policies, institution and national characteristics. From empirical studies, for given initial levels of state variables (including physical and human capital), the economic growth rates have positive relation to the rule of law, the investment ratio and negative relation to the fertility rate, the ratio of government consumption to GDP and the inflation rate. In the case of the terms of trade and the extent of
- 8. Determinants of economic growth in a panel of Asia Pacific countries Thesis Proposal Tran Luu Quoc Vuong – MDEk16 4 international openness, with fair movements, the growth will increase but the latter effect is surprisingly weak. The research will define which factors affect to the growth rate of Asian Pacific developing countries, including Vietnam. It also extend to evaluate some special countries, which have huge population size, such as: China, India; or de- veloped countries, such as Japan, Australia, Singapore and so on 1.3.Research questions This research aims at answering the following questions: The relationship between per capita growth rate and a set of quantifiable explanatory variables? Which variables are significant ones to economic growth? Intensity of impact of these factors to economic growth of the Asia Pacific region? 1.4.Scope of the research The research focuses on examine the convergence hypothesis implies that the growth rate of real per capita GDP would tend to be inversely related to the level of initial real per capita GDP, and the role of a set quantifiable explanatory variables. The chosen countries are 25 countries in Asian Pacific region, and some special countries which have huge population size (China, India) or specific char- acteristics (Japan, Singapore). This research only examines in the period of 1985 - 2010 because lacking of GDP data before 1980 for all countries in this region. 1.5.Structure of the thesis The research will be organized with five chapters. The chapter one has structure as above: explain the reason why we choose this topic, identify the prob- lems that the research need to examine with some major research questions and the scope of the research. The rest of this research has four chapters. Chapter two
- 9. Determinants of economic growth in a panel of Asia Pacific countries Thesis Proposal Tran Luu Quoc Vuong – MDEk16 5 shows a brief view of theoretical background of growth model, from the neoclas- sical growth models to the endogenous growth models, and the role of trade and institutions on the growth rate as well. A review of empirical studies makes clearly about results of different models when applying to explain recent developments. In chapter three, we will highlight the research methodology, including con- ceptual framework and variable descriptions. We will have a briefly discussion about the reason why we choose these variables, how to enter them into the equa- tions after introducing the general econometrics model. Besides, the process out- line which we use to analyze data, is also mentioned in this chapter. Chapter four will show the regression results of the models. We will analyze and get findings to answer the questions in the chapter 1. We also compare findings to results of other empirical studies. And at chapter five, we resumes main findings and reevaluate factors which have significant influence to growth rate of an economy. This chap- ter also identifies the limitation and implications for further study.
- 10. Determinants of economic growth in a panel of Asia Pacific countries Thesis Proposal Tran Luu Quoc Vuong – MDEk16 6 2. CHAPTER 2: THEORETICAL AND EMPIRICAL BACKGROUND 2.1.Theoretical background: In the 1950s, growth theory was composed mainly of the neoclassical model, developed by Ramsey (1928), Solow (1956), Swan (1956), Cass (1965) and Koopmans (1965). One feature of this model is the convergence property with the characteristic of diminishing returns to capita in a closed economy, where tech- nological progress is assumed to be exogenous and there are same technical op- portunities across countries. This theory said that, the predicted growth rate will higher with the lower starting level of real per capita gross domestic product. If all economies were naturally the same, except for their starting capital intensities, the convergence would apply in an absolute sense; it means that, poorer economies typically grow faster per capita and tend thereby to catch up to the richer economies. However, if they differ from a lot of factors, such as rate of birth, willingness to work, technology accessing, government policies, the convergence force applies only in a conditional sense. The predicted growth rate will be higher if the starting level of per capita GDP is low in relation to its long–run (steady state) position. For example, a poor country would not tend to grow rapidly if it also has a low long–term position which possibly because its public policies are unfavorable or its saving rate is low. But along the time has been changing, this model showed its own limitation. So, a new wave rose in economic growth theory. Growth theorists of 1960s as- sumed that technological progress is exogenous to the growth rate, will make the economy temporarily grows in short term but not in long term. But, unfortunately, while endogenous factors, like as the saving rate and population growth, determine the steady state or ceteris paribus of an economy, the technological progress de- cides the growth rate of the steady state. Thus, we can use model of growth to explain everything but long-run growth.
- 11. Determinants of economic growth in a panel of Asia Pacific countries Thesis Proposal Tran Luu Quoc Vuong – MDEk16 7 And as a consequence, since the 1980s, the economic growth theory had a new sense. Several variables treated as exogenous before became endogenous. The Ramsey-Cass-Koopmans model endogenized the savings rate, and in conse- quence, the saving rate may not be constant along the transition to the long run steady state. Other different assumptions, fertility was treated as endogenous in researches of Galor and Weil (1996), Cigno and Rosati (1996) and Barro and Becker (1989). Besides, in Solow – Swan model, the explicit consideration of hu- man capital was not mentioned, and this absence motivated work on endogenous growth theory and a series of idea-based model. In the mid-1980s, a group of growth theorists dismissed the Solow-Swan model because they did not satisfied with common accounts of exogenous factors determining long-run growth. They were interested in the endogenous growth model that assumes constant and increasing returns of capital and replace the ex- ogenous growth variable with explicit key determinants. The researches were done by Paul Romer (1986), Lucas (1988) and Rebelo (1991) are initial researches of the new wave. Instead of technological change, growth in these models was caused by indefinite investment in human capital in the forms of education, experience, and health and reduced the diminishing return to capital accumulation. Using the existence of R&D theories and imperfect competition, Romer (1990), Grossman and Helpman (1991) presented positive externalities of human capital accumulation and found that the gap between the marginal value of an ad- ditional unit of human capital and the market wage. Moreover, from the results of researches which applied endogenous growthe model (Romer 1986, 1989, 1990; Lucas 1988; Rebelo 1991; Grossman and Helpman 1991; Aghion and Howitt 1992), there was evidences to prove that the growth rates can be permanently changed by variables which affected by government policies. In these papers, the variables which used as factors can affect the long-term growth rate are taxation, rule of law, infrastructure services and other financial institutions. So, the govern- ment plays an important in affecting the long-term rate of growth.
- 12. Determinants of economic growth in a panel of Asia Pacific countries Thesis Proposal Tran Luu Quoc Vuong – MDEk16 8 Another factors have important impact to the economic growth are trade and international trade. Different for Solow-Swan model, which is for closed econ- omies, the extended neoclassical growth models show that opening an economy can temporarily increase the growth rate. In the endogenous growth models, open- ness to international trade can give different results. Through various channels, such as: learning-by-doing, specialization and spillovers, knowledge transfers, R&D and scale effect, economic performance will have explicit enhancement. However, the impact of trade on growth can be positive or unclear, different across countries, depending on their characteristics. But, the neoclassical growth models and the endogenous growth models can not address the fundamental driving forces of growth, and hence, cannot explain the enormous variation in economic performance across countries over time. Re- cent decades, poorer countries have failed to grow faster than high-income coun- tries, and the Solow-Swan type of growth model cannot explain by using conver- gence concept. The endogenous growth model can provide an explanation for both questions: why higher income per capita countries can grow fast or faster than lower income per capita ones; and why larges countries may grow faster due to scale effects. However, in the case of under-developed economies, this model still cannot explain the difference in economic performances. Along with the development of the endogenous growth model, new inquiry was been revealed with the proliferation of literature on imperfect information, the existence of transaction cost, incomplete market functions, and the role of govern- ment and institutions. Especially, the role of institutions and institutional change in economic growth became one of important topic of growth literature (Hodgson 1988, 1994, 1998; Eggertsson 1990; North 1989, 1999; Olson 1982, 1996, 2000; Olson et al. 2000). They argued that the differences in the quality of nations’ insti- tutions and economic policies are results of the differences in the wealth of those nations.
- 13. Determinants of economic growth in a panel of Asia Pacific countries Thesis Proposal Tran Luu Quoc Vuong – MDEk16 9 There were a lot of argument about “what is the definition of institution?”, but they can be summarized into two definitions. The first equates institutions to the rule of the game, establishing the baseline conditions for other actions: property rights, the role of formal law, culture, human behavior and individual decision making. The second concentrates on governing structures, in which firms, organi- zations and designations of other kinds are referred to as institutions, like financial institutions and labor market institutions. According to the theory of institutional economics, the ‘exchange’ concept is not only an exchange of physical products or material services, but also is the transfer of two ownerships. Therefore, institu- tions become an important factor which evaluates market efficiency. So, countries with better institutions will organize and use resources more efficiently to achieve a higher level of income. 2.2.Empirical review Identifying the determinants of economic growth has always been one of most important concern of the growth literature. Since 1980s, there were a lot of empirical researches, using both neoclassical and endogenous growth theories, to identify the sources of growth. And there is a consensus among economists that economic growth is determined by a number of sources – physical capital, human capital and knowledge. Using data of 98 countries in the period 1960-1985, Barro (1991) applied cross-sectional framework to examine the determinants of these economies. The research showed that while the initial level of real per capita GDP negative affect to the growth rate of real per capita GDP, the initial human capital would boost the growth rate higher. Additional, human capital positively affects to the ratios of physical investment to GDP while having negatively impact to the fertility rates. The share of government consumption in GDP will lead the growth rate slower, but the effect of the share of public investment to the growth is not clear. Measures
- 14. Determinants of economic growth in a panel of Asia Pacific countries Thesis Proposal Tran Luu Quoc Vuong – MDEk16 10 of political stability has positive influence to the growth rate while proxy for mar- ket distortions inverts. In another research with panel data of around 100 countries from 1960 to 1990 (1996), Barro reevaluated the role of human capital in the form of education and health to the economic growth of a countries. He emphasized the relationship between physical capital and human capital: the faster the economy growths, the greater its current level of human capital develops. Later, Sachs and Warner (1997) used cross-country regression model to evaluate the economic growths of African countries during the period 1965 – 1990. They found that poor economic policies play an important role in the slow growth of these countries, especially, these coun- tries lack of openness of international trade. They also argued that if the countries has faster growth in human capital, these countries will have faster transitional growth. Gallup et al. (1998) had a further conclusion. He said that the countries which has a developed labor force will be more efficient in using resources than others countries. Nelson and Phelps (1966), Romeo (1990), Levine and Zervos (1993), Brunetti et al. (1998), Martin and Xavier (1997) also had researches iden- tifying the role of human resource in absorbing and applying knowledge, technol- ogy into the economic growth. In the same research in 1996, Barro also extended Barro and Lee (1993) to include two factors as political instability variables: the rule of law index and the index of democracy. Similar with above research, Barro got the same results: growth is negatively related to the initial level of real per capita GDP, fertility, government consumption and inflation; but positively related to initial schooling and life expectancy, improvement in the terms of trade. At the same time, he ob- tained some new information: Effect of political freedom to the economic growth is weak, but this effect could be nonlinear with some unclear signs. Similarly, the democracy also have weak effect on growth. On the contrary, the standard of living on a country’s propensity have strong and positive impact to experience democ- racy.
- 15. Determinants of economic growth in a panel of Asia Pacific countries Thesis Proposal Tran Luu Quoc Vuong – MDEk16 11 Also focusing on political issues, Mauro (1995), Knack and Keefer (1995) and Alesina et al. (1996) have their own ways. By using subjective indexes origi- nate from information collected by private monitoring organizations, they con- curred that political instability have negative effects to investment and growth. They also argued that subjective indexes of corruption and the quality of bureau- cracy will have negative relation to the growth. Using endogenous growth models, there were a lot of analysis has been done by using economic rights (capital mobility, trade restrictions, property rights, civil liberty and other indicators of economic regulations). Barro (1991), Ozler and Rodrik (1992), De Haan and Sturm (2000) argued that if less regulations and fewer obstacles should motivate faster growth rates and capital accumulation. Howerver, according to Heckelman and Stroup (2000), Carlsson and Lundstruom (2002), the effects of economic freedom on growth maybe vary across areas. Besides, institutions has also become a new interest of economists with the pioneers of Acemoglu et al. (2001, 2003), Rodrik et al. (2002) and Easterly and Levine (2002). They found that institutions are the most important factors affecting a country’s income. Furthermore, Acemoglu et al. (2001), Frankel and Romer (1999), Rodrik et al. (2002) used institutions and integration as instruments and stated that “the quality of institutions is the only positive and significant determi- nant of income levels”. The growth effects of trade openness has also been confirmed by many em- pirical studies: Dollar (1992), Sachs and Warner (1995), Edwards (1998), Green- away et al. (1998), Frankel and Romer (1999), Vamvakidis (2002)… The growth effects of trade not only have been found via investment, human capital accumu- lation, and technology, but also by the quality of macroeconomic policy, govern- ment size and the extent of price distortions (Levine and Renelt 1992, Frankel and Romer 1999, Wacziarg 2001).
- 16. Determinants of economic growth in a panel of Asia Pacific countries Thesis Proposal Tran Luu Quoc Vuong – MDEk16 12 Above results were updated in another results of Barro in 2003. He got the same results as the research he completed in 1996 mentioned above. He found that there is existences of condition convergence in the model: the growth rate would rise when the initial level of real per capita GDP is low and depend on initial state variables like human capitals in the forms of education and health, other institution and national characteristic variables. The difference in the paper is that he using panel data to approach the problems. 2.3.Summary This chapter gives an overview on theoretical background, which shows us empirically determinants of economic growth. From neoclassical models to en- dogenous growth models, and the role of institutions, theoretical economists have try to identify which factors have significant impacts to the performance of an economy. Although there are still a lot of problems but it is meaningful for policy implications.
- 17. Determinants of economic growth in a panel of Asia Pacific countries Thesis Proposal Tran Luu Quoc Vuong – MDEk16 13 3. CHAPTER 3: RESEARCH METHODOLOGY 3.1.Conceptual framework In this research, the panel data approach and averaging methodology is ap- plied to measure the effect of quantifiable explanatory variables to the economic growths. Growth rate of per capita GDP is used as economic growths while the initial state of the economy is described by initial level of per capita GDP and initial human capital in the form of education attainment and health. Moreover, some variables that reflect policies, institutions and national characteristics, such as investment ratio (Knight, Loayza and Villanueva, 1992; Sala-i-Martin, 1995; Barro, 2003), international openness (Dollar, 1992; Sachs and Warner, 1995; Ed- wards, 1998; Frankel and Romer, 1999; Vamvakidis, 2002; Baldwin, 2003; López, 2005), fertility rate (Barro, 1995, 2003; ), the ratio of government consumption (Barro, 1995, 2003; X. Sala-i-Martin; ) and the inflation rate (S. Fischer, 1993; Barro, 1995, 2003; ) are concluded in the model to explain the impact of condi- tional convergence term. The reasons why these variables are chosen, mentioning specifically in the part 3.2 of this chapter (data and variables). The framework that we are considering to choose model for regressions as below:
- 18. Determinants of economic growth in a panel of Asia Pacific countries Thesis Proposal Tran Luu Quoc Vuong – MDEk16 14 Figure 3.1: Conceptual framework of the study 3.2.Variables 3.2.1 Dependent variables This research uses per capita GDP as dependent variables. It is the ratio of GDP to population, a measurement of how prosperous a country feels to each of its citizens and a growth in per capita GDP is referred to as intensive growth. In comparison with GDP, per capita GDP is widely assumed to be a better in- dicator to evaluate level of development of a country. By using this variable, we can also compare the prosperity of countries with different population size. There are some reasons for using per capita GDP instead of GDP (or GNP). First, GDP only counts money transaction, does not count many goods pro- vided for free. It means that, GDP does not reckon contributions of crucial eco- nomic functions in the household and volunteer sectors. It can be a serious problem when examining the economies of the less-developed nations where a lot of economic activities take place in household sectors. State Variables - Initial per capita GDP - Initial human capital Education Health Economic Growth Policy Variables & National Characteristics - International Openness - Government Consumption - Fertility - Investment - Inflation Panel Data Approach Averaging Methodology with lagging instruments Instrument Variables - Initial per capita GDP - Government Consumption - Investment - International Openness
- 19. Determinants of economic growth in a panel of Asia Pacific countries Thesis Proposal Tran Luu Quoc Vuong – MDEk16 15 The second reason, GDP overlooks everything that occurs outside the realm of monetized exchange, regardless of the importance to well-being. Cobb et al. stated that it likes a business that kept a balance sheet by adding all trans- action, not care they are income or expenses, assets or liabilities. Moreover, GDP calculation violates accounting principles when treating depletion of nat- ural capital as current income, but capital depreciation. And the last problem, the GDP totally ignores the distribution of income, different from per capita GDP. In this research, we will examine the relationship between the growth rate and other factors for each ten-year period: 1990-2000 and 2000-2010. 3.2.2 Explanatory variables a. Initial per capita GDP According to empirical analysis, a lot of growth theorists has stated that the growth rate of per capita GDP would tend to be inversely related to the initial per capita GDP for given determinants of GDP (Barro, 1991, 1995, 2004; Sala-i-Martin, 1995). In this research, we will inspect the growth rate for 2 ten- year periods (1990-2000 and 2000-2010). Besides, we will use earlier values in 1985 and 1995 as instruments to diminish the tendency of overestimation of the convergence rate because of temporary measurement error in GDP. The initial level of per capita GDP enters into the growth equation in the form log(yt−1) so that the coefficient on this variable represents the rate of con- vergence, that is, the responsiveness of the growth rate, Dyt, to a proportional change in yt−1. Because it have inverse ration to the growth rate as convergence hypothesis, this variable was expected to have negative sign. b. Educational attainment
- 20. Determinants of economic growth in a panel of Asia Pacific countries Thesis Proposal Tran Luu Quoc Vuong – MDEk16 16 In this research, we use education attainment and health to measure human capital, one of two state variables. And in turn, to measure the education attain- ment, school enrollment rates are chosen: primary-school enrollment rate and secondary-school enrollment rate. Hanushek and Kimko (2000) suggested that we should us traditional schooling or primary or secondary-school enrollment rate variables to evaluate the quality of labor force, and emphasize the role of human capital in further. As microeconomic analysis, it is often to find that schooling has a significant impact on productivity and wage earnings. Similarly to initial level of per capita GDP, we enter the figures in 1990 and 2000 to growth equations for 2 periods, respectively. This variable expect to have positive sign. c. Life expectancy As one of measurements of human capital, the reciprocal of life expectancy at age one is used as a proxy in the basic system. If the probability of dying were independent of age, then this reciprocal would give the probability per year of dying. From 1940s, by the rise of the wave of international health innovations and improvements, life expectancy became an important factor of demographic sci- ence. From an estimation of mortality by disease before the 1940s using data source from the League of Nations, the authors found that the life expectancy have a significant affect to population but much smaller affect to economic growth. Daron Acemoglu and Simon Johnson (2006) consist of 59 countries, from Western Europe, Oceania, the Americas and Asia during the period 1940- 1980 to measure the impact of the health of the population on economic growth. They found that the impact of life expectancy on per capita GDP are not clear
- 21. Determinants of economic growth in a panel of Asia Pacific countries Thesis Proposal Tran Luu Quoc Vuong – MDEk16 17 and differ across countries, depending on the investment rate. The life expec- tancy have small positive effect to economic growth in initial period, but not enough to compensate for the increase in population. With the same interest, David de la Croix and Omar Licandro (1999) ex- amined the relationship between life expectancy and endogenous growth. They stated that “the effect of life expectancy on growth is positive for economies with a relatively low life expectancy, but could be negative in more advanced economies.” So, from above argument, the expected sign of this variables to economic growth is not clear. d. Fertility rate Similarly to life expectation, the fertility rate is also a measure of human capital. It have an important role on increasing population growth, which has a negative effect on the steady-state of capital in the neoclassical growth model. So, there is a prediction that the fertility rate would have a negative relationship to the growth rate. Barro and Sala-i-Martin (1995) using data of around 100 countries and found the negative relationship between fertility rate and the growth rate. They argued that higher fertility rate the economy has, the higher population growth is. Moreover, female primary education has a strong negative relation with fer- tility rate. This result is the same to other researches (Schultz, 1989; Behrman, 1990; Barro and Lee, 1994; Quamrul H. Ahraf, David N. Weil and Joshua Wilde, 2012). Another reason Barro stated is that higher fertility also requires greater resources devoted to childrearing, and as consequence, reduce the eco- nomic growth. The expected sign of this variables to economic growth is negative. e. Government consumption ratio
- 22. Determinants of economic growth in a panel of Asia Pacific countries Thesis Proposal Tran Luu Quoc Vuong – MDEk16 18 In the neoclassical growth model, the long-run growth rate is independent of government policy, but in the endogenous growth model, the role of govern- ment has changed. In Barro (1991), there are the presence of constant returns to capital, including private capital and public services. He found that there is a significant negative affect on growth from the ratio of government consump- tion to GDP; and, big government is bad for growth. And there are several studies have examined this conclusion. Landau (1983) showed evidence of a negative relationship between the growth rate (per capita GDP) and the share of government consumption expenditure in GDP by inspecting data of over 100 countries in the period 1961-1976. Grier and Tullock had a same conclusion after using data of 115 countries in their study which extended the Kormedi and Meguire (1985) form. Barth and Bradley (1987) found a same result for 16 OECD countries in the period 1971-1983. f. International openness The relationship between international openness and economic growth is one of oldest issues in economics. Trade openness and growth has complicated relationship (Yanikkaya, 2003). In the extended neoclassical growth model, opening an economy can help the economy to temporarily increase the growth rate (Srinivasan and Bhagwati, 1980). In the newer model, endogenous growth model, the role of international openness has changed when the theories said that openness facilitates the transmission of technology from other countries (Lucas 1988, Young 1991), direct resources toward other more research inten- sive sectors (Grossman and Helpman, 1991) and increase market size (Rivera- Batiz and Romer, 1991). However, the overall impact of trade on growth can be positive or not clear, depending on the models and national characteristics: tariffs and trade restrictions. The explanatory variable includes a measure of the extent of international openness, calculated by the ratio of exports plus imports to GDP.
- 23. Determinants of economic growth in a panel of Asia Pacific countries Thesis Proposal Tran Luu Quoc Vuong – MDEk16 19 g. Investment ratio In recent growth model, investment has been one of main factors using to explain economic growth. Young (1994) concluded that “investment was the main source of growth in the experience of the East Asian economies”. Others have found that there are a positive correlation between growth and investment (Kahn and Kumar, 1997; Kahn and Reinhart, 1990; Serven and Solimano, 1992; Greene and Villanueva, 1991). In neoclassical growth model, the economy is closed. So, the saving rate is exogenous and equal to the ratio of investment. In this research, the effect of the saving rate is measured empirically by the ratio of real investment to real GDP. And, because of the effect of the saving rate on growth, in this case, we will use lagged values, the lagged investment ratio, as instruments to enter to the basic equation. The expected sign of this variables to economic growth is positive. h. Inflation rate There are a lot of different conclusions about the relationship between the growth and inflation. In neoclassical growth model, technological change be- came the primary factor explaining long-term growth and was assumed to be exogenous, that is, to be independent of all other factors, including inflation (Todaro, 2000). Mundell (1963) used his model to state the negative relation- ship between inflation and people’s wealth. So, people have to increase saving to get desired wealth and leading to faster output growth. Sidrauski (1967) pro- posed the next major development. The main result of Sidrauski is that the in- flation rate does not affect the steady state capital stock, output and economic growth. Stockman (1981) developed a new model in which money is a compliment to capital. In this model, there was a negative relationship between the steady- state level of output and inflation rate. Cooley and Hansen (1989) extended the
- 24. Determinants of economic growth in a panel of Asia Pacific countries Thesis Proposal Tran Luu Quoc Vuong – MDEk16 20 mechanism with regards to capital accumulation. They showed that increase in inflation rate leads the level of output permanently fall. In endogenous growth model, the growth rate depends on the rate of return on capital. So, inflation decrease that rate, which in turn reduces capital accu- mulation and decrease the growth rate. And, when this model is set within mon- eytary exchange framework, the inflation rate lowered both the return on all capital and the growth rate (Lucas 1980, Lucas and Stokey 1987, McCallum and Goodfriend 1987) In this research, we predict that the inflation has a negative relationship to the growth rate. Inflation rate will be enters into the basic system in the form of the average inflation rate, and used as a measure of macroeconomic stability. Table 3.1. Summary of variables: Variables Description Ex- pected sign Main empirical reference GDP_Growth Growth of per capita GDP Barro (1995, 1997, 2003), Bülent Ulaşan (2012) Init_GDP The initial level of per capita GDP - Lucas (1988), Rebelo (1991), Caballe and Santos (1993), Mulligan and Sala-i-Martin (1993), Barro and Sala- i-Martin (1995), Barro (2003), Nel- son and Phelps (1966), Ben habib and Spiegel (1994) Education at- tainment - Primary-school en- rollment rate + Barro (1991, 1995), Hanushek and Kimko (2000)
- 25. Determinants of economic growth in a panel of Asia Pacific countries Thesis Proposal Tran Luu Quoc Vuong – MDEk16 21 - Secondary-school enrollment rate Life Expec- tancy the reciprocal of life expectancy at age one +/- Barro (2003),Daron Acemoglu and Simon Johnson (2006), David de la Croix and Omar Licandro (1999) Fertility The fertility rate - Barro and Sala-i-Martin (1995), Barro (2003), Quamrul H. Ahraf, Da- vid N. Weil and Joshua Wilde (2012) Gov_share the ratio of govern- ment consumption to GDP - Barro (1991, 1995), Sala-i-Martin (1995), Landau (1983), Grier and Tullock (1987), Kormedi and Meguire (1985), Barth and Bradley (1987) Openness the extent of interna- tional openness +/- Yanikkaya (2003), Barro (1995), Lu- cas (1988), Young (1991), Rivera- Batiz and Romer (1991), Grossman and Helpman (1991), Coe and Help- man (1995), Bülent Ulaşan (2012) Investment the ratio of real gross domestic investment to real GDP + Sala-i-Martin (1995), Barro (1995, 1997, 2003), M. Knight, N. Loayza and D. Villanueva (1992), Kahn and Kumar (1997), Kahn and Reinhart (1990), Serven and Solimano (1992), Greene and Villanueva (1991)
- 26. Determinants of economic growth in a panel of Asia Pacific countries Thesis Proposal Tran Luu Quoc Vuong – MDEk16 22 Inflation the inflation rate - Fisher (1993), Barro (1995), Lucas (1980), Lucas and Stokey (1987), McCallum and Goodfriend (1987) 3.3.Data The dataset consists of 25 Asian Pacific countries and territories. We col- lect their data in the period of 1990 - 2010. The panel data from various sources but mainly draws from World Bank’s World Development Indicators (WDI, 2012). The definition and exact calculated measurement present in the next part 3.4 below. 3.4.Econometric model Based on neoclassical growth model, a country’s per capita growth rate in period t, Dyt, can be express as: Dyt = f(yt-1,ht-1) (1) Where: Dyt is the growth rate of per capita output at time t, is diminishing in the output, y, for given y*. yt is the level of per capita output at time t, the years end of each period y* is the long-run or steady state level of per capita output. The target value y* depends on an array of choice and environmental variables, include saving rates, labor supply, fertility rates, government spending, tax rates, the extent of distortions of markets and business decisions, maintenance of the rule of law and property rights, the degree of polit- ical freedom, terms of trade and so on.
- 27. Determinants of economic growth in a panel of Asia Pacific countries Thesis Proposal Tran Luu Quoc Vuong – MDEk16 23 From the equation (1) and review of empirical study, the most general econometric form testing the determinants of economic growth can be ex- pressed as following: Growth = α + β1*log(Init_GDP) + β2*pri_school + β3*sec_school + β4/expectancy + β5*log(fertility) + β6*gov_share + β7*openness + β8*in- vestment + β9*inflation Where: Growth: the represent the growth rate of per capita GDP for 1990-2000 and 2000-2010, plays the role as dependent variable. Init_GDP: is an observation of the log of real per capita GDP in 1990 and 2000. In addition, the value of the log of per capita GDP in 1985 and 1995 are also included into the model as instruments. Pri_school: is the ratio of total enrollment in primary education in 1990 and 2000, regardless of age, expressed as a percentage of the population of official primary education age. Sec_school: is the ratio of total enrollment in secondary education in 1990 and 2000, regardless of age, expressed as a percentage of the pop- ulation of official secondary education age. Expectancy: is the life expectancy at birth. This variable is used as an instrument and uses data of the year 1985 and 1995. Fertility: total lifetime live births for the typical woman over her ex- pected lifetime. This variable appears in instrument list and uses data of the year 1985 and 1995. Gov_share: are the averages for 1990-1999 and 2000-2009 of the gov- ernment consumption. This variable also uses average values for 1985- 1989 and 1995-1999 as instruments.
- 28. Determinants of economic growth in a panel of Asia Pacific countries Thesis Proposal Tran Luu Quoc Vuong – MDEk16 24 Openness: The degree of international openness is measured by the ra- tio of exports plus imports to GDP for 1990-1999 and 2000-2009. This variable is also includes as an instrument by using lagged value, aver- age value for 1985-1989 and 1995-1999. Investment: The ratio of real gross domestic investment (private plus public) to real GDP enters into the regressions as averages for 2 ten- year periods (1990-1999 and 2000-2009). This variable is also included as an instrument by using lagged value, average value for 1985-1989 and 1995-1999. Inflation: is the average rate of retail price inflation over each of the ten-year periods (1990-2000 and 2000-2010) This research uses three-stage least squares to estimate the determinants of the growth rate with a list of instruments. To illustrate the objectives of the study, we will focus on some tasks as following. First, we will find out the relation between variables and its instruments, such as: the initial level of per capita GDP, the investment rate, the government consumption ratio and the extent of international openness by regressing the endogenous predictors on the exogenous variables. Next, we predict the values of these variables based on the results of those regressions. And the third step, we use the predicted varia- ble as the instrumented variables in our model. During analysis process, we will apply White test and Wald test to checking 3.5.Summary In this chapter, conceptual framework establishes based on the empirical studies and theoretical background of convergence hypothesis in growth model. The growth rate of per capita GDP is chosen as dependent variables and a set of quantifiable variables is used as explanatory variables. We discussed about variables and their empirical studies’ results, identified their roles and impacts of them to the growth rate. A summary of expected sign and empirical
- 29. Determinants of economic growth in a panel of Asia Pacific countries Thesis Proposal Tran Luu Quoc Vuong – MDEk16 25 reference for all variables showed in table 3.1 above. In the end of chapter, we have a brief introduction about what we do next and some test we will use.
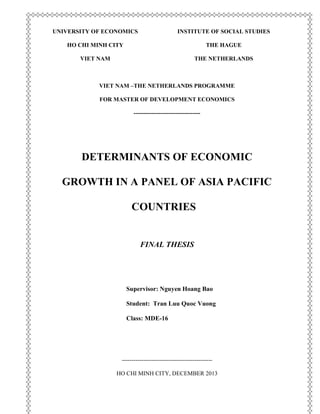
- 30. Determinants of economic growth in a panel of Asia Pacific countries Thesis Proposal Tran Luu Quoc Vuong – MDEk16 26 4. CHAPTER 4: DATA ANALYSIS 4.1.Growth rate and convergence In the neoclassical growth model of Ramsey (1928), Solow (1956), Swan (1956), Koopmans (1965) and Cass (1965), there was a hypothesis called ab- solute convergence. This hypothesis said that “poorer economies typically grow faster per capita and tend there by to catch up to the richer economies”. It mean that the growth rate of real per capita GDP from 1985 to 2010 would have an inverse relationship to the level of real per capita GDP in 1985. The figure 4.1 below expresses the relation between the growth rate of per capita GDP from 1985 to 2010 and the log of per capita GDP in 1985. With the cor- relation -0.327, we can see that, for the 25 countries of Asia Pacific region, the absolute convergence is available. However, with the extent of neoclassical growth model and the endogenous growth model, growth theorists initiated an- other concept: conditional convergence. The relation between the growth rate and the starting position has to be examined under the situation of holding con- stant a set of variables that discriminate the countries.
- 31. Determinants of economic growth in a panel of Asia Pacific countries Thesis Proposal Tran Luu Quoc Vuong – MDEk16 27 Figure 4.1. Growth rate versus Level of Per Capita GDP (simple relation) 4.2.Descriptive analysis In this research, variables used to set up a framework can be split into two groups: group of initial levels of state variables (the stock of physical variables and the stock of human capital) and group of policy variables and national char- acteristics. State variables used in this paper are the initial levels of per capita GDP in the form of log, ratio of primary and secondary schooling enrollment and the reciprocal of life expectancy at age one. The second category comprises the ratio of domestic investment to GDP, the ratio of government consumption to GDP, the extent of international openness, the fertility rate and inflation. There are total 50 observations in the dataset, in which 25 Asia Pacific countries with two 10-year intervals. Within the period 1990-2010, on average, the growth rate of this region is about 5.2%. The country has fastest growth rate is China with average growth rate 12.5% during 2000s while the lowest one is Mongolia with average growth rate 0.94% during 1990s. The mean over sample years of GDP per capita is around 10,600 US Dollars. The territory of 0 0.02 0.04 0.06 0.08 0.1 0.12 2.5 3 3.5 4 4.5 Grơth rate of per capita GDP 1985-2010 log(per capita GDP, 1985)
- 32. Determinants of economic growth in a panel of Asia Pacific countries Thesis Proposal Tran Luu Quoc Vuong – MDEk16 28 Macao reached max nearly 64,000 US Dollars in 2010 while Nepal only got 521 US Dollars in 1990. The life expectancy of this region during period 1990- 2010 is rather high, about 69.8. The countries has lowest value is Papua New Guinea with value of this measure about 59, and increased 6.7 only durng 20 years. The countries has highest figure is Japan with the figure of 80.96, and increased 4.1 during this period. This variable appears in instrument lists and in the form of reciprocal of life expectancy. The measures of education, primary and secondary school enrollment, have average values at 99.89% and 61.91% respectively. But, in comparison with primary school enrollment, the gap between min values and max value of secondary school enrollment variables is very large, 10.68 versus 161.74. In addition, standard deviation of this variable is very high, three times the min value. The most important thing is the number of observations of this variable, only 35 while this figure of other variables is 50. Besides, when calculating the correlation between this variable to others, we found that these figures are so high and have negative impact to regression. This problem will be discuss fur- ther later. Similarly, the gap between countries in the extent of international openness is very high, 18.171 for lowest (Japan in 1990s) and 404.588 for highest (Sin- gapore in 2000s) while value of standard deviation are so high, about 7.5 time of min value. This gap will make some limitations when we examine the model, the result may be not precise and get bias. We will discuss problems of these variables later. About investment and consumption, the average values are 26.04 and 13.48 respectively. The country have highest ratio of investment is Bhutan (49.05% of GDP in 2000s in average), and the country with lowest figure is Brunei (14.33% of GDP in 2000s in average). Bangladesh is the country has the least ratio of real government consumption to real GDP, only 4.5% during
- 33. Determinants of economic growth in a panel of Asia Pacific countries Thesis Proposal Tran Luu Quoc Vuong – MDEk16 29 1990s and 5.2% during 2000s; while Brunei is the country consumes most (25.64% GDP during 1990s). About macroeconomic stability, Japan is the country has negative inflation rate (-2.59% during 2000s) although this figure was 1.2% for previous decade. Mongolia has faced with 2-digit inflation (in average and highest at 268% in 1993) during 1990s, but economy has become better with inflation rate at 8.86% in next decade. The detail descriptive statistics of sample shows in the table 4.1 following. Table 4.1. Summary Statistic on the sample observations Variable Obs Mean Std. Dev. Min Max growth 50 0.052 0.025 0.009 0.125 log_init_gdp 50 3.549 0.568 2.709 4.634 pri_school 42 99.896 15.049 55.298 132.509 sec_school 35 61.911 32.433 10.684 161.739 expectancy 50 0.015 0.002 0.013 0.020 log_fertility 50 0.503 0.206 0.094 0.807 gov_share 49 13.479 5.094 4.534 25.640 openness 50 101.93 82.842 18.171 404.588 investment 49 26.039 7.028 14.331 49.049 inflation 50 0.067 0.078 -0.003 0.490 Table 4.2 provides the simple correlation among variables. The correlation between 4 variables: the initial level of per capita GDP, secondary school en- rollment, expectancy and fertility rate, are so high, from 71.3 to 83.1 percent. It can make us make a question about the relation between these 4 variables. If the multicollinearity exists between them, we will have to drop some of them.
- 34. Determinants of economic growth in a panel of Asia Pacific countries Thesis Proposal Tran Luu Quoc Vuong – MDEk16 30 In relation between the dependent variable, the growth rate, and a set of explanatory variables, the correlation is good, all the signs are as expected. But, the signs in relation between the growth rate and secondary school enrollment rate is negative. As above discussion, the number of observations of this vari- able are too small, so it may affect the precision of the model. Table 4.2. Correlation on the sample observations growth log_in~p pri_sc~l sec_sc~l expect~y log_fe~y gov_sh~e openness invest~t inflat~n growth 1 log_init_gdp -0.332 1 pri_school 0.098 0.081 1 sec_school -0.307 0.716 0.257 1 expectancy 0.119 -0.831 -0.303 -0.713 1 log_fertil~y -0.120 -0.757 -0.253 -0.566 0.812 1 gov_share -0.362 0.509 -0.112 0.439 -0.294 -0.122 1 openness 0.144 0.209 -0.015 -0.016 -0.186 -0.088 -0.008 1 investment 0.562 -0.183 -0.015 -0.149 0.077 -0.088 -0.064 0.109 1 inflation -0.190 -0.369 -0.020 -0.058 0.406 0.394 -0.055 -0.021 0.065 1 4.3.Regression Results for Growth rates 4.3.1 Basic Regression Our data consists of 25 Asia Pacific countries for two period: 1990-2000 and 2000-2010 with a set of 10 variables, including dependent variable. But in this model, from result of descriptive analysis above, I decided to drop the sec- ondary school enrollment variable. Moreover, we will not use the log of initial level of per capita GDP, government consumption ratio, investment rate and the extent of international openness to regression. Instead of them, we will use
- 35. Determinants of economic growth in a panel of Asia Pacific countries Thesis Proposal Tran Luu Quoc Vuong – MDEk16 31 their instrumented variables in our model. Table 4.3 contains result of regres- sion for the growth rate of real per capita GDP. This model also allow the errors terms to be correlated across the time periods and to be assumed to be inde- pendent across countries. The error variances are allowed different for each period but not allowed to vary across countries. We use dummy variable to distinguish two time periods. As above short analysis, there are convergence in this paper and we can found that from the table 4.3: the estimated coefficient on log_init_gdp is sig- nificant (P-value at 0.001) and at a value of -0.05. It means that the growth will be higher in response to lower initial level of per capita GDP if the other ex- planatory variables are held constant. According to this coefficient, conver- gence occurs at the rate of 5 percent per year that is the growth rate will increase 0.05 if a one-standard-deviation decline in the log of per capita GDP. Table 4.3. Basic Cross-Country Growth Regression Variable Coefficient Std. Err. t P>t [95% Conf. Interval] p_log_init_gdp -0.0504206 0.0134595 -3.75 0.001 -0.0778714 -0.0229697 pri_school -0.0000755 0.0002156 -0.35 0.729 -0.0005151 0.0003642 expectancy 0.3693233 3.528819 0.1 0.917 -6.82775 7.566396 log_fertility -0.1114896 0.0331247 -3.37 0.002 -0.1790479 -0.0439313 p_gov_share 0.0003242 0.0007024 0.46 0.648 -0.0011084 0.0017568 p_openness 0.0000188 0.0000571 0.33 0.745 -0.0000977 0.0001353 p_investment 0.000171 0.0005128 0.33 0.741 -0.0008749 0.0012168 inflation -0.041935 0.0356694 -1.18 0.249 -0.1146832 0.0308132 cyear 0.0104734 0.0062874 1.67 0.106 -0.0023498 0.0232966 _cons 0.268931 0.097938 2.75 0.01 0.0691852 0.4686769 Number of Obs 41 Prob>F 0.0024 R-squared 52.68% Adj R-squared 38.94% (We can observe details in Appendix C.1)
- 36. Determinants of economic growth in a panel of Asia Pacific countries Thesis Proposal Tran Luu Quoc Vuong – MDEk16 32 But, we can see that, almost variables are not significant and have very high value of P-value, except the initial level of GDP, log of fertility. Besides, the sign of some variables are not like expected: primary school enrollment and ratio of government consumption. We need to do some hypothesis test to im- prove this model. 4.3.2 Hypothesis tests The first problem we have to face is heteroskedasticity. Heteroscedasticity does not cause estimated coefficient by OLS to be biased, but it can cause the variance and standard errors of the coefficients to be biased. So, we still can use regression result from heteroscedastic data to estimate the relationship be- tween the dependent variable and the explanatory variables, but results of hy- pothesis tests are possibly wrong. We use White test to test heteroskedasticity for this model. The following is the result: Table 4.4. Heteroskedasticity – White test White's test for Ho: homoskedasticity against Ha: unrestricted heteroskedasticity chi2(40) = 41.00 Prob > chi2 = 0.4265 Cameron & Trivedi's decomposition of IM-test Source Chi2 df p Heteroskedasticity 41 40 0.4265 Skewness 10.62 9 0.3028 Kurtosis 0.35 1 0.5547 Total 51.97 50 0.3972 Tải bản FULL (69 trang): https://bit.ly/3Yd2vBh Dự phòng: fb.com/TaiHo123doc.net
- 37. Determinants of economic growth in a panel of Asia Pacific countries Thesis Proposal Tran Luu Quoc Vuong – MDEk16 33 We can see that, the chi-square value is very high. It indicates that het- eroskedasticity was present in this model. And the table 4.5 following is the result after dealing heteroskedasticity. Table 4.5. Basic Cross-Country Growth Regression (robust) Variable Coef. Robust Std. Err. t P>t [95% Conf.Interval] p_log_init_gdp -0.052423 0.0137314 -3.82 0.001 -0.08043 -0.02442 pri_school -0.0000761 0.0001879 -0.41 0.688 -0.00046 0.000307 expectancy 0.3806465 3.509894 0.11 0.914 -6.77783 7.539123 log_fertility -0.1121092 0.0371288 -3.02 0.005 -0.18783 -0.03638 p_gov_share 0.0004222 0.0007607 0.56 0.583 -0.00113 0.001974 p_openness 0.0000179 0.0000468 0.38 0.704 -7.8E-05 0.000113 p_investment 0.0002587 0.001414 0.18 0.856 -0.00263 0.003143 inflation -0.052122 0.0552661 -0.94 0.353 -0.16484 0.060594 cyear 0.0105059 0.0053372 1.97 0.058 -0.00038 0.021391 _cons 0.2784087 0.0996637 2.79 0.009 0.075143 0.481674 (We can observe details in Appendix C.2) Heteroscedasticity does not cause estimated coefficient by OLS to be bi- ased, so the coefficient of variables not changes. It means that almost the vari- ables are not significant and the signs of some variables are different from ex- pected. The model is not good enough. The variables may be not significant or there are relation between them that make the model do not have statistical meanings. Tải bản FULL (69 trang): https://bit.ly/3Yd2vBh Dự phòng: fb.com/TaiHo123doc.net
- 38. Determinants of economic growth in a panel of Asia Pacific countries Thesis Proposal Tran Luu Quoc Vuong – MDEk16 34 The next hypothesis test we have to do is the multicollinearity test. Not like heteroskedasticity, the impact of an explanatory variable on the dependent variable while holding other variables constant will be less precise. One of the specialty of multicollinearity is that the standard errors of the affected coeffi- cients tend to be large. As a consequence, the test of the hypothesis that the coefficient is equal to zero may lead to a failure in rejecting a false null hypoth- esis of the explanatory variable which has no effect. As above mentioned (in Chapter 4, part 2, Descriptive Analysis), there are some variables in this re- search have this characteristic, such as secondary school enrollment and inter- national openness. The result of multicollinearity test is described in the table 4.6 below. We can see that, the VIF value of all variables of the model are smaller than 10, so, there is not the present of multicollinearity in this model. Table 4.6. Multicollinearity testing Variable VIF 1/VIF p_log_init~p 7.22 0.138458 expectancy 5.84 0.171111 log_fertil~y 5.75 0.173822 p_gov_share 2.37 0.421843 inflation 1.9 0.526855 p_investment 1.85 0.540728 p_openness 1.45 0.69091 pri_school 1.33 0.754336 cyear 1.26 0.791249 Mean VIF 3.22 6679420