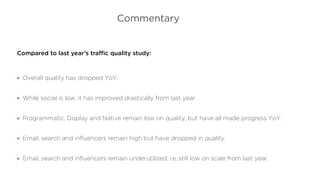
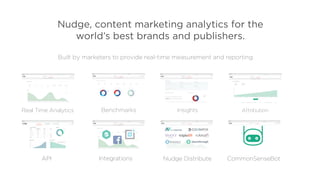
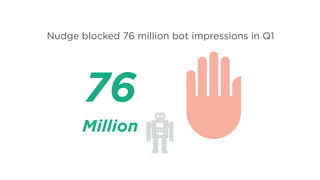
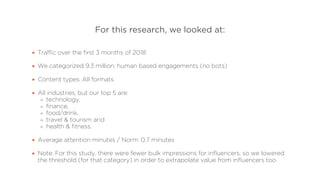
Gustaf Stenlund
Digital Marketing Manager
+
Not all clicks are created equal.
Q1 2018 Traffic Quality Study.
Agenda
Intro of Nudge

Methodology

Key findings

Discussion
Benchmarks Insights AttributionReal Time Analytics
API Integrations Nudge Distribute CommonSenseBot
Built by marketers to provide real-time measurement and reporting.
Nudge, content marketing analytics for the 

world’s best brands and publishers.
Nudge blocked 76 million bot impressions in Q1
76
Million
For this research, we looked at:
Traffic over the first 3 months of 2018
We categorized 9.3 million, human based engagements (no bots)
Content types: All formats
All industries, but our top 5 are:
technology,
finance,
food/drink,
travel & tourism and
health & fitness.
Average attention minutes / Norm: 0.7 minutes
Note: For this study, there were fewer bulk impressions for influencers, so we lowered
the threshold (for that category) in order to extrapolate value from influencers too.
Traffic Sources vs Benchmark [Q1 2018]
Quality Benchmark: 0.7 attention minutes
Influencer
Email
Direct
Search
Publisher
Social
75%
32%
26%
17%
13%
3%
Recommendation Units
Native
Programmatic
Display
6%
36%
46%
74%
Above benchmark Below benchmark
YoY Changes Between Traffic Sources
Traffic Sources that INCREASED
quality YoY.
2017 2018 Diff. %
Programmatic
Social
Direct
Display
Native
0.21 0.38 81%
0.48 0.72 50%
0.75 0.88 17%
0.16 0.18 12%
0.41 0.43 5%
Traffic Sources that DECREASED
quality YoY.
2017 2018 Diff. %
Publisher
Recommendation units
Search
Email newsletter
Influencer
0.86 0.79 - 8%
0.83 0.66 - 20%
1.03 0.82 - 20%
1.26 0.92 - 27%
1.82 1.22 - 33%
Commentary
Compared to last year’s traffic quality study:
Overall quality has dropped YoY.
While social is low, it has improved drastically from last year.
Programmatic, Display and Native remain low on quality, but have all made progress YoY.
Email, search and influencers remain high but have dropped in quality.
Email, search and influencers remain underutilized, i.e. still low on scale from last year.
People vs Attention
Direct
Influencer
Publisher
Social
Email
Search
Other
Rec. units
Native
Programmatic
Display
Attention
People
+
Interesting stuff, right?
We think so too.
If you’d like to learn more about this research, or get a demo
of Nudge, give us a shout!
ari@giveitanudge.com

Nudge Traffic Study Q1 2018

  • 1.
    Gustaf Stenlund Digital MarketingManager + Not all clicks are created equal. Q1 2018 Traffic Quality Study.
  • 2.
  • 3.
    Benchmarks Insights AttributionRealTime Analytics API Integrations Nudge Distribute CommonSenseBot Built by marketers to provide real-time measurement and reporting. Nudge, content marketing analytics for the 
 world’s best brands and publishers.
  • 4.
    Nudge blocked 76million bot impressions in Q1 76 Million
  • 5.
    For this research,we looked at: Traffic over the first 3 months of 2018 We categorized 9.3 million, human based engagements (no bots) Content types: All formats All industries, but our top 5 are: technology, finance, food/drink, travel & tourism and health & fitness. Average attention minutes / Norm: 0.7 minutes Note: For this study, there were fewer bulk impressions for influencers, so we lowered the threshold (for that category) in order to extrapolate value from influencers too.
  • 6.
    Traffic Sources vsBenchmark [Q1 2018] Quality Benchmark: 0.7 attention minutes Influencer Email Direct Search Publisher Social 75% 32% 26% 17% 13% 3% Recommendation Units Native Programmatic Display 6% 36% 46% 74% Above benchmark Below benchmark
  • 7.
    YoY Changes BetweenTraffic Sources Traffic Sources that INCREASED quality YoY. 2017 2018 Diff. % Programmatic Social Direct Display Native 0.21 0.38 81% 0.48 0.72 50% 0.75 0.88 17% 0.16 0.18 12% 0.41 0.43 5% Traffic Sources that DECREASED quality YoY. 2017 2018 Diff. % Publisher Recommendation units Search Email newsletter Influencer 0.86 0.79 - 8% 0.83 0.66 - 20% 1.03 0.82 - 20% 1.26 0.92 - 27% 1.82 1.22 - 33%
  • 8.
    Commentary Compared to lastyear’s traffic quality study: Overall quality has dropped YoY. While social is low, it has improved drastically from last year. Programmatic, Display and Native remain low on quality, but have all made progress YoY. Email, search and influencers remain high but have dropped in quality. Email, search and influencers remain underutilized, i.e. still low on scale from last year.
  • 9.
  • 10.
    + Interesting stuff, right? Wethink so too. If you’d like to learn more about this research, or get a demo of Nudge, give us a shout! ari@giveitanudge.com