This document provides an overview of different types of preference assessments used to determine preferences, including single stimulus, paired stimulus, multiple stimulus without replacement, and free operant assessments. It discusses how to collect data for each type of assessment and how to calculate and interpret the results, with one section focusing on how to graph the results of a paired stimulus preference assessment. Checkpoint questions are included to test understanding.
Salient Features of India constitution especially power and functions
4.1 paired stimulus results and interpretation
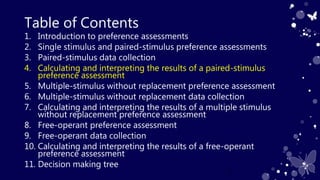
1. Table of Contents
1. Introduction to preference assessments
2. Single stimulus and paired-stimulus preference assessments
3. Paired-stimulus data collection
4. Calculating and interpreting the results of a paired-stimulus
preference assessment
5. Multiple-stimulus without replacement preference assessment
6. Multiple-stimulus without replacement data collection
7. Calculating and interpreting the results of a multiple stimulus
without replacement preference assessment
8. Free-operant preference assessment
9. Free-operant data collection
10. Calculating and interpreting the results of a free-operant
preference assessment
11. Decision making tree
1
2. Table of Contents
4. Calculating and interpreting the results of a paired-stimulus
preference assessment
a. Calculating the results
b. Interpreting the results
c. Graphing the results
2
3. Graphing
In the following video you will learn how to graph the results.
Having a graph will make it much easier to interpret and
understand the results.
Video
Now that you learned how to collect data on the client’s behavior let’s calculate the results and determine which items are the most preferred!
These are the results of the actual preference assessment.
Check that you have the same results for the first 10 trials and copy the rest.
Then Write the item names on the last box
To determine which items are the most preferred, first count the number of times each item was selected across trials.
Lets count how many times teddy was selected…….hmm it looks like it was not selected at all, so write 0 under number of trial selected
Then, divide the number of trial selected by the total trials presented and multiply by 100.
For example, for the M&Ms 4 divided by 8 is .5 multiplied by 100 is 50%
4/8 = .5 x 100 = 50%
For the Cheetos, 5 divided by 8 is .63 multiplied by 100 is 63%
Do the same for the rest of the items.
The one with the highest percentage is the most preferred item
In this case the cube is the imiost preffered because it has 75% which is the highest percentage and the second most preferred is the spin
If you were teaching anew skill to your client you would use the items that were the most preferred, in this case you would use the cube and the spin
Remember, the most preferred items are the most likely items to function as potential reinforcers and reinforcers increase behavior. We want to use these potential reinforcders to increase our clients skills