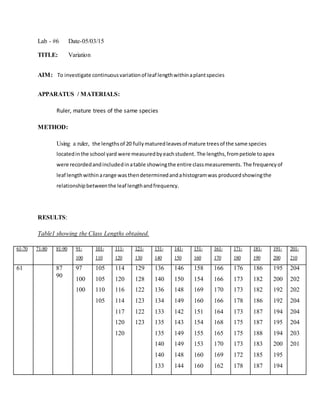
SlideShare a Scribd company logo
1 of 7
Lab - #6 Date-05/03/15
TITLE: Variation
AIM: To investigate continuousvariationof leaf lengthwithinaplantspecies
APPARATUS / MATERIALS:
Ruler, mature trees of the same species
METHOD:
Using a ruler, the lengthsof 20 fullymaturedleavesof mature treesof the same species
locatedinthe school yard were measuredbyeachstudent. The lengths,frompetiole toapex
were recordedandincludedinatable showingthe entire classmeasurements. The frequencyof
leaf lengthwithinarange wasthendeterminedandahistogramwas producedshowingthe
relationshipbetweenthe leaf lengthandfrequency.
RESULTS:
Table1 showing the Class Lengths obtained.
61-70 71-80 81-90 91-
100
101-
110
111-
120
121-
130
131-
140
141-
150
151-
160
161-
170
171-
180
181-
190
191-
200
201-
210
61 87
90
97
100
100
105
105
110
105
114
120
116
114
117
120
120
129
128
122
123
122
123
136
140
136
134
133
135
135
140
140
133
146
150
148
149
142
143
149
149
148
144
158
154
169
160
151
154
155
153
160
160
166
166
170
166
164
168
165
170
169
162
176
173
173
178
173
175
175
173
172
178
186
182
182
186
187
187
188
183
185
187
195
200
192
192
194
195
194
200
195
194
204
202
202
204
204
204
203
201
136
135
140
138
135
132
135
135
140
149
142
150
143
145
150
150
141
145
150
150
141
148
142
150
144
150
150
149
150
150
150
150
150
150
150
144
143
150
144
145
155
160
160
158
154
160
156
152
155
160
160
155
156
153
151
157
154
151
151
160
160
160
160
160
152
159
159
160
155
160
155
162
170
168
164
169
162
165
162
161
162
166
165
165
170
170
170
170
170
170
170
170
170
170
170
170
170
163
168
170
170
168
172
176
176
176
176
175
175
174
172
172
173
173
171
175
176
180
180
172
179
178
174
174
179
176
174
174
175
176
180
180
180
187
188
186
187
187
186
187
186
190
184
185
182
185
190
190
182
184
189
188
190
184
188
186
186
187
190
189
184
188
190
190
195
192
194
198
193
190
195
196
200
200
200
200
195
192
195
197
191
195
195
192
190
196
195
195
19
190
191
149
141
142
143
149
160
170
153
157
155
155
160
160
155
155
160
170
170
163
168
180
175
180
180
173
178
180
178
172
173
174
178
176
180
171
174
175
175
172
174
177
173
171
175
175
173
180
177
180
178
180
182
187
190
188
185
190
185
190
187
185
185
182
182
190
185
190
184
187
187
186
183
190
188
190
184
188
190
188
Table2 showing Frequency of Leaf Length
Leaf Length(mm) Frequency
61-70 1
71-80 0
81-90 2
91-100 3
101-110 4
111-120 7
121-130 6
131-140 19
141-150 46
151-160 52
161-170 45
171-180 72
181-190 69
191-200 37
201-210 8
211-220 0
Figure 1: Histogram showing Leaf Lengths vs Frequency
0
10
20
30
40
50
60
70
80
NumberofLeaves
Length of Leaves/mm
61-70
71-80
81-90
91-100
101-110
111-120
121-130
131-140
141-150
151-160
161-170
171-180
181-190
191-200
201-210
211-220
L
DISCUSSION:
Variation refers to any differences between organisms caused either by genetic
differences (genotypic variation) or by the effect of environmental factors on the expression of
genetic potentials (phenotypic variation). In other words phenotypic variation is basically all the
obvious differences of physical appearances and behaviour of organisms while genotypic
variation is the differences in the genes which are not easily seen by the naked eye.
Phenotypic Variation can be classified into two levels; intraspecific and interspecific
variation. Variation occurring between different species is called interspecific and is commonly
used by biologists when classifying organisms. Intraspecific variation is the differences within
the same species. This type of variation can be described as either being discontinuous or
continuous.
Discontinuous Variation is where individuals
A chi square test is a statistical method of assessing and comparing the observed data and
the expected data. In the experiment a chi square test was used to determine the frequency of the
phenotypes with comparison to Mendel law of assortment. Our null hypothesis was that there
was that there are no significant difference between the observed and expected results and was
determined using the chi square test. The chi square table was entered at d.f =3 and we saw that
the probability of our chi square value is greater than 0.9. By statistically convention we used the
0.05 probability level as our critical value. If the value is greater than the 0.05 value (2.37) the
hypothesis will be rejected; however since the value obtained was less than the critical value the
null hypothesis was accepted that the data fits a 9:3:31 ratio. From the results obtained it can be
concluded that Mendel law of independent assortment was indeed valid.
In the experiment, 4 coins were labelled on each side. On the first two coins , they were
labelled as follows ; one coin had a capital ‘A’ which represents a dominant gene on one side and
an common ‘a’ to represent a recessive gene. The combination of ‘Aa’ on the coin represented a
heterozygous genotype. The other coin was labelled using B instead of A to show a different
gene/ phenotype; hence a dihybrid test could have been conducted. These two coins represented
two different heterozygous genotypes of the first parent. The other two coins were labelled
similarly as the first two and represented the second parent. This was necessary because in order
to investigate Mendel 2nd law of assortment a dihyrbid cross test must be conducted using two
heterozygous genotypes.
From the results obtained from the class there is a general trend where the value from
‘dominant in both’ is substantially the largest and both the values of ‘Dominant in the 1st and
recessive in the 2nd’ and ‘Recessive in the 1st and dominant in the 2nd’ and similar and the value
from ‘Recessive in both’ is the lowest. This trend follows the genotypic ratio of Mendel’s Law
9:3:3:1.
SOURCES OF ERROR:
The fact that the surface which the coins were flipped on weren’t smooth flat surfaces
this may have caused disturbance in the coins.
PRECUATIONS:
The tape was evenly cut to prevent any uneven distribution in the weight of the coins.
Also all the coins used were the same size. The letters used in the labelling of the genes
were letters which can easily be distinguish from each other.
LIMITATIONS:
A pencil was used instead to label the coins which resulting into the records taking a lot
more time because the letters weren’t clearly seen.
CONCLUSION:
From the experiment we can conclude that Mendelian phenotypic ratio (9:3:3:1) was indeed
valid between two di hybrid heterozygotes genotypes due to the value which was obtained from
the chi square test being 1.93 being less than our probability number 2.37 and as a result the null
hypothesis that there are no significant differences between the observer and expected results
was accepted.

More Related Content

Viewers also liked

Viewers also liked (15)

Natural selection
Natural selection Natural selection
Natural selection
 
Genome evolution
Genome evolutionGenome evolution
Genome evolution
 
Genetics and evolution
Genetics and evolutionGenetics and evolution
Genetics and evolution
 
Variation & Evolution
Variation & EvolutionVariation & Evolution
Variation & Evolution
 
Heterosis
Heterosis  Heterosis
Heterosis
 
Genetic drift
Genetic drift Genetic drift
Genetic drift
 
Speciation
Speciation   Speciation
Speciation
 
Natural Selection
Natural SelectionNatural Selection
Natural Selection
 
genetic variations
genetic variationsgenetic variations
genetic variations
 
Types of selection
Types of selectionTypes of selection
Types of selection
 
Natural Selection
Natural SelectionNatural Selection
Natural Selection
 
Speciation and Evolution
Speciation and EvolutionSpeciation and Evolution
Speciation and Evolution
 
Speciation powerpoint
Speciation powerpointSpeciation powerpoint
Speciation powerpoint
 
Heterosis concepts
Heterosis conceptsHeterosis concepts
Heterosis concepts
 
isolation
isolationisolation
isolation
 

Similar to Variation

allele distributionIn population genetics, allele frequencies are.pdf
allele distributionIn population genetics, allele frequencies are.pdfallele distributionIn population genetics, allele frequencies are.pdf
allele distributionIn population genetics, allele frequencies are.pdf
aparnaagenciestvm
 
Top of Form1. Some variables that were recorded while studyi.docx
Top of Form1. Some variables that were recorded while studyi.docxTop of Form1. Some variables that were recorded while studyi.docx
Top of Form1. Some variables that were recorded while studyi.docx
edwardmarivel
 
Variation Poster Updated 2
Variation Poster Updated 2Variation Poster Updated 2
Variation Poster Updated 2
Eileen Ramirez
 
1 statistical analysis notes
1 statistical analysis notes1 statistical analysis notes
1 statistical analysis notes
cartlidge
 

Similar to Variation (20)

MONOHYBRID AND DIHYBRID CROSS
MONOHYBRID AND DIHYBRID CROSSMONOHYBRID AND DIHYBRID CROSS
MONOHYBRID AND DIHYBRID CROSS
 
eg.poster
eg.postereg.poster
eg.poster
 
Drosophila - Laboratory Report 2
Drosophila  - Laboratory Report 2Drosophila  - Laboratory Report 2
Drosophila - Laboratory Report 2
 
Statistical analysis by iswar
Statistical analysis by iswarStatistical analysis by iswar
Statistical analysis by iswar
 
Linkage_Crossing_over.pptx
Linkage_Crossing_over.pptxLinkage_Crossing_over.pptx
Linkage_Crossing_over.pptx
 
A Note On Exact Tests Of Hardy-Weinberg Equilibrium
A Note On Exact Tests Of Hardy-Weinberg EquilibriumA Note On Exact Tests Of Hardy-Weinberg Equilibrium
A Note On Exact Tests Of Hardy-Weinberg Equilibrium
 
linkage
linkagelinkage
linkage
 
AuNP_Poster_2016
AuNP_Poster_2016AuNP_Poster_2016
AuNP_Poster_2016
 
Statistics
StatisticsStatistics
Statistics
 
allele distributionIn population genetics, allele frequencies are.pdf
allele distributionIn population genetics, allele frequencies are.pdfallele distributionIn population genetics, allele frequencies are.pdf
allele distributionIn population genetics, allele frequencies are.pdf
 
Hypothesis
HypothesisHypothesis
Hypothesis
 
Top of Form1. Some variables that were recorded while studyi.docx
Top of Form1. Some variables that were recorded while studyi.docxTop of Form1. Some variables that were recorded while studyi.docx
Top of Form1. Some variables that were recorded while studyi.docx
 
SEA Phages Report
SEA Phages ReportSEA Phages Report
SEA Phages Report
 
Variation Poster Updated 2
Variation Poster Updated 2Variation Poster Updated 2
Variation Poster Updated 2
 
ANOVA.pdf
ANOVA.pdfANOVA.pdf
ANOVA.pdf
 
Unit 4
Unit 4Unit 4
Unit 4
 
Gene mapping
Gene  mappingGene  mapping
Gene mapping
 
14; allometry in chelonians
14; allometry in chelonians14; allometry in chelonians
14; allometry in chelonians
 
1 statistical analysis notes
1 statistical analysis notes1 statistical analysis notes
1 statistical analysis notes
 
1 s2.0-073510979390202 c-main
1 s2.0-073510979390202 c-main1 s2.0-073510979390202 c-main
1 s2.0-073510979390202 c-main
 

Variation

  • 1. Lab - #6 Date-05/03/15 TITLE: Variation AIM: To investigate continuousvariationof leaf lengthwithinaplantspecies APPARATUS / MATERIALS: Ruler, mature trees of the same species METHOD: Using a ruler, the lengthsof 20 fullymaturedleavesof mature treesof the same species locatedinthe school yard were measuredbyeachstudent. The lengths,frompetiole toapex were recordedandincludedinatable showingthe entire classmeasurements. The frequencyof leaf lengthwithinarange wasthendeterminedandahistogramwas producedshowingthe relationshipbetweenthe leaf lengthandfrequency. RESULTS: Table1 showing the Class Lengths obtained. 61-70 71-80 81-90 91- 100 101- 110 111- 120 121- 130 131- 140 141- 150 151- 160 161- 170 171- 180 181- 190 191- 200 201- 210 61 87 90 97 100 100 105 105 110 105 114 120 116 114 117 120 120 129 128 122 123 122 123 136 140 136 134 133 135 135 140 140 133 146 150 148 149 142 143 149 149 148 144 158 154 169 160 151 154 155 153 160 160 166 166 170 166 164 168 165 170 169 162 176 173 173 178 173 175 175 173 172 178 186 182 182 186 187 187 188 183 185 187 195 200 192 192 194 195 194 200 195 194 204 202 202 204 204 204 203 201
  • 4. Table2 showing Frequency of Leaf Length Leaf Length(mm) Frequency 61-70 1 71-80 0 81-90 2 91-100 3 101-110 4 111-120 7 121-130 6 131-140 19 141-150 46 151-160 52 161-170 45 171-180 72 181-190 69 191-200 37 201-210 8 211-220 0 Figure 1: Histogram showing Leaf Lengths vs Frequency 0 10 20 30 40 50 60 70 80 NumberofLeaves Length of Leaves/mm 61-70 71-80 81-90 91-100 101-110 111-120 121-130 131-140 141-150 151-160 161-170 171-180 181-190 191-200 201-210 211-220 L
  • 5. DISCUSSION: Variation refers to any differences between organisms caused either by genetic differences (genotypic variation) or by the effect of environmental factors on the expression of genetic potentials (phenotypic variation). In other words phenotypic variation is basically all the obvious differences of physical appearances and behaviour of organisms while genotypic variation is the differences in the genes which are not easily seen by the naked eye. Phenotypic Variation can be classified into two levels; intraspecific and interspecific variation. Variation occurring between different species is called interspecific and is commonly used by biologists when classifying organisms. Intraspecific variation is the differences within the same species. This type of variation can be described as either being discontinuous or continuous. Discontinuous Variation is where individuals A chi square test is a statistical method of assessing and comparing the observed data and the expected data. In the experiment a chi square test was used to determine the frequency of the phenotypes with comparison to Mendel law of assortment. Our null hypothesis was that there was that there are no significant difference between the observed and expected results and was determined using the chi square test. The chi square table was entered at d.f =3 and we saw that the probability of our chi square value is greater than 0.9. By statistically convention we used the 0.05 probability level as our critical value. If the value is greater than the 0.05 value (2.37) the hypothesis will be rejected; however since the value obtained was less than the critical value the null hypothesis was accepted that the data fits a 9:3:31 ratio. From the results obtained it can be concluded that Mendel law of independent assortment was indeed valid. In the experiment, 4 coins were labelled on each side. On the first two coins , they were labelled as follows ; one coin had a capital ‘A’ which represents a dominant gene on one side and an common ‘a’ to represent a recessive gene. The combination of ‘Aa’ on the coin represented a heterozygous genotype. The other coin was labelled using B instead of A to show a different gene/ phenotype; hence a dihybrid test could have been conducted. These two coins represented two different heterozygous genotypes of the first parent. The other two coins were labelled similarly as the first two and represented the second parent. This was necessary because in order
  • 6. to investigate Mendel 2nd law of assortment a dihyrbid cross test must be conducted using two heterozygous genotypes. From the results obtained from the class there is a general trend where the value from ‘dominant in both’ is substantially the largest and both the values of ‘Dominant in the 1st and recessive in the 2nd’ and ‘Recessive in the 1st and dominant in the 2nd’ and similar and the value from ‘Recessive in both’ is the lowest. This trend follows the genotypic ratio of Mendel’s Law 9:3:3:1. SOURCES OF ERROR: The fact that the surface which the coins were flipped on weren’t smooth flat surfaces this may have caused disturbance in the coins. PRECUATIONS: The tape was evenly cut to prevent any uneven distribution in the weight of the coins. Also all the coins used were the same size. The letters used in the labelling of the genes were letters which can easily be distinguish from each other. LIMITATIONS: A pencil was used instead to label the coins which resulting into the records taking a lot more time because the letters weren’t clearly seen. CONCLUSION: From the experiment we can conclude that Mendelian phenotypic ratio (9:3:3:1) was indeed valid between two di hybrid heterozygotes genotypes due to the value which was obtained from the chi square test being 1.93 being less than our probability number 2.37 and as a result the null
  • 7. hypothesis that there are no significant differences between the observer and expected results was accepted.