1. 5nm Gold Nanoparticle Enthalpy of Dissolution
Rita M. Schwieters, J. A. Powell, C. M. Sorensen
Department of Physics and Astronomy, St. Cloud State University,
Department of Physics and Astronomy, Kansas State University
1. Prausnitz, J.M.; Lichtenthaler, R.N.; Gomez de Azevedo E. Molecular Thermodynamics of
Fluid-Phase Equilibria, Prentice Hall, Englewood Cliffs, NJ, 1986.
Nanoparticles have become the subject of serious scientific
investigation. They exhibit properties that are different from both
their individual elements and their bulk material. Nanoparticles are
clusters of atoms with a nanometer scale diameter. 5nm gold
nanoparticles have about 3000 gold atoms clustered in a face
centered cubic arrangement. The gold atoms are attracted to each
other. To prevent them from continuing to grow, nanoparticles are
capped with a ligand, a long chain molecule that sticks to the
surface gold atoms.
The purpose of this research is to measure the enthalpy of
dissolution for 5nm gold nanoparticles (AuNPs) ligated with
dodecanethiol (DDT), and dissolved in excess DDT and toluene.
Three samples of the same synthesis were tested.
5nm AuNPs have a plasmon peak at about 524nm.
Absorbance values were taken at this wavelength for
each data point. The absorbance was converted to
concentration with the assistance of a calibration data
set in which absorbance data were taken at a
temperature below ambient room temperature, to
prevent precipitation. The supernatant was sent to a
separate lab for a concentration determination. Beer-
Lambert’s Law, Absorbance=constant*Concentration,
was used to convert absorbance to concentration for all
other data points. To get the enthalpy of dissolution,
Maxwell-Boltzman statistics were used.
P(dissolved) = Concentration = constant∗𝑒𝑒
−∆𝐻𝐻
𝑘𝑘𝑘𝑘 (1)
Where P is probability, H in enthalpy, k is Boltzmann’s
constant, and T is temperature. This allowed
determination of enthalpy of dissolution for each
sample.
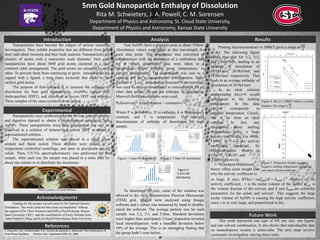
Figure1. 5.2nm NP distribution Figure 2. 5.8nm NP distribution
To determine NP size, some of the solution was
allowed to dry on a Transmission Electron Microscope
(TEM) grid. Images were analyzed using Imagej
software and a subset was measured by hand to double-
check the software. The average particle size for each
sample was 5.2, 5.5, and 5.8nm. Standard deviations
were higher than anticipated. Closer inspection revealed
local monodispersity with a standard deviation below
10% of the average. This is an interesting finding that
the group hadn’t seen before.
Nanoparticles were synthesized by the inverse micelle process
and digestive ripened to obtain a monodisperse sample of 5nm
AuNPs. These nanoparticles were then precipitated out and re-
dissolved in a solution of toluene and excess DDT to obtain a
supersaturated solution.
The supersaturated solution was placed in a small glass
ampule and flame sealed. These ampules were placed in a
temperature controlled centrifuge, and spun to precipitate out all
solids. Then, UV-Vis spectrophotometry was performed on the
sample. After each run, the sample was placed in a sonic bath for
about one minute to re-distribute the monomers.
Photo Courtesy of Emily Herman
Funding for this project was provided by the National Science
Foundation. This work could not have been accomplished without
the support of Dr. Chris Sorensen and Jeffrey Powell during Kansas
State University’s REU, and the contributions of Emily Herman from
Saint Norbert College and Kyle Bayliff from Kansas State University.
This work represents one type of NP, one size, one ligand,
and one solvent combination. It also shows that reproducible data
on monodisperse system is achievable. The next steps involve
systematic investigation varying these traits.
Plotting ln(concentration) vs 1000/T gives a slope of
∆𝐻𝐻
𝑘𝑘
in kJ. The following figure
shows this plot for 5.2, 5.5,
and 5.8nm NPs, leading to an
enthalpy of dissolution of
19.1kJ/mol, 20.9kJ/mol, and
22.6kJ/mol respectively. This
leads to an average enthalpy of
dissolution of 20.9kJ/mol.
In an ideal solution
extrapolating ln(x)=0 would
correspond to the melting
temperature. In this data
ln(x)=0 corresponds to
negative temperature. Clearly,
this is far from an ideal
solution. In fact, any
assumption about melting
temperature gives a huge
activity coefficient. For 400K,
1300K, or T→∞ the activity
coefficient predicted by
Thermodynamic theory is
1.4x10⁶, 1.8x10⁵, and
2700 respectively.
Scatchard-Hildebrand
theory offers some insight into
why the activity coefficient is
so large. It says, RTlnγ = ν𝜑𝜑𝑠𝑠𝑠𝑠𝑠𝑠𝑠𝑠
2
(𝛿𝛿 − 𝛿𝛿𝑠𝑠𝑠𝑠𝑠𝑠𝑠𝑠.) 2
where γ is the
activity coefficient, ν is the molar volume of the solute, 𝜑𝜑solv is
the volume fraction of the solvent, and 𝛿𝛿 and 𝛿𝛿𝑠𝑠𝑠𝑠𝑠𝑠𝑠𝑠.are solubility
parameters for the solute and solvent1. This suggests the large
molar volume of AuNPs is causing the high activity coefficient,
since ν is so very large, and proportional to lnγ,
Figure 4. ln(x) vs 1000/T where x is mole
fraction. The slope is
∆𝐻𝐻
𝑘𝑘
.
Figure 5. Projection of data suggests
negative melting temperature indicating
non-ideal solution behavior.Figure 3.
5.5nm NP
distribution