More Related Content
Similar to Introduction to Geotechnical Engineering 2nd Edition Holtz Solutions Manual (20)
Introduction to Geotechnical Engineering 2nd Edition Holtz Solutions Manual
- 1. CHAPTER 2
INDEX AND CLASSIFICATION PROPERTIES OF SOILS
2-1. From memory, draw a phase diagram (like Fig. 2.2, but don’t look first!). The “phases” have
a Volume side and Mass side. Label all the parts.
SOLUTION: Refer to Figure 2.2.
2-2. From memory, write out the definitions for water content, void ratio, dry density, wet or moist
density, and saturated density.
SOLUTION: Refer to Section 2.2.
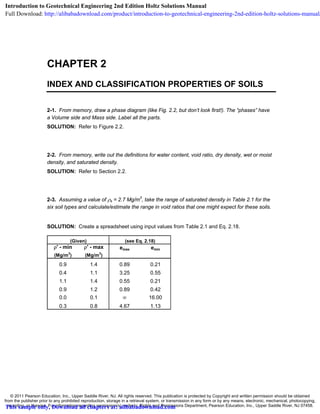
2-3. Assuming a value of ρs = 2.7 Mg/m3
, take the range of saturated density in Table 2.1 for the
six soil types and calculate/estimate the range in void ratios that one might expect for these soils.
SOLUTION: Create a spreadsheet using input values from Table 2.1 and Eq. 2.18.
ρ' - min ρ' - max emax emin
(Mg/m3
) (Mg/m3
)
0.9 1.4 0.89 0.21
0.4 1.1 3.25 0.55
1.1 1.4 0.55 0.21
0.9 1.2 0.89 0.42
0.0 0.1 ∞ 16.00
0.3 0.8 4.67 1.13
(Given) (see Eq. 2.18)
© 2011 Pearson Education, Inc., Upper Saddle River, NJ. All rights reserved. This publication is protected by Copyright and written permission should be obtained
from the publisher prior to any prohibited reproduction, storage in a retrieval system, or transmission in any form or by any means, electronic, mechanical, photocopying,
recording, or likewise. For information regarding permission(s), write to: Rights and Permissions Department, Pearson Education, Inc., Upper Saddle River, NJ 07458.
Introduction to Geotechnical Engineering 2nd Edition Holtz Solutions Manual
Full Download: http://alibabadownload.com/product/introduction-to-geotechnical-engineering-2nd-edition-holtz-solutions-manual/
This sample only, Download all chapters at: alibabadownload.com
- 2. Index and Classification Properties of Soils Chapter 2
2-4. Prepare a spreadsheet plot of dry density in Mg/m3
as the ordinate versus water content in
percent as the abscissa. Assume ρs = 2.65 Mg/m3
and vary the degree of saturation, S, from
100% to 40% in 10% increments. A maximum of 50% water content should be adequate.
SOLUTION: Solve Eq. 2.12 and Eq. 2.15 for ρd = f(ρs, w, S, Gs), or use Eq. 5.1.
ρ Swρ =dry ρww+ S
ρs
S = 100 90 80 70 60 50 40 30 20 10
w ρdry ρdry ρdry ρdry ρdry ρdry ρdry ρdry ρdry ρdry
(%) (Mg/m3
) (Mg/m3
) (Mg/m3
) (Mg/m3
) (Mg/m3
) (Mg/m3
) (Mg/m3
) (Mg/m3
) (Mg/m3
) (Mg/m3
)
0.0 2.65 2.65 2.65 2.65 2.65 2.65 2.65 2.65 2.65 2.65
5.0 2.34 2.31 2.27 2.23 2.17 2.09 1.99 1.84 1.59 1.14
10.0 2.09 2.05 1.99 1.92 1.84 1.73 1.59 1.41 1.14 0.73
15.0 1.90 1.84 1.77 1.69 1.59 1.48 1.33 1.14 0.89 0.53
20.0 1.73 1.67 1.59 1.51 1.41 1.29 1.14 0.96 0.73 0.42
25.0 1.59 1.53 1.45 1.36 1.26 1.14 1.00 0.83 0.61 0.35
30.0 1.48 1.41 1.33 1.24 1.14 1.02 0.89 0.73 0.53 0.30
35.0 1.37 1.31 1.23 1.14 1.04 0.93 0.80 0.65 0.47 0.26
40.0 1.29 1.22 1.14 1.05 0.96 0.85 0.73 0.58 0.42 0.23
45.0 1.21 1.14 1.06 0.98 0.89 0.78 0.67 0.53 0.38 0.21
50.0 1.14 1.07 1.00 0.92 0.83 0.73 0.61 0.49 0.35 0.19
Problem 2-4
0.00
0.50
1.00
1.50
2.00
2.50
3.00
0 5 10 15 20 25 30 35 40 45 50 55
w (%)
ρdry(Mg/m3)
S=100%
S=90%
S=80%
S=70%
S=60%
S=50%
S=40%
S=30%
S=20%
S=10%
© 2011 Pearson Education, Inc., Upper Saddle River, NJ. All rights reserved. This publication is protected by Copyright and written permission should be obtained
from the publisher prior to any prohibited reproduction, storage in a retrieval system, or transmission in any form or by any means, electronic, mechanical, photocopying,
recording, or likewise. For information regarding permission(s), write to: Rights and Permissions Department, Pearson Education, Inc., Upper Saddle River, NJ 07458.
- 3. Index and Classification Properties of Soils Chapter 2
2-5a Prepare a graph like that in Problem 2.4, only use dry density units of kN/m3
and pounds
per cubic feet.
SOLUTION:
ρ SwFrom Eq. 2.12 and Eq. 2.15: ρ =dry ρww+ S
ρs
S = 100 90 80 70 60 50 40 30 20 10
w γdry γdry γdry γdry γdry γdry γdry γdry γdry γdry
(%) (kN/m3
) (kN/m3
) (kN/m3
) (kN/m3
) (kN/m3
) (kN/m3
) (kN/m3
) (kN/m3
) (kN/m3
) (kN/m3
)
0.0 26.00 26.00 26.00 26.00 26.00 26.00 26.00 26.00 26.00 26.00
5.0 22.95 22.66 22.30 21.86 21.29 20.55 19.53 18.03 15.64 11.18
10.0 20.55 20.08 19.53 18.86 18.03 16.99 15.64 13.80 11.18 7.12
15.0 18.60 18.03 17.37 16.58 15.64 14.48 13.04 11.18 8.70 5.23
20.0 16.99 16.36 15.64 14.79 13.80 12.62 11.18 9.40 7.12 4.13
25.0 15.64 14.97 14.22 13.36 12.35 11.18 9.79 8.10 6.03 3.41
30.0 14.48 13.80 13.04 12.17 11.18 10.04 8.70 7.12 5.23 2.90
35.0 13.49 12.80 12.04 11.18 10.21 9.11 7.83 6.35 4.61 2.53
40.0 12.62 11.94 11.18 10.34 9.40 8.33 7.12 5.73 4.13 2.24
45.0 11.86 11.18 10.44 9.62 8.70 7.68 6.53 5.23 3.73 2.01
50.0 11.18 10.52 9.79 8.99 8.10 7.12 6.03 4.80 3.41 1.82
Problem 2-5a
0.00
5.00
10.00
15.00
20.00
25.00
30.00
0 5 10 15 20 25 30 35 40 45 50 55
w (%)
γdry(kN/m3)
S=100%
S=90%
S=80%
S=70%
S=60%
S=50%
S=40%
S=30%
S=20%
S=10%
© 2011 Pearson Education, Inc., Upper Saddle River, NJ. All rights reserved. This publication is protected by Copyright and written permission should be obtained
from the publisher prior to any prohibited reproduction, storage in a retrieval system, or transmission in any form or by any means, electronic, mechanical, photocopying,
recording, or likewise. For information regarding permission(s), write to: Rights and Permissions Department, Pearson Education, Inc., Upper Saddle River, NJ 07458.
- 4. Index and Classification Properties of Soils Chapter 2
2-5b Prepare a graph like that in Problem 2.4, only use dry density units of pounds per cubic
feet.
SOLUTION: s w
dry
s
G S
S G w
γ
γ =
+
S = 100 90 80 70 60 50 40 30 20 10
w γdry γdry γdry γdry γdry γdry γdry γdry γdry γdry
(%) (pcf) (pcf) (pcf) (pcf) (pcf) (pcf) (pcf) (pcf) (pcf) (pcf)
0.0 165.36 165.36 165.36 165.36 165.36 165.36 165.36 165.36 165.36 165.36
5.0 146.01 144.14 141.86 139.04 135.45 130.72 124.21 114.70 99.46 71.12
10.0 130.72 127.75 124.21 119.95 114.70 108.08 99.46 87.80 71.12 45.30
15.0 118.33 114.70 110.47 105.47 99.46 92.12 82.94 71.12 55.35 33.24
20.0 108.08 104.07 99.46 94.11 87.80 80.27 71.12 59.77 45.30 26.25
25.0 99.46 95.25 90.45 84.96 78.59 71.12 62.25 51.54 38.34 21.69
30.0 92.12 87.80 82.94 77.43 71.12 63.85 55.35 45.30 33.24 18.48
35.0 85.79 81.44 76.58 71.12 64.95 57.92 49.83 40.41 29.33 16.09
40.0 80.27 75.93 71.12 65.77 59.77 53.00 45.30 36.48 26.25 14.26
45.0 75.42 71.12 66.39 61.16 55.35 48.85 41.53 33.24 23.75 12.79
50.0 71.12 66.89 62.25 57.16 51.54 45.30 38.34 30.53 21.69 11.60
Problem 2-5b
0.00
20.00
40.00
60.00
80.00
100.00
120.00
140.00
160.00
180.00
0 5 10 15 20 25 30 35 40 45 50 55
w (%)
γdry(pcf)
S=100%
S=90%
S=80%
S=70%
S=60%
S=50%
S=40%
S=30%
S=20%
S=10%
© 2011 Pearson Education, Inc., Upper Saddle River, NJ. All rights reserved. This publication is protected by Copyright and written permission should be obtained
from the publisher prior to any prohibited reproduction, storage in a retrieval system, or transmission in any form or by any means, electronic, mechanical, photocopying,
recording, or likewise. For information regarding permission(s), write to: Rights and Permissions Department, Pearson Education, Inc., Upper Saddle River, NJ 07458.
- 5. Index and Classification Properties of Soils Chapter 2
2.6. Prepare a graph like that in Problem 2.4, only for S = 100% and vary the density of solids
from 2.60 to 2.80 Mg/m3
. You decide the size of the increments you need to “satisfactorily”
evaluate the relationship as ρs varies. Prepare a concluding statement of your observations.
SOLUTION:
ρ SwFrom Eq. 2.12 and Eq. 2.15: ρ =dry ρww+ S
ρs
Note: The relationship between ρdry and w is not overly sensitive to ρs.
ρs = 2.6 2.65 2.7 2.75 2.8
w ρdry ρdry ρdry ρdry ρdry
(%) (Mg/m3
) (Mg/m3
) (Mg/m3
) (Mg/m3
) (Mg/m3
)
0.0 2.60 2.65 2.70 2.75 2.80
5.0 2.30 2.34 2.38 2.42 2.46
10.0 2.06 2.09 2.13 2.16 2.19
15.0 1.87 1.90 1.92 1.95 1.97
20.0 1.71 1.73 1.75 1.77 1.79
25.0 1.58 1.59 1.61 1.63 1.65
30.0 1.46 1.48 1.49 1.51 1.52
35.0 1.36 1.37 1.39 1.40 1.41
40.0 1.27 1.29 1.30 1.31 1.32
45.0 1.20 1.21 1.22 1.23 1.24
50.0 1.13 1.14 1.15 1.16 1.17
0.00
0.50
1.00
1.50
2.00
2.50
3.00
0 5 10 15 20 25 30 35 40 45 50 55
w (%)
ρs(Mg/m3)
© 2011 Pearson Education, Inc., Upper Saddle River, NJ. All rights reserved. This publication is protected by Copyright and written permission should be obtained
from the publisher prior to any prohibited reproduction, storage in a retrieval system, or transmission in any form or by any means, electronic, mechanical, photocopying,
recording, or likewise. For information regarding permission(s), write to: Rights and Permissions Department, Pearson Education, Inc., Upper Saddle River, NJ 07458.
- 6. Index and Classification Properties of Soils Chapter 2
2.7. The dry density of a compacted sand is 1.87 Mg/m3
and the density of the solids is 2.67
Mg/m3
. What is the water content of the material when saturated?
SOLUTION:
w
dry
w
s
3
w 3 3
dry s
S
From Eq. 2-12 and Eq. 2-15: ; Note: S = 100%
w S
1 1 1 1
Solving for w: w S (1Mg / m )(100%) 16.0%
1.87 Mg / m 2.67Mg / m
ρ
ρ =
ρ
+
ρ
⎛ ⎞ ⎛ ⎞
= ρ − = − =⎜ ⎟ ⎜ ⎟⎜ ⎟ρ ρ ⎝ ⎠⎝ ⎠
2.8. A soil that is completely saturated has a total density of 2045 kg/m3
and a water content of
24%. What is the density of the solids? What is the dry density of the soil?
SOLUTION:
a) Solve using equations or phase diagrams:
3t
dry
w
sat dry w
s
w dry 3
s
dry w sat
2045
1649.2 kg / m
(1 w) (1 0.24)
1
(1000)(1649.2)
2729.6 kg / m
(1649.2 1000 2045)
ρ
ρ = = =
+ +
⎛ ⎞ρ
ρ = − ρ + ρ⎜ ⎟
ρ⎝ ⎠
ρ ρ
ρ = = =
ρ + ρ − ρ + −
b) Solve using phase diagram relationships:
t
t
w
w s
s
t w s s s s
3sw
w w
w
3s
s
s
3s
dry
t
assume V 1.0
M 2045 kg
M
0.24 M 0.24M
M
M M M 2045 0.24M M M 1649.19 kg
0.24MM
1000 V 0.3958 m
V 1000
M 1649.19
2729.6 kg / m
V 1 0.3958
M 1649.19
1649.2 kg / m
V 1
=
=
= → =
= + → = + → =
ρ = = → = =
ρ = = =
−
ρ = = =
© 2011 Pearson Education, Inc., Upper Saddle River, NJ. All rights reserved. This publication is protected by Copyright and written permission should be obtained
from the publisher prior to any prohibited reproduction, storage in a retrieval system, or transmission in any form or by any means, electronic, mechanical, photocopying,
recording, or likewise. For information regarding permission(s), write to: Rights and Permissions Department, Pearson Education, Inc., Upper Saddle River, NJ 07458.
- 7. Index and Classification Properties of Soils Chapter 2
2.9 What is the water content of a fully saturated soil with a dry density of 1.72 Mg/m3
? Assume
ρs = 2.72 Mg/m3
.
SOLUTION:
w
dry
w
s
3
w 3 3
dry s
S
From Eq. 2-12 and Eq. 2-15: ; Note: S = 100%
w S
1 1 1 1
Solving for w: w S (1Mg / m )(100%) 21.4%
1.72 Mg / m 2.72 Mg / m
ρ
ρ =
ρ
+
ρ
⎛ ⎞ ⎛ ⎞
= ρ − = − =⎜ ⎟ ⎜ ⎟⎜ ⎟ρ ρ ⎝ ⎠⎝ ⎠
2.10. A dry quartz sand has a density of 1.68 Mg/m3
. Determine its density when the degree of
saturation is 75%. The density of solids for quartz is 2.65 Mg/m3
.
SOLUTION:
dry dry (final)
w
dry
w
s
3
w 3 3
dry s
t dry
Recognize that (initial) (final); S = 75%
S
From Eq. 2-12 and Eq. 2-15:
w S
1 1 1 1
Solving for w: w S (1Mg / m )(75%) 16.34%
1.68 Mg / m 2.65 Mg / m
final (1
ρ = ρ
ρ
ρ =
ρ
+
ρ
⎛ ⎞ ⎛ ⎞
= ρ − = − =⎜ ⎟ ⎜ ⎟⎜ ⎟ρ ρ ⎝ ⎠⎝ ⎠
ρ = ρ + 3
w) 1.68(1 0.1634) 1.95 Mg / m= + =
2.11. The dry density of a soil is 1.60 Mg/m3
and the solids have a density of 2.65 Mg/m3
. Find
the (a) water content, (b) void ratio, and (c) total density when the soil is saturated.
SOLUTION:
w
dry
w
s
3
w 3 3
dry s
s
w
Given: S = 100%
S
From Eq. 2-12 and Eq. 2-15:
w S
1 1 1 1
(a) Solving for w: w S (1Mg / m )(100%) 24.76%
1.60 Mg / m 2.65 Mg / m
w (24.76)(2.65)
(b) From Eq. 2.15: e
S (100)(1
ρ
ρ =
ρ
+
ρ
⎛ ⎞ ⎛ ⎞
= ρ − = − =⎜ ⎟ ⎜ ⎟⎜ ⎟ρ ρ ⎝ ⎠⎝ ⎠
ρ
= =
ρ
3
t dry
0.656
.0)
(c) (1 w) 1.60(1 0.2476) 1.996 2.00 Mg / m
=
ρ = ρ + = + = =
© 2011 Pearson Education, Inc., Upper Saddle River, NJ. All rights reserved. This publication is protected by Copyright and written permission should be obtained
from the publisher prior to any prohibited reproduction, storage in a retrieval system, or transmission in any form or by any means, electronic, mechanical, photocopying,
recording, or likewise. For information regarding permission(s), write to: Rights and Permissions Department, Pearson Education, Inc., Upper Saddle River, NJ 07458.
- 8. Index and Classification Properties of Soils Chapter 2
2.12. A natural deposit of soil is found to have a water content of 20% and to be 90% saturated.
What is the void ratio of this soil?
SOLUTION:
s
s
w
w = 20% and S = 90%; assume G 2.70
w (20.0)(2.70)
From Eq. 2.15: e 0.60
S (90)(1.0)
=
ρ
= = =
ρ
2.13. A chunk of soil has a wet weight of 62 lb and a volume of 0.56 ft3
. When dried in an oven,
the soil weighs 50 lb. If the specific gravity of solids Gs = 2.64, determine the water content, wet
unit weight, dry unit weight, and void ratio of the soil.
SOLUTION: Solve using phase diagram relationships.
w t s
w
s
t
t
t
s
dry
t
3w
w
w
3s
s
s w
v t v
(a) W W W 62 50 12 lb
W 12(100)
w 100% 24.0%
W 50
W 62
(b) 110.7 pcf
V 0.56
W 50
(c) 89.29 pcf
V 0.56
W 12
(d) V 0.1923 ft
62.4
W 50
V 0.3035 ft
G (2.64)(62.4)
V V V 0.56 0.3035 0.2565
e
= − = − =
= × = =
γ = = =
γ = = =
= = =
γ
= = =
γ
= − = − =
v
s
V 0.2565
0.8451 0.84
V 0.3035
= = = =
2.14. In the lab, a container of saturated soil had a mass of 113.27 g before it was placed in the
oven and 100.06 g after the soil had dried. The container alone had a mass of 49.31 g. The
specific gravity of solids is 2.80. Determine the void ratio and water content of the original soil
sample.
SOLUTION: Solve using phase diagram relationships.
s
w
w
s
s
w
M 100.06 49.31 50.75 g
M 113.27 100.06 13.21g
M 13.21(100)
(a) w 100% 26.03 26.0%
M 50.75
w 2.80(26.03)
(b) From Eq. 2.15: e= 0.7288 0.73
S (1)(100)
= − =
= − =
= × = = =
ρ
= = =
ρ
© 2011 Pearson Education, Inc., Upper Saddle River, NJ. All rights reserved. This publication is protected by Copyright and written permission should be obtained
from the publisher prior to any prohibited reproduction, storage in a retrieval system, or transmission in any form or by any means, electronic, mechanical, photocopying,
recording, or likewise. For information regarding permission(s), write to: Rights and Permissions Department, Pearson Education, Inc., Upper Saddle River, NJ 07458.
- 9. Index and Classification Properties of Soils Chapter 2
2.15. The natural water content of a sample taken from a soil deposit was found to be 12.0%. It
has been calculated that the maximum density for the soil will be obtained when the water
content reaches 22.0%. Compute how many grams of water must be added to each 1000 g of
soil (in its natural state) in order to increase the water content to 22.0%.
SOLUTION:
w
w s
s
t s w s s s
s
w
s
w s
Natural state
M
w 0.12 M (0.12)M
M
M M M M 0.12M 1.12M 1000 g
M 892.857 g
M (0.12)(892.857) 107.143 g
Target state
(Note: M does not change between natural state and target state)
M w M (0.22)(89
= = → =
= + = + = =
=
= =
= × = 2.857) 196.429 g
additional water necessary = 196.429 107.143 89.286 89.29 g
=
− = =
2.16. A cubic meter of dry quartz sand (Gs = 2.65) with a porosity of 60% is immersed in an oil
bath having a density of 0.92 g/cm3
. If the sand contains 0.27 m3
of entrapped air, how much
force is required to prevent it from sinking? Assume that a weightless membrane surrounds the
specimen. (Prof. C. C. Ladd.)
SOLUTION:
3
3
3
3 3
t
3
v t
3
s t v
3kg
s s s s tm
t kg
t m
t
kg
buoy t oil m
buoy buoy
V 1m 1,000,000 cm
V n V (0.6)(1.0) 0.60 m
V V V 1.0 0.60 0.40 m
M G V (2.65)(1000 )(0.40 m ) 1060 kg M
M 1060
1060
V 1.0
1060 920 140
g (140)(9.81) 1373.4
= =
= × = =
= − = − =
= ×ρ × = = =
ρ = = =
ρ = ρ − ρ = − =
γ = ρ × = = 3
3
N
m
3N
buoy m
Force (entrapped air) 1373.4 0.27 m 370.8 N= γ × = × =
© 2011 Pearson Education, Inc., Upper Saddle River, NJ. All rights reserved. This publication is protected by Copyright and written permission should be obtained
from the publisher prior to any prohibited reproduction, storage in a retrieval system, or transmission in any form or by any means, electronic, mechanical, photocopying,
recording, or likewise. For information regarding permission(s), write to: Rights and Permissions Department, Pearson Education, Inc., Upper Saddle River, NJ 07458.
- 10. Index and Classification Properties of Soils Chapter 2
2.17. A soil sample taken from a borrow pit has a natural void ratio of 1.15. The soil will be used
for a highway project where a total of 100,000 m3
of soil is needed in its compacted state; its
compacted void ratio is 0.73. How much volume has to be excavated from the borrow pit to meet
the job requirements?
SOLUTION:
t s tv
s s
3
t
3
s(emb)
t
s(borr) s(emb)
3
t(borr) s borr
V V VV
V V
e e e 1
Embankment
V 100,000 m
100,000
V 57,803.47 m
0.73 1
Borrow Pit
V
V V
e 1
V V (e 1) (57,803.47)(1.15 1) 124,277 m
−
= = → =
+
=
= =
+
= =
+
= × + = + =
2.18. A sample of moist soil was found to have the following characteristics:
Total volume: 0.01456 m3
Total mass: 25.74 kg
Mass after oven drying: 22.10 kg
Specific gravity of solids: 2.69
Find the density, unit weight, void ratio, porosity, and degree of saturation for the moist soil.
SOLUTION:
3
3 3
kg
t m
N kN
t t m m
3s
s
s w
3
v
25.74
(a) 1767.857 1768
0.01456
(b) g (1767.857)(9.81) 17,342.68 17.34
M 22.10
(c) V 0.00822 m
G (2.69)(1000)
V 0.01456 0.00822 0.006344 m
0.006344
e 0.7718 0.77
0.00822
0.7718
(d) n
1 0.7
ρ = = =
γ = ρ × = = =
= = =
ρ
= − =
= = =
=
+
w
w
100 43.56 43.6%
718
(e) M 25.74 22.10 3.64
3.64
V 0.00364
1000
0.00364
S 100 57.377 57.4%
0.006344
× = =
= − =
= =
= × = =
© 2011 Pearson Education, Inc., Upper Saddle River, NJ. All rights reserved. This publication is protected by Copyright and written permission should be obtained
from the publisher prior to any prohibited reproduction, storage in a retrieval system, or transmission in any form or by any means, electronic, mechanical, photocopying,
recording, or likewise. For information regarding permission(s), write to: Rights and Permissions Department, Pearson Education, Inc., Upper Saddle River, NJ 07458.
- 11. Index and Classification Properties of Soils Chapter 2
2.19. A gray silty clay (CL) is sampled from a depth of 12.5 feet. The “moist” soil was extruded
from a 6-inch-high brass liner with an inside diameter of 2.83 inches and weighed 777 grams. (a)
Calculate the wet density in pounds per cubic feet. (b) A small chunk of the original sample had a
wet weight of 140.9 grams and weighed 85.2 grams after drying. Compute the water content,
using the correct number of significant figures. (c) Compute the dry density in Mg/m3
and the dry
unit weight in kN/m3
.
SOLUTION:
( )( )
( )( )
( )3
2
3 t
t t 3
3t
w
w t s
s
t
dry
lb
dry ft
1lb777 g
453.6 gM(2.83)
(a) V 6 37.741in , 78.429 78.4 pcf
4 V 1ft37.741in
12 in
M 55.7
(b) M M M 140.9 85.2 55.7 g, w 100% 65.38 65.4%
M 85.2
78.4
(c) 47.40 pcf
(1 w) (1 0.654)
1ft47.4
0.3
π
= × = γ = = = =
= − = − = = × = = =
γ
γ = = =
+ +
ρ = ( ) ( ) 3 3
3 3
3
kg Mg
m m
N kN
dry m m
0.4536 kg 759.288 0.759
048 m 1lb
(759.288)(9.81) 7448.6 7.45
= =
γ = = =
2.20. A cylindrical soil specimen is tested in the laboratory. The following properties were
obtained:
Sample diameter 3 inches
Sample length 6 inches
Wt. before drying in oven 2.95 lb
Wt. after drying in oven 2.54 lb
Oven temperature 110°C
Drying time 24 hours
Specific gravity of solids 2.65
What is the degree of saturation of this specimen?
SOLUTION:
2
3 3
t
3 3s
s
s w
3 3
v t s
w t s
3 3w
w
w
w
v
(3)
V 6 42.4115 in 0.02454 ft
4
W 2.54
V 0.01536 ft 26.542 in
G (2.65)(62.4)
V V V 42.4115 26.542 15.869 in 0.009184 ft
W W W 2.95 2.54 0.41lb
W 0.41
V 0.00657 ft 11.354 in
62.4
V 1
S 100%
V
π
= × = =
= = = =
γ
= − = − = =
= − = − =
= = = =
γ
= × =
1.354
100 71.5%
15.869
× =
© 2011 Pearson Education, Inc., Upper Saddle River, NJ. All rights reserved. This publication is protected by Copyright and written permission should be obtained
from the publisher prior to any prohibited reproduction, storage in a retrieval system, or transmission in any form or by any means, electronic, mechanical, photocopying,
recording, or likewise. For information regarding permission(s), write to: Rights and Permissions Department, Pearson Education, Inc., Upper Saddle River, NJ 07458.
- 12. Index and Classification Properties of Soils Chapter 2
2.21 A sample of saturated silt is 10 cm in diameter and 2.5 cm thick. Its void ratio in this state is
1.35, and the specific gravity of solids is 2.70. The sample is compressed to a 2-cm thickness
without a change in diameter.
(a) Find the density of the silt sample, in prior to being compressed.
(b) Find the void ratio after compression and the change in water content that occurred
from initial to final state.
SOLUTION:
3
3
2
3
t
w
w v
v
v s s
3
t v s s s s s
3
v w
g
w w w cm
g
s s s w cm
(10)
(a) V 2.5 196.350 cm
4
V
S 1 V V
V
V e V 1.35V
V V V 1.35V V 2.35V 196.350 V 83.553 cm
V (1.35)(83.553) 112.797 cm V
M V (1 )(112.797) 112.797 g
M G V (2.70)(83.553)(1 )
π
= × =
= = → =
= × =
= + = + = = → =
= = =
= ρ × = =
= × × ρ =
3 3
t
t g kg
t cm m
t
2
3
t 2
3
s
3
v t s
final
initial
225.594 g
M 112.797 225.594 338.391g
M 338.391
1.723 1723
V 196.35
(10)
(b) V 2.0 157.08 cm
4
V 83.553 cm (no change)
V V V 157.08 83.553 73.527 cm
73.527
e 0.88
83.553
112.
(c) w
−
=
= + =
ρ = = = =
π
= × =
=
= − = − =
= =
=
3
w v w s
final
797
100% 50.0%
225.594
final conditions
V V 73.527 cm ; M 73.527 g; M 225.594 g (no change)
73.527
w 100% 32.6%
225.594
w 50.0 32.6 17.4%
× =
= = = =
= × =
Δ = − =
© 2011 Pearson Education, Inc., Upper Saddle River, NJ. All rights reserved. This publication is protected by Copyright and written permission should be obtained
from the publisher prior to any prohibited reproduction, storage in a retrieval system, or transmission in any form or by any means, electronic, mechanical, photocopying,
recording, or likewise. For information regarding permission(s), write to: Rights and Permissions Department, Pearson Education, Inc., Upper Saddle River, NJ 07458.
- 13. Index and Classification Properties of Soils Chapter 2
2.22. A sample of sand has the following properties: total mass Mt = 160 g; total volume Vt =80
cm3
; water content w = 20%; specific gravity of solids Gs =2.70. How much would the sample
volume have to change to get 100% saturation, assuming the sample mass Mt stayed the same?
SOLUTION:
3
w s s
t s s
s
3g
w w wcm
3 3s
s v
s w
i
t
M w M (0.20)M
M M 0.20M 160 g
M 133.33 g
M (0.20)(133.33) 26.667 g; V (1 )M 26.667 cm
M 133.33
V 49.383 cm ; V 80 49.383 30.617 cm
G 2.70
26.667
S 100% 87.10%
30.617
Desired condition: S 100%
V ch
= × =
= + =
=
= = = =
= = = = − =
ρ
= × =
=
s s
3
w w
v w
3
t s v
3
anges, but V and M remain the same
M 26.667 g; V 26.667 cm
V V (when S = 100%)
V V V 49.383 26.667 76.053 cm
V 80 76.053 3.95 cm
= =
=
= + = + =
Δ = − =
© 2011 Pearson Education, Inc., Upper Saddle River, NJ. All rights reserved. This publication is protected by Copyright and written permission should be obtained
from the publisher prior to any prohibited reproduction, storage in a retrieval system, or transmission in any form or by any means, electronic, mechanical, photocopying,
recording, or likewise. For information regarding permission(s), write to: Rights and Permissions Department, Pearson Education, Inc., Upper Saddle River, NJ 07458.
- 14. Index and Classification Properties of Soils Chapter 2
2.23. Draw a phase diagram and begin to fill in the blanks: A soil specimen has total volume of
80,000 mm3
and weighs 145 g. The dry weight of the specimen is 128 g, and the density of the
soil solids is 2.68 Mg/m3
. Find the: (a) water content, (b) void ratio, (c) porosity, (d) degree of
saturation, (e) wet density, and (f) dry density. Give the answers to parts (e) and (f) in both SI and
British engineering units.
SOLUTION:
w
w
s
3 3s
s
s w
3
v
w w w
(a) M 145 128 17 g
M 17
w 100% 100 13.281 13.3%
M 128
M 128
(b) V 47.7612 cm 47,761.2 mm
G (2.68)(1)
V 80,000 47,761.2 32,238.8 mm
32,238.8
e 0.67
47,761.2
32,238.8
(c) n 100% 40.3%
80,000
(d) V M (17)(1)
− =
= × = × = =
= = = =
ρ
= − =
= =
= × =
= × ρ =
3 3
3 3
3
3
3 3
g kg
t cm m
kg lbm
t m ft
kg
dry m
kg l
dry m
17 cm 17,000 mm
17,000
S 100% 52.7%
32,238.8
145
(e) 1.8125 1812.5
80
1
1812.5 113.2 (see Appendix A)
16.018
1812.5
(f) 1600.0
(1 0.13281)
1
1600.0 99.9
16.018
= =
= × =
ρ = = =
⎛ ⎞
ρ = × =⎜ ⎟
⎝ ⎠
ρ = =
+
⎛ ⎞
ρ = × =⎜ ⎟
⎝ ⎠
3
bm
ft
(see Appendix A)
© 2011 Pearson Education, Inc., Upper Saddle River, NJ. All rights reserved. This publication is protected by Copyright and written permission should be obtained
from the publisher prior to any prohibited reproduction, storage in a retrieval system, or transmission in any form or by any means, electronic, mechanical, photocopying,
recording, or likewise. For information regarding permission(s), write to: Rights and Permissions Department, Pearson Education, Inc., Upper Saddle River, NJ 07458.
- 15. Index and Classification Properties of Soils Chapter 2
2.24. A sample of soil plus container weighs 397.6 g when the initial water content is 6.3%. The
container weighs 258.7 g. How much water needs to be added to the original specimen if the
water content is to be increased by 3.4%? After U.S. Dept. of Interior (1990).
SOLUTION:
t
w s
t w s s s s
s
w
s
w s
M 397.6 258.7 138.9 g
M 0.063M
M 138.9 M M 0.063M M 1.063M
M 130.668 g
M
w 0.034
M
M w M (0.034)(130.668) 4.44 g
= − =
=
= = + = + =
=
Δ
Δ = =
Δ = Δ × = =
2.25. A water-content test was made on a sample of clayey silt. The weight of the wet soil plus
container was 18.46 g, and the weight of the dry soil plus container was 15.03 g. Weight of the
empty container was 7.63 g. Calculate the water content of the sample.
SOLUTION:
s
w
w
s
M 15.03 7.63 7.40 g
M 18.46 15.03 3.43 g
M 3.43(100)
(a) w 100% 46.351 46.3%
M 7.40
= − =
= − =
= × = = =
© 2011 Pearson Education, Inc., Upper Saddle River, NJ. All rights reserved. This publication is protected by Copyright and written permission should be obtained
from the publisher prior to any prohibited reproduction, storage in a retrieval system, or transmission in any form or by any means, electronic, mechanical, photocopying,
recording, or likewise. For information regarding permission(s), write to: Rights and Permissions Department, Pearson Education, Inc., Upper Saddle River, NJ 07458.
- 16. Index and Classification Properties of Soils Chapter 2
2.26. A soil sample is dried in a microwave oven to determine its water content. From the data
below, evaluate the water content and draw conclusions. The oven-dried water content is 23.7%.
The mass of the dish is 146.30 grams. After U.S. Dept. of Interior (1990).
SOLUTION:
t
w s
s s
s
M 231.62 146.3 85.32 g
M (0.237)M
85.32 0.237M M
M 68.9733 g (this value is constant throughout drying period)
231.62 column 3
column 5 = 100%
68.9733
= − =
=
= +
=
−
×
CONCLUSION: The loss of additional water in the soil sample becomes negligible after 8 to 10
minutes in the microwave oven used in the experiment.
GIVEN CALCULATED
Time in Total Oven Mass of Mass of Water
Oven Time Soil + Dish Water Content
(min) (min) (g) (g) (%)
0 0 231.62 -- --
3 3 217.75 13.87 20.11
1 4 216.22 15.40 22.33
1 5 215.72 15.90 23.05
1 6 215.48 16.14 23.40
1 7 215.32 16.30 23.63
1 8 215.22 16.40 23.78
1 9 215.19 16.43 23.82
1 10 215.19 16.43 23.82
19.0
20.0
21.0
22.0
23.0
24.0
25.0
0 1 2 3 4 5 6 7 8 9 10 11
Time in Oven (min)
WaterContent(%)
© 2011 Pearson Education, Inc., Upper Saddle River, NJ. All rights reserved. This publication is protected by Copyright and written permission should be obtained
from the publisher prior to any prohibited reproduction, storage in a retrieval system, or transmission in any form or by any means, electronic, mechanical, photocopying,
recording, or likewise. For information regarding permission(s), write to: Rights and Permissions Department, Pearson Education, Inc., Upper Saddle River, NJ 07458.
- 17. Index and Classification Properties of Soils Chapter 2
2.27. The mass of a sample of silty clay soil plus container is 18.43 g and the weight of the dry
soil plus container is 13.67 g. The container weighs 8.84 g. Compute the water content of the
sample.
SOLUTION:
s
w
w
s
M 13.67 8.84 4.83 g
M 18.43 13.67 4.76 g
M 4.76(100)
(a) w 100% 98.5%
M 4.83
= − =
= − =
= × = =
2.28. A specimen of fully saturated clay soil that weighs 1389 g in its natural state weighs 982 g
after drying. What is the natural water content of the soil?
SOLUTION:
w
w
s
M 1389 982 407 g
M 407(100)
(a) w 100% 41.4%
M 982
= − =
= × = =
2.29. The volume of water in a sample of moist soil is 0.24 m3
. The volume of solids Vs is 0.25
m3
. Given that the density of soil solids ρs is 2600 kg/m3
, find the water content.
SOLUTION:
s s s
w w w
M V (2600)(0.25) 650 kg
M V (1000)(0.24) 240 kg
240
w 100% 36.9%
650
= ρ × = =
= ρ × = =
= × =
2.30. For the soil sample of Problem 2.29, compute (a) the void ratio and (b) the porosity.
SOLUTION: Assume S = 100%
sG w (2.6)(0.3692)
(a) e 0.96
S (1)
0.96
(b) n 100 50.0%
1 0.96
= = =
= × =
+
© 2011 Pearson Education, Inc., Upper Saddle River, NJ. All rights reserved. This publication is protected by Copyright and written permission should be obtained
from the publisher prior to any prohibited reproduction, storage in a retrieval system, or transmission in any form or by any means, electronic, mechanical, photocopying,
recording, or likewise. For information regarding permission(s), write to: Rights and Permissions Department, Pearson Education, Inc., Upper Saddle River, NJ 07458.
- 18. Index and Classification Properties of Soils Chapter 2
2.31. For the soil sample of Problem 2.29, compute (a) the total or wet density and (b) the dry
density. Give your answers in Mg/m3
, kg/m3
, and lbf/ft3
.
SOLUTION: Assume S = 100%
3 3 3
3 3 3
3
t
kg Mg lbm
t m m ft
kg Mg lbm
dry m m ft
(a) V 0.25 0.24 0.49 m
710
1448.98 1.45 90.4
0.49
650
(b) 1326.53 1.33 82.8
0.49
= + =
ρ = = = =
ρ = = = =
2.32. A 592-cm3
volume of moist sand weighs 1090 g. Its dry weight is 920 g and the density of
solids is 2680 kg/m3
. Compute the void ratio, porosity, water content, degree of saturation, and
total density in kg/m3
.
SOLUTION:
3 3
kg g
s m cm
3
s
3
v
v
s
w
3
w
w
w
v
2680 2.68
920
V 343.284 cm
2.68
V 592 343.284 248.716 cm
V 248.716
(a) e 0.7245 0.72
V 343.284
0.7245
(b) n 100% 42.0%
1 0.7245
(c) M 1090 920 170 g
170
V 170 cm
V 170
S 100% 100 68.4%
V 248.716
(d
ρ = =
= =
= − =
= = = =
= × =
+
= − =
= =
ρ
= × = × =
3 3
g kg
t cm m
1090
) 1.841 1841
592
ρ = = =
© 2011 Pearson Education, Inc., Upper Saddle River, NJ. All rights reserved. This publication is protected by Copyright and written permission should be obtained
from the publisher prior to any prohibited reproduction, storage in a retrieval system, or transmission in any form or by any means, electronic, mechanical, photocopying,
recording, or likewise. For information regarding permission(s), write to: Rights and Permissions Department, Pearson Education, Inc., Upper Saddle River, NJ 07458.
- 19. Index and Classification Properties of Soils Chapter 2
2.33. The saturated density γsat of a soil is 137 lbf/ft3
. Find the buoyant density of this soil in both
lbf/ft3
and kg/m3
.
SOLUTION:
( )
3
3
3 3
3
lbf
ft
kg
m kglbf
ft mlbm
ft
' 137 62.4 74.6
16.018
' 74.6 1195
1
γ = − =
⎛ ⎞
ρ = =⎜ ⎟⎜ ⎟
⎝ ⎠
2.34. A sand is composed of solid constituents having a density of 2.68 Mg/m3. The void ratio is
0.58. Compute the density of the sand when dry and when saturated and compare it with the
density when submerged.
SOLUTION:
3
3
3
3
s
3
v t
Mg
dry m
3
w v
w
t
Mg
sat m
Mg
m
Assume V 1m
V 0.58, V 1 0.58 1.58 m
2.68
1.6962 1.70
1.58
For S = 100%; V V 0.58 m
M (1)(0.58) 0.58 Mg
M 2.68 0.58 3.26 Mg
3.26
2.06
1.58
' 2.06 1.0 1.06
=
= = + =
ρ = = =
= =
= =
= + =
ρ = =
ρ = − =
© 2011 Pearson Education, Inc., Upper Saddle River, NJ. All rights reserved. This publication is protected by Copyright and written permission should be obtained
from the publisher prior to any prohibited reproduction, storage in a retrieval system, or transmission in any form or by any means, electronic, mechanical, photocopying,
recording, or likewise. For information regarding permission(s), write to: Rights and Permissions Department, Pearson Education, Inc., Upper Saddle River, NJ 07458.
- 20. Index and Classification Properties of Soils Chapter 2
2.35. A sample of natural glacial till was taken from below the groundwater table. The water
content was found to be 52%. Estimate the wet density, dry density, buoyant density, porosity,
and void ratio. Clearly state any necessary assumptions.
SOLUTION:
3
3
s s
s s s s w s
t
3w w
w v w v
v w
3
t
Mg
t m
dry
Assume V 1m , Assume G 2.7
M G V (2.7)(1)(1) 2.7 Mg, M w M (0.52)(2.7) 1.404 Mg
M 2.7 1.404 4.104 Mg
V M
S 1 V V , V 1.404 m V
V
V 1.404 1.0 2.404 m
4.104
(a) 1.71
2.404
2.7
(b) 1.
2.404
= =
= × × ρ = = = × = =
= + =
= = → = = = =
ρ
= + =
ρ = =
ρ = = 3
3
Mg
m
Mg
m
12
(c) ' 1.71 1.0 0.71
1.404
(d) n 100% 58.4%
2.404
1.404
(e) e 1.4
1.0
ρ = − =
= × =
= =
2.36. A 1-m3
sample of moist soil weighs 2000 kg. The water content is 10%. Assume ρs = 2.70
Mg/m3
. With this information, fill in all blanks in the phase diagram of Fig. P2.36.
SOLUTION:
w s s
t s s s s
w
3 3s
s w
s
3 3
v a
M M w 0.10M
M 2000 M 0.10M 1.10M M 1818.18 kg
M (0.10)(1818.18) 181.82 kg
M 1818.18 181.82
V 0.673 m , V 0.181m
2700 1000
V 1 0.673 0.327 m , V 0.327 0.181 0.146 m
= × =
= = + = → =
= =
= = = = =
ρ
= − = = − =
air
water
solid
Mw = 182
Ms = 1818
Mt = 2000Vw = 0.18
Vs = 0.67
Va = 0.15
Vv = 0.33
Mass (kg)Volume (m3)
Vt = 1.0
© 2011 Pearson Education, Inc., Upper Saddle River, NJ. All rights reserved. This publication is protected by Copyright and written permission should be obtained
from the publisher prior to any prohibited reproduction, storage in a retrieval system, or transmission in any form or by any means, electronic, mechanical, photocopying,
recording, or likewise. For information regarding permission(s), write to: Rights and Permissions Department, Pearson Education, Inc., Upper Saddle River, NJ 07458.
- 21. Index and Classification Properties of Soils Chapter 2
2.37. For the information given in Problem 2.36, calculate (a) the void ratio, (b) the porosity, and
(c) the dry density.
SOLUTION:
3
kg
dry m
0.327
(a) e 0.4859 0.49
0.673
0.327
(b) n 100 32.7%
1.0
1818.18
(c) 1818
1.0
= = =
= × =
ρ = =
2.38. The void ratio of clay soil is 0.6 and the degree of saturation is 75%. Assuming the density
of the solids is 2710 kg/m3
, compute (a) the water content and (b) dry and wet densities in both SI
and British engineering units.
SOLUTION:
3
s
3 3
v s w v
3
t
w w w s s s
t
w
s
s
dry
t
Assume V 1.0 m
V e V (0.6)(1.0) 0.6 m , V S V (0.75)(0.6) 0.45 m
V 0.6 1.0 1.6 m
M V (1000)(0.45) 450 kg, M V (2710)(1.0) 2710 kg
M 450 2710 3160 kg
M 450
(a) w 100 100 16.6 %
M 2710
M 27
(b)
V
=
= × = = = × = =
= + =
= ρ × = = = ρ × = =
= + =
= × = × =
ρ = =
( )
( )
3
3
3 3
3
3
3
kg
m
lbm
ftkg lbm
dry m ftkg
m
t kg
t m
t
lbm
t ft
10
1693.75 1694
1.6
1
1694 105.8
16.018
M 3160
1975
V 1.6
1(1975) 123.3
16.018
= =
⎛ ⎞
ρ = =⎜ ⎟⎜ ⎟
⎝ ⎠
ρ = = =
ρ = =
© 2011 Pearson Education, Inc., Upper Saddle River, NJ. All rights reserved. This publication is protected by Copyright and written permission should be obtained
from the publisher prior to any prohibited reproduction, storage in a retrieval system, or transmission in any form or by any means, electronic, mechanical, photocopying,
recording, or likewise. For information regarding permission(s), write to: Rights and Permissions Department, Pearson Education, Inc., Upper Saddle River, NJ 07458.
- 22. Index and Classification Properties of Soils Chapter 2
2.39. A specimen of saturated glacial clay has a water content of 38%. On the assumption that ρs
= 2.70 Mg/m3
, compute the void ratio, porosity, and saturated density.
SOLUTION:
3
Mg
s m
s
w
s w Mg
sat m
w = 38%, S = 100%, 2.70
w (38.0)(2.70)
(a) From Eq. 2.15: e 1.026 1.03
S (100)(1.0)
e 1.026
(b) n 100 100 50.6 %
1 e 1 1.026
e (2.70) (1.0)(1.026)
(c) From Eq. 2.17: 1.8391 1.84
1 e 1 1.026
ρ =
ρ
= = = =
ρ
= × = × =
+ +
ρ + ρ +
ρ = = = =
+ +
3
2.40. The values of minimum e and maximum e for a pure silica sand were found to be 0.50 and
0.70, respectively. What is the corresponding range in the saturated density in kg/m3
?
SOLUTION:
3
3
s w
sat
Mg
sat m
Mg
sat m
e
Eq. 2.17:
1 e
(2.70) (1.0)(0.50)
maximum : 2.13
1 0.50
(2.70) (1.0)(0.70)
minimum : 2.00
1 0.70
ρ + ρ
ρ =
+
+
ρ = =
+
+
ρ = =
+
© 2011 Pearson Education, Inc., Upper Saddle River, NJ. All rights reserved. This publication is protected by Copyright and written permission should be obtained
from the publisher prior to any prohibited reproduction, storage in a retrieval system, or transmission in any form or by any means, electronic, mechanical, photocopying,
recording, or likewise. For information regarding permission(s), write to: Rights and Permissions Department, Pearson Education, Inc., Upper Saddle River, NJ 07458.
- 23. Index and Classification Properties of Soils Chapter 2
2.41. Calculate the maximum possible porosity and void ratio for a collection of (a) tennis balls
(assume they are 64.14 mm in diameter) and (b) tiny ball bearings 0.3 mm in diameter.
SOLUTION:
Three-dimensional particle arrangement of equal spheres has been studied in depth by
mathematicians, statisticians, and materials scientists since the 1600s. A quick internet search
on packing of equal spheres will reveal numerous mathematical theories and approaches for
estimating the densest and loosest possible packing. In general, the loosest arrangement of
equal spheres yields a void fraction of about 0.48, regardless of sphere size. As an aside, the
densest possible packing of equal-size spheres yields a solids volume of about:
sV 0.7405.
18
π= = (These values are approximate – there is not a unified consensus in the
literature.)
t v s
v
max
t
v
max
s
s v
min
Loosest packing
For V 1.0, V 0.48, and V 1 0.48 0.52
thus;
V 0.48
n 100 100 48 %
V 1.0
V 0.48
e 0.92
V 0.52
Densest packing (not required in problem statement)
V 0.7405, V 1.0 0.7405 0.2595
thus;
0
n
= = = − =
= × = × =
= = =
= = − =
=
min
.2595
100 26%
1.0
0.2595
e 0.35
0.7405
× =
= =
2.42. A plastic-limit test has the following results:
Wet weight + container = 23.12 g
Dry weight + container = 20.84 g
Container weight = 1.46 g
Compute the PL of the soil. Can the plastic limit be evaluated by a one-point method?
SOLUTION:
w s
w
s
W 23.12 20.84 2.28 g, W 20.84 1.46 19.38 g
W 2.28
PL 100 100 11.8
W 19.38
= − = = − =
= × = × =
The plastic limit cannot be evaluated using a one-point method.
2.43. During a plastic-limit test, the following data was obtained for one of the samples:
Wet weight + container = 23.13 g
© 2011 Pearson Education, Inc., Upper Saddle River, NJ. All rights reserved. This publication is protected by Copyright and written permission should be obtained
from the publisher prior to any prohibited reproduction, storage in a retrieval system, or transmission in any form or by any means, electronic, mechanical, photocopying,
recording, or likewise. For information regarding permission(s), write to: Rights and Permissions Department, Pearson Education, Inc., Upper Saddle River, NJ 07458.
- 24. Index and Classification Properties of Soils Chapter 2
Dry weight + container = 19.12 g
Container weight = 1.50 g
What is the PL of the soil?
SOLUTION:
w s
w
s
W 23.13 19.12 4.01g, W 19.12 1.50 17.62 g
W 4.01
PL 100 100 22.8
W 17.62
= − = = − =
= × = × =
2.44. The degree of saturation of a cohesive soil is 100%. The clay when wet weighs 1489 g and
after drying weighs only 876 g. Find the water content of the soil. Draw a phase diagram and
properly label it.
SOLUTION:
3
t s
w t
w
s
3 3w w
w vg
w cm
s
3 3s
s t
s w
S 100%, M 1489 g, M 876 g
M 1489 876 613 g; M 876 613 1489 g
M 613
w 100 100 70.0%
M 876
M V613 613
V 613 cm , V 613 cm
1.0 S 1.0
Assume G 2.70
M 876
thus; V 324.4 cm ; V 613 324 937 cm
G (2.7)(1.0)
= = =
= − = = + =
= × = × =
= = = = = =
ρ
=
= = = = + =
ρ
air
water
solid
Mw = 613
Ms = 876
Mt = 1489Vw = 613
Vs = 324
Va
Vv = 613
Mass (g)Volume (cm3)
Vt = 937
2.45. For the soil in the previous problem, compute the void ratio and the porosity. Does your
answer compare with what you would expect for a saturated cohesive soil?
SOLUTION:
v v
s t
V V613 613
e 1.89; n 100% 100 65.4%
V 324 V 937
= = = = × = × =
2.46. For the soil in the previous two problems, compute (a) the total or wet density and (b) the
dry density. Provide your answers in units of Mg/m3
, kN/m3
, and lbf/ft3
.
SOLUTION:
© 2011 Pearson Education, Inc., Upper Saddle River, NJ. All rights reserved. This publication is protected by Copyright and written permission should be obtained
from the publisher prior to any prohibited reproduction, storage in a retrieval system, or transmission in any form or by any means, electronic, mechanical, photocopying,
recording, or likewise. For information regarding permission(s), write to: Rights and Permissions Department, Pearson Education, Inc., Upper Saddle River, NJ 07458.
- 25. Index and Classification Properties of Soils Chapter 2
3 3
3 3
3 3
3 3
t g Mg
t cm m
t
lbfkN
t m ft
s g Mg
dry cm m
t
lbfkN
dry m ft
M 1489
(a) 1.5891 1.59
V 937
15.59 99.2
M 876
(b) 0.9349 0.93
V 937
9.17 58.3
ρ = = = =
γ = =
ρ = = = =
γ = =
2.47. A soil specimen had a buoyant density of 73 pounds per cubic foot. Calculate its wet
density in kg/m3
.
SOLUTION:
3 3
3
lb lb
t sat wft ft
kg
t m
' 73 ; ' 73 62.4 135.4
(135.4)(16.018) 2169
γ = γ = γ = γ + γ = + =
ρ = =
© 2011 Pearson Education, Inc., Upper Saddle River, NJ. All rights reserved. This publication is protected by Copyright and written permission should be obtained
from the publisher prior to any prohibited reproduction, storage in a retrieval system, or transmission in any form or by any means, electronic, mechanical, photocopying,
recording, or likewise. For information regarding permission(s), write to: Rights and Permissions Department, Pearson Education, Inc., Upper Saddle River, NJ 07458.
- 26. Index and Classification Properties of Soils Chapter 2
2.53. The “chunk density” method is often used to determine the unit weight of a specimen of
irregular shape. A specimen of cemented silty sand is treated in this way to obtain the “chunk
density.” From the information given below, determine the (a) wet density, (b) dry density, (c) void
ratio, and (d) degree of saturation of the sample.
Mass of specimen at natural water content in air = 181.8 g
Mass of specimen + wax coating in air = 215.9 g
Mass of specimen + wax in water = 58.9 g Natural water content = 2.5%
Soil solid density = 2650 kg/m3
Wax solid density = 940 kg/m3
SOLUTION:
3 3
t s t
s w t s
s
3 3s w
s wg g
s wcm cm
3wax
wax t wax t wax
wax
water
M M M 181.8
w M 177.366 g M M M 181.8 177.4 4.43 g
M 1 w 1 .025
M M177.366 g 4.43 g
V 66.93 cm V 4.43 cm
2.650 1.0
M 34.1
M M M 215.9 181.8 34.1g V 36.28 cm
0.940
M
+
−
= → = = = → = − = − =
+ +
= = = → = = =
ρ ρ
= − = − = → = = =
ρ
displaced t wax water displaced water displaced
water displaced 3
t wax
w
3
air t wax wax w s
3
v air w t t w
M M M 215.9 58.9 157.0 g
M 157.0
V 157.0 cm
1.0
V V V V V 157.0 36.28 4.43 66.93 49.36 cm
V V V 49.36 4.43 53.79 cm V V
+
+
+
+
= − → = − =
= = =
ρ
= − − − = − − − =
= + = + = → =
3
3
3
ax wax
t Mg
t m
t
s Mg
dry m
t
v
s
w
v
V 157.0 36.28 120.72 cm
M 181.8
(a) 1.50
V 120.72
M 177.366
(b) 1.47
V 120.72
V 53.79
(c) e 0.80
V 66.93
V 4.43
(d) S 100% 100 8.2 %
V 53.79
− = − =
ρ = = =
ρ = = =
= = =
= × = × =
air
water
solid
Mw = 4.43
Ms = 177.4
Mt = 181.1Vw = 4.43
Vs = 66.93
Va = 49.36
Vv = 53.79
Mass (g)Volume (cm3)
Vt = 120.72
wax Mwax = 34.1Vwax = 36.28
Vt+wax = 157.0
© 2011 Pearson Education, Inc., Upper Saddle River, NJ. All rights reserved. This publication is protected by Copyright and written permission should be obtained
from the publisher prior to any prohibited reproduction, storage in a retrieval system, or transmission in any form or by any means, electronic, mechanical, photocopying,
recording, or likewise. For information regarding permission(s), write to: Rights and Permissions Department, Pearson Education, Inc., Upper Saddle River, NJ 07458.
- 27. Index and Classification Properties of Soils Chapter 2
2.54. A sensitive volcanic clay soil was tested in the laboratory and found to have the following
properties:
(a) ρ = 1.28 Mg/m3
, (b) e = 0.90, (c) S = 95%, (d) ρs = 2.75 Mg/m3
, (e) w = 311%.
In rechecking the above values, one was found to be inconsistent with the rest. Find the
inconsistent value and report it correctly. Show all your computations and phase diagrams.
SOLUTION:
3
s
s s s w s
t s w
3t
t
t
Assume V 1cm
M V 2.75 Mg; M w M (3.11)(2.75) 8.55 Mg
M M M 2.75 8.55 11.30 Mg
M 11.30
(1) V 8.83 cm
1.28
=
= ρ × = = × = =
= + = + =
= = =
ρ
3 3w
v s w
w
3 3
t v s
s
t
M 8.55
V e V (9)(1) 9 cm ; V 8.55 cm
1.0
(2) V V V 9 1 10 cm 8.83 cm
check : G w Se
(2.65)(3.11) (0.95)(9.0)
8.55 8.55 These values are in correct proportion.
Consequently, the error must be in the
= × = = = = =
ρ
= + = + = ≠
=
=
= →
ρ
3
3
t Mg
t m
t
Mg
t m
value.
M 11.30
Re-calculate 1.13
V 10
Solution : 1.13
ρ = = =
ρ =
air
water
solid
Mw = 8.55
Ms = 2.75
Mt = 11.30Vw = 8.55
Vs = 1.0
Va
Vv = 9.0
Mass (Mg)Volume (m3)
Vt = 8.83 or
10.0?
© 2011 Pearson Education, Inc., Upper Saddle River, NJ. All rights reserved. This publication is protected by Copyright and written permission should be obtained
from the publisher prior to any prohibited reproduction, storage in a retrieval system, or transmission in any form or by any means, electronic, mechanical, photocopying,
recording, or likewise. For information regarding permission(s), write to: Rights and Permissions Department, Pearson Education, Inc., Upper Saddle River, NJ 07458.
- 28. Index and Classification Properties of Soils Chapter 2
2.55. A cylinder contains 510 cm3
of loose dry sand which weighs 740 g. Under a static load of
200 kPa the volume is reduced 1%, and then by vibration it is reduced 10% of the original
volume. Assume the solid density of the sand grains is 2.65 Mg/m3
. Compute the void ratio,
porosity, dry density, and total density corresponding to each of the following cases:
(a) Loose sand. (b) Sand under static load. (c) Vibrated and loaded sand.
SOLUTION:
3s
s t
s
w w
3
t
3
v t s
v v
s t
s
dry
t
M 740
V 279.24 cm ; M 740 g;
2.65
dry sand: M V 0.0
(a) Loose sand - initial condition
V 510 cm
V V V 510 279.24 230.75 cm
V V230.75 230.75
e 0.83; n 100% 100 45.2%
V 279.24 V 510
M 740
1.
V 510
= = = =
ρ
= =
=
= − = − =
= = = = × = × =
ρ = = = 3 3
3
3 3
g Mg
cm m
Mg
dry t m
3
t
3
v t s
v v
s t
s g Mg
dry cm m
t
d
45 1.45
1.45
(b) Sand under static load
510
V 504.95 cm
1.01
V V V 504.95 279.24 225.71 cm
V V225.71 225.71
e 0.81; n 100% 100 44.2%
V 279.24 V 510
M 740
1.47 1.47
V 504.95
=
ρ = ρ =
= =
= − = − =
= = = = × = × =
ρ = = = =
ρ 3
3 3
Mg
ry t m
3
t
3
v t s
v v
s t
s g Mg
dry cm m
t
dry t
1.47
(c) Vibrated and loaded sand
510
V 454.54 cm
1.10
V V V 454.54 279.24 175.30 cm
V V175.30 175.30
e 0.63; n 100% 100 38.6%
V 279.24 V 454.54
M 740
1.63 1.63
V 454.54
1.6
= ρ =
= =
= − = − =
= = = = × = × =
ρ = = = =
ρ = ρ = 3
Mg
m
3
© 2011 Pearson Education, Inc., Upper Saddle River, NJ. All rights reserved. This publication is protected by Copyright and written permission should be obtained
from the publisher prior to any prohibited reproduction, storage in a retrieval system, or transmission in any form or by any means, electronic, mechanical, photocopying,
recording, or likewise. For information regarding permission(s), write to: Rights and Permissions Department, Pearson Education, Inc., Upper Saddle River, NJ 07458.
- 29. Index and Classification Properties of Soils Chapter 2
2.56. On five-cycle semilogarithmic paper, plot the grain-size distribution curves from the
following mechanical analysis data on six soils, A through F. For each soil determine the effective
size as well as the uniformity coefficient and the coefficient of curvature. Determine also the
percentages of gravel, sand silt, and clay according to (a) ASTM, (b) AASHTO, (c) USCS, and (d)
the British Standard.
continued next page
© 2011 Pearson Education, Inc., Upper Saddle River, NJ. All rights reserved. This publication is protected by Copyright and written permission should be obtained
from the publisher prior to any prohibited reproduction, storage in a retrieval system, or transmission in any form or by any means, electronic, mechanical, photocopying,
recording, or likewise. For information regarding permission(s), write to: Rights and Permissions Department, Pearson Education, Inc., Upper Saddle River, NJ 07458.
- 30. Index and Classification Properties of Soils Chapter 2
2.56. continued.
SOLUTION:
( )
2
3060
u c
10 60 10
DD
C C
D D D
= =
×
SILT or CLAY
Particle Size Distribution
Grain size in millimeters
0.0010.010.1110100
Percentfinerbyweight
0
10
20
30
40
50
60
70
80
90
100
0
10
20
30
40
50
60
70
80
90
100
Soil A
Soil B
Soil C
Soil D
Soil E
Soil F
SANDGRAVEL
Coarse Fine Course Medium Fine
Soil Type:
Description:
Depth:
LL: PL: PI:
Cu =
Cc =
LEGEND
Soil Effective Size D30 D60 Cu Cc
D10 (mm) (mm) (mm)
A 0.6 6 28 46.7 2.1
B 0.005 0.04 0.09 18.0 3.6
C 0.001 0.06 1 1000.0 3.6
D 0.16 0.22 0.3 1.9 1.0
E 0.006 0.015 0.1 16.7 0.4
F N/D N/D 0.003 N/D N/D
continued next page
© 2011 Pearson Education, Inc., Upper Saddle River, NJ. All rights reserved. This publication is protected by Copyright and written permission should be obtained
from the publisher prior to any prohibited reproduction, storage in a retrieval system, or transmission in any form or by any means, electronic, mechanical, photocopying,
recording, or likewise. For information regarding permission(s), write to: Rights and Permissions Department, Pearson Education, Inc., Upper Saddle River, NJ 07458.
- 31. Index and Classification Properties of Soils Chapter 2
2.56. continued.
(a) Percentages according to ASTM.
Soil Gravel Sand Silt Clay
(%) (%) (%) (%)
A 73 23 4 0
B 12 33 45 10
C 19 49 18 14
D 0 100 0 0
E 0 43 49 8
F 0 0 29 71
(b) Percentages according to AASHTO.
Soil Gravel Sand Silt Clay
(%) (%) (%) (%)
A 80 16 4 0
B 18 27 45 10
C 30 38 18 14
D 0 100 0 0
E 11 32 49 8
F 0 0 29 71
(c) Percentages according to USCS.
Soil Gravel Sand Silt Clay
(%) (%) (%) (%)
A 73 23 -- --
B 12 33 -- --
C 19 49 -- --
D 0 100 -- --
E 0 43 -- --
F 0 0 -- --
(d) Percentages according to the British Standard.
Soil Gravel Sand Silt Clay
(%) (%) (%) (%)
A 80 16 4 0
B 18 27 53 2
C 30 38 21 11
D 0 100 0 0
E 11 32 57 0
F 0 0 48 52
32
0
57
100
Fines
(silt + clay)
4
55
32
0
57
100
Fines
(silt + clay)
4
55
32
0
57
100
Fines
(silt + clay)
4
55
32
0
57
100
Fines
(silt + clay)
4
55
© 2011 Pearson Education, Inc., Upper Saddle River, NJ. All rights reserved. This publication is protected by Copyright and written permission should be obtained
from the publisher prior to any prohibited reproduction, storage in a retrieval system, or transmission in any form or by any means, electronic, mechanical, photocopying,
recording, or likewise. For information regarding permission(s), write to: Rights and Permissions Department, Pearson Education, Inc., Upper Saddle River, NJ 07458.
- 32. Index and Classification Properties of Soils Chapter 2
2.58. The soils in Problem 2.56 have the following Atterberg limits and natural water contents.
Determine the PI and LI for each soil and comment on their general activity.
SOLUTION: nw PL
PI LL PL; LI
PI
−
= − =
Property Soil A Soil B Soil C Soil D Soil E Soil F
wn (%) 27 14 14 11 8 72
LL 13 35 35 -- 28 60
PL 8 29 18 NP NP 28
PI 5 6 17 0 0 32
LI 3.8 -2.5 -0.24 -- -- 1.38
Soil A: very sensitive, highly active
Soil B: most likely a clay above the water table that has experienced a decrease in moisture
Soil C: most likely a clay above the water table that has experienced a decrease in moisture
Soil D: most likely a fine sand
Soil E: most likely a silt
Soil F: slightly sensitive and active
2.59. Comment on the validity of the results of Atterberg limits on soils G and H.
SOLUTION:
Based on Atterberg’s definitions: LL > PL > SL. Soil G violates the definitions because the SL >
PL (25 > 20). Soil H violates the definitions because the PL > LL (42 > 38).
© 2011 Pearson Education, Inc., Upper Saddle River, NJ. All rights reserved. This publication is protected by Copyright and written permission should be obtained
from the publisher prior to any prohibited reproduction, storage in a retrieval system, or transmission in any form or by any means, electronic, mechanical, photocopying,
recording, or likewise. For information regarding permission(s), write to: Rights and Permissions Department, Pearson Education, Inc., Upper Saddle River, NJ 07458.
- 33. Index and Classification Properties of Soils Chapter 2
2.60. The following data were obtained from a liquid-limit test on a silty clay. Two plastic-limit
determinations had water contents of 23.1% and 23.6%. Determine the LL, PI, the flow index, and
the toughness index. The flow index is the slope of the water content versus log of number of
blows in the liquid-limit test, and the toughness index is the PI divided by the flow index.
SOLUTION:
1 2
F
2
1
From the plot below, LL = 42.6
w w
Flow Index = slope = I 10.6 (from linear regresion of best fit line)
N
log
N
23.1 23.6
use average value of PL tests; PL 23.4
2
PI LL PL 42.6 23.4 19.2
Toughness I
−
= =
⎛ ⎞
⎜ ⎟
⎝ ⎠
+
= =
= − = − =
F
PI 19.2
ndex 1.81
I 10.6
= = =
Number of Blows
10
WaterContent(%)
30
32
34
36
38
40
42
44
46
48
50
15 20 30 40
LL = 42.6
Flow index = 10.6
© 2011 Pearson Education, Inc., Upper Saddle River, NJ. All rights reserved. This publication is protected by Copyright and written permission should be obtained
from the publisher prior to any prohibited reproduction, storage in a retrieval system, or transmission in any form or by any means, electronic, mechanical, photocopying,
recording, or likewise. For information regarding permission(s), write to: Rights and Permissions Department, Pearson Education, Inc., Upper Saddle River, NJ 07458.
- 34. Index and Classification Properties of Soils Chapter 2
2.61. Classify the following soils according to the USCS:
(a) A sample of well-graded gravel with sand has 73% fine to coarse subangular gravel, 25% fine
to coarse subangular sand, and 2% fines. The maximum size of the particles is 75 mm. The
coefficient of curvature is 2.7, while the uniformity coefficient is 12.4.
(b) A dark brown, wet, organic-odor soil has 100% passing the No. 200 sieve. The liquid limit is
32% (not dried, and is 21% when oven dried!) and the plastic index is 21% (not dried).
(c) This sand has 61% predominately fine sand, 23% silty fines, and 16% fine subrounded gravel
size. The maximum size is 20 mm. The liquid limit is 33% and the plastic limit is 27%.
(d) This material has 74% fine to coarse subangular reddish sand and 26% organic and silty dark
brown fines. The liquid limit (not dried) is 37% while it is 26% when oven dried. The plastic index
(not dried) is 6.
(e) Although this soil has only 6% nonplastic silty fines, it has everything else! It has gravel
content of 78% fine to coarse subrounded to subangular gravel, and 16% fine to coarse
subrounded to subangular sand. The maximum size of the subrounded boulders is 500 mm. The
uniformity coefficient is 40, while the coefficient of curvature is only 0.8. (After U.S. Dept. of the
Interior, 1990.)
SOLUTION: Refer to Table 2.7 and corresponding footnotes
(a) GW – Well-graded gravel with sand.
(b) OL -- Organic clay
(c) SM – Silty sand with gravel
(d) SM – Silty sand with organic fines
(e) GP-GM – Poorly graded gravel with silt, sand, cobbles, and boulders (or GP-GC)
2.62. Classify the five soils in the preceding question according to the AASHTO method of soil
classification.
SOLUTION:
(a) A-1-a
(b) A-8
(c) A-2-4
(d) A-2-4 or A-8
(e) A-1-a
© 2011 Pearson Education, Inc., Upper Saddle River, NJ. All rights reserved. This publication is protected by Copyright and written permission should be obtained
from the publisher prior to any prohibited reproduction, storage in a retrieval system, or transmission in any form or by any means, electronic, mechanical, photocopying,
recording, or likewise. For information regarding permission(s), write to: Rights and Permissions Department, Pearson Education, Inc., Upper Saddle River, NJ 07458.
- 35. Index and Classification Properties of Soils Chapter 2
2.63. The results of a sieve test below give the percentage passing through the sieve.
(a) Using a spreadsheet, plot the particle-size distribution.
(b) Calculate the uniformity coefficient.
(c) Calculate the coefficient of curvature.
Sieve Percent Finer by Weight
½” 71
No. 4 37
No. 10 32
No. 20 23
No. 40 11
No. 60 7
No. 100 4
SOLUTION:
( )
2
2
3060
u c
10 60 10
DD 9.5 (1.6)
C 24; C 0.69
D 0.39 D D (9.5)(0.39)
= = = = = =
×
Grain Size Distribution Plot
2"
2" 1"
1" 1/2"
1/2" #4
#4 #10
#10
#20
#20
#40
#40
#100
#100 #200
#200
0
10
20
30
40
50
60
70
80
90
100
0.010.101.0010.00100.00
Grain Diameter (mm)
%Passing
© 2011 Pearson Education, Inc., Upper Saddle River, NJ. All rights reserved. This publication is protected by Copyright and written permission should be obtained
from the publisher prior to any prohibited reproduction, storage in a retrieval system, or transmission in any form or by any means, electronic, mechanical, photocopying,
recording, or likewise. For information regarding permission(s), write to: Rights and Permissions Department, Pearson Education, Inc., Upper Saddle River, NJ 07458.
- 36. Index and Classification Properties of Soils Chapter 2
2.64. For the data given below, classify the soils according to the USCS. For each soil, give both
the letter symbol and the narrative description.
(a) 65% material retained on No. 4 sieve, 32% retained on No. 200 sieve. Cu = 3, Cc = 1.
(b) 100% material passed No. 4 sieve, 90% passed No. 200 sieve. LL = 23, PL = 17.
(c) 70% material retained on No. 4 sieve, 27% retained on No. 200 sieve. Cu = 5, Cc = 1.5.
SOLUTION:
(a) GP – Poorly graded gravel with sand
(b) CL-ML – Silty clay
(c) GW – Well-graded gravel with sand
2.65. A sample of soil was tested in the laboratory and the following grain size analysis results
were obtained. Classify this soil according to the USCS, providing the group symbol for it.
Sieve Sieve Opening (mm) Percent Coarser by Weight Percent Finer by Weight
1/2" 12.7 30 70
4 4.75 36 64
10 2.00 52 48
20 0.85 64 36
40 0.425 69 31
60 0.25 71 29
100 0.15 77 23
200 0.075 91 9
SOLUTION:
( )
2
2
3060
u c
10 60 10
(a) PI LL PL 26 23 3
DD 3.9 (0.4)
C 49; C 0.51 well graded
D 0.08 D D (3.9)(0.08)
SW-SM (Well-graded sand with silt)
= − = − =
= = = = = = →∴
×
70
64
48
36
31
29
23
9
2"
2" 1"
1" 1/2"
1/2" #4
#4 #10
#10
#20
#20
#40
#40
#100
#100 #200
#200
0
10
20
30
40
50
60
70
80
90
100
0.010.101.0010.00100.00
Grain Diameter (mm)
%Passing
© 2011 Pearson Education, Inc., Upper Saddle River, NJ. All rights reserved. This publication is protected by Copyright and written permission should be obtained
from the publisher prior to any prohibited reproduction, storage in a retrieval system, or transmission in any form or by any means, electronic, mechanical, photocopying,
recording, or likewise. For information regarding permission(s), write to: Rights and Permissions Department, Pearson Education, Inc., Upper Saddle River, NJ 07458.
- 37. Index and Classification Properties of Soils Chapter 2
2.66. A minus No. 40 material had a liquidity index of 0.73, a natural water content of 44.5%, and
a plasticity index of 24.7. Classify this soil according to the USCS, provide the group symbol.
SOLUTION:
w PL 44.5 PL
LI 0.73 PL 26.5
PI 24.7
PI LL PL; LL PI PL 24.7 26.5 51.2
CH (Fat clay)
− −
= = → =
= − = + = + =
2.67. A sample of soil was tested in the laboratory and the following grain size analysis results
were obtained. Classify this soil according to the USCS, providing the group symbol for it.
Sieve No. Sieve Opening (mm) Percent Coarser by Weight Percent Finer by Weight
4 4.75 37 63
10 2.00 52 48
20 0.85 64 36
40 0.425 69 31
60 0.25 71 29
100 0.15 77 23
200 0.075 90 10
SOLUTION:
( )
2
2
3060
u c
10 60 10
(a) PI LL PL 60 26 34
DD 4.75 (0.425)
C 63; C 0.51 well graded
D 0.075 D D (4.75)(0.075)
SW-SC (Well-graded sand with clay)
= − = − =
= = = = = = →∴
×
63
48
36
31
29
23
10
2"
2" 1"
1" 1/2"
1/2" #4
#4 #10
#10
#20
#20
#40
#40
#100
#100 #200
#200
0
10
20
30
40
50
60
70
80
90
100
0.010.101.0010.00100.00
Grain Diameter (mm)
%Passing
© 2011 Pearson Education, Inc., Upper Saddle River, NJ. All rights reserved. This publication is protected by Copyright and written permission should be obtained
from the publisher prior to any prohibited reproduction, storage in a retrieval system, or transmission in any form or by any means, electronic, mechanical, photocopying,
recording, or likewise. For information regarding permission(s), write to: Rights and Permissions Department, Pearson Education, Inc., Upper Saddle River, NJ 07458.
- 38. Index and Classification Properties of Soils Chapter 2
2.68. A sample of soil was tested in the laboratory and the following grain size analysis results
were obtained: Atterberg limits on minus No. 40 material were: LL = 36, PL = 14. Determine the
USCS classification symbol for this soil. Extra credit - determine the full AASHTO classification
for this soil (symbol plus group index).
Sieve No. Sieve Opening (mm) Percent Finer by Weight
4 4.75 100
10 2.00 100
20 0.85 100
40 0.425 94
60 0.25 82
100 0.15 66
200 0.075 45
Pan -- 0
SOLUTION:
PI LL PL 36 14 22
GI (F 35)[0.2 0.005(LL 40)] 0.01(F 15)(PI 10)
GI (45 35)[0.2 0.005(36 40)] 0.01(45 15)(22 10)
GI 5.4
= − = − =
= − + − + − −
= − + − + − −
=
(a) USCS: SC (Clayey Sand)
(b) AASHTO: A-6 (5)
Grain Size Distribution Plot
2"
2" 1"
1" 1/2"
1/2" #4
#4 #10
#10
#20
#20
#40
#40
#100
#100 #200
#200
0
10
20
30
40
50
60
70
80
90
100
0.010.101.0010.00100.00
Grain Diameter (mm)
%Passing
© 2011 Pearson Education, Inc., Upper Saddle River, NJ. All rights reserved. This publication is protected by Copyright and written permission should be obtained
from the publisher prior to any prohibited reproduction, storage in a retrieval system, or transmission in any form or by any means, electronic, mechanical, photocopying,
recording, or likewise. For information regarding permission(s), write to: Rights and Permissions Department, Pearson Education, Inc., Upper Saddle River, NJ 07458.
- 39. Index and Classification Properties of Soils Chapter 2
2.69. Laboratory testing was performed on two soil samples (A and B).
(a) Determine the USCS classification symbol for Sample A.
(b) Determine the AASHTO classification for Sample B.
Sieve No. Sieve Opening (mm) A - Percent Passing B - Percent Passing
3 inch 76.2 100
1.5 inch 38.1 98
0.75 inch 19.1 96
4 4.75 77 100
10 2.00 -- 96
20 0.85 55 94
40 0.425 -- 73
100 0.15 30 --
200 0.075 18 55
Liquid Limit 32 52
Plastic Limit 25 32
SOLUTION:
( )
2
2
3060
u c
10 60 10
(a) PI LL PL 32 25 7
DD 1.3 (0.15)
C 29.5; C 0.393 poorly graded
D 0.044 D D (1.3)(0.044)
USCS SM (Silty sand with gravel)
(b) PI LL PL 52 32 20; LL 30 52 30 22 32; A 7 5
GI (F 35)[0.2 0.005(LL 40)
= − = − =
= = = = = = →∴
×
→
= − = − = − = − = < ∴ − −
= − + − ] 0.01(F 15)(PI 10)
GI (55 35)[0.2 0.005(52 40)] 0.01(55 15)(20 10) 9.2
AASHTO A-7-5 (9)
+ − −
= − + − + − − =
→
100
98
96
77
55
30
18
100
96
94
73
55
2"
2" 1"
1" 1/2"
1/2" #4
#4 #10
#10
#20
#20
#40
#40
#100
#100 #200
#200
0
10
20
30
40
50
60
70
80
90
100
0.010.101.0010.00100.00
Grain Diameter (mm)
%Passing
Sample A Sample B
© 2011 Pearson Education, Inc., Upper Saddle River, NJ. All rights reserved. This publication is protected by Copyright and written permission should be obtained
from the publisher prior to any prohibited reproduction, storage in a retrieval system, or transmission in any form or by any means, electronic, mechanical, photocopying,
recording, or likewise. For information regarding permission(s), write to: Rights and Permissions Department, Pearson Education, Inc., Upper Saddle River, NJ 07458.
- 40. Index and Classification Properties of Soils Chapter 2
2.70. A sample of soil was tested in the laboratory and the following grain size analysis results
were obtained: Atterberg limits on minus No. 40 material were: LL = 62, PL = 20. Determine the
USCS letter symbol for this soil.
Sieve No. Sieve Opening (mm) Percent Coarser by Weight Percent Finer by Weight
4 4.75 0.0 100.0
10 2.00 5.1 94.9
20 0.85 10.0 90.0
40 0.425 40.7 59.3
60 0.25 70.2 29.8
100 0.15 84.8 15.2
200 0.075 90.5 9.5
Pan -- 100.0 0.0
SOLUTION:
( )
2
2
3060
u c
10 60 10
u
PI LL PL 62 20 42
DD 0.43 (0.25)
C 5.7 6; C 1.9
D 0.075 D D (0.43)(0.075)
The C value is close to 6. Technically, this soil classifies as poorly graded;
however, a well graded determination is
= − = − =
= = = ≅ = = =
×
not unreasonable.
USCS SP SC (Poorly graded sand with clay)→ −
Grain Size Distribution Plot
100.0
94.9
90.0
59.3
29.8
15.2
9.5
2"
2" 1"
1" 1/2"
1/2" #4
#4 #10
#10
#20
#20
#40
#40
#100
#100 #200
#200
0
10
20
30
40
50
60
70
80
90
100
0.010.101.0010.00100.00
Grain Diameter (mm)
%Passing
© 2011 Pearson Education, Inc., Upper Saddle River, NJ. All rights reserved. This publication is protected by Copyright and written permission should be obtained
from the publisher prior to any prohibited reproduction, storage in a retrieval system, or transmission in any form or by any means, electronic, mechanical, photocopying,
recording, or likewise. For information regarding permission(s), write to: Rights and Permissions Department, Pearson Education, Inc., Upper Saddle River, NJ 07458.
- 41. Index and Classification Properties of Soils Chapter 2
2.71. A sample of a brown sandy clay was obtained to determine its Atterberg limits and then
classify its soil type according to the Unified Soil Classification System. For one of the PL
determinations, the wet + dish = 11.53 g and the dry weight + dish = 10.49 g. The dish only
weighed 4.15 g. Compute the plastic limit. Another plastic limit was 16.9%. Three
determinations of the liquid limit were made. For 17 blows, the water content was 49.8%; for 26
blows, the water content was 47.5%; and for 36 blows, the water content was 46.3%. Evaluate
the soil type, indicate the information on a plasticity chart, and give the Unified Soil Classification
symbol.
SOLUTION:
w
s
w
PL
s
(avg)
M 11.53 10.49 1.04 g
M 10.49 4.15 6.34 g
M 1.04
w PL 100 100 16.4
M 6.34
16.4 16.9
PL 16.65; From plot below: LL = 48
2
PI 48 16.7 31
Based on Casagrande's plasticity chart (Fig. 2.13), the soil fines
= − =
= − =
= = × = × =
+
= =
= − =
classify as CL
USCS CL (Sandy lean clay)∴ →
Number of Blows
10
WaterContent(%)
40
42
44
46
48
50
52
54
56
58
60
15 20 30 40
LL = 48.0
Flow index = 10.8
© 2011 Pearson Education, Inc., Upper Saddle River, NJ. All rights reserved. This publication is protected by Copyright and written permission should be obtained
from the publisher prior to any prohibited reproduction, storage in a retrieval system, or transmission in any form or by any means, electronic, mechanical, photocopying,
recording, or likewise. For information regarding permission(s), write to: Rights and Permissions Department, Pearson Education, Inc., Upper Saddle River, NJ 07458.
Introduction to Geotechnical Engineering 2nd Edition Holtz Solutions Manual
Full Download: http://alibabadownload.com/product/introduction-to-geotechnical-engineering-2nd-edition-holtz-solutions-manual/
This sample only, Download all chapters at: alibabadownload.com