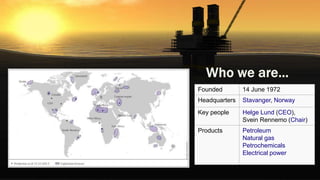
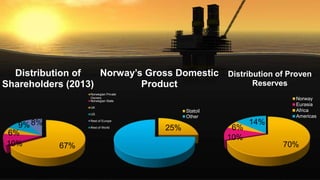
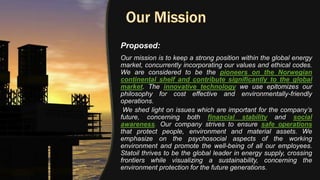
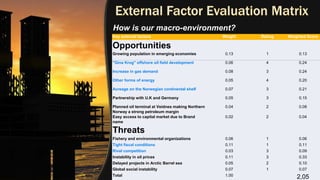
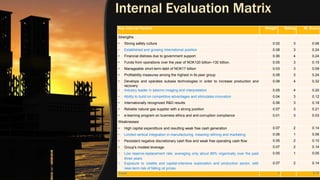
“Crossing energy frontiers”
Founded 14 June 1972
Headquarters Stavanger, Norway
Key people Helge Lund (CEO),
Svein Rennemo (Chair)
Products Petroleum
Natural gas
Petrochemicals
Electrical power
25%
Norway’s Gross Domestic
Product
Statoil
Other
67%10%
6%
9% 8%
Distribution of
Shareholders (2013)
Norwegian Private
Owners
Norwegian State
UK
US
Rest of Europe
Rest of World
70%
10%
6%
14%
Distribution of Proven
Reserves
Norway
Eurasia
Africa
Americas
“Imagine we’re on a journey. Our vision tells us
where we are heading. It reminds us what we’re
aiming to achieve. It brings us together. It motivates
us and drives change. Our vision tells the story of a
trusted pioneer:
Crossing energy frontiers.”
Existing:
“We strive to generate and serve a guide for people
who seek to cross new borders. We are crossing
energy frontiers, providing a sustainable well-being
for future generations.
Proposed:
“Our mission is the reason why we exist as a
company. It’s why we go to work every day. It’s what
we have to do to achieve our vision:
To accommodate the world’s energy needs in a
responsible manner, we apply technology and create
innovative business solutions. Our approach is
founded in a values-based performance culture, a
belief in cooperation and a striving for continuous
operational improvement.”
Existing:
Our mission is to keep a strong position within the global energy
market, concurrently incorporating our values and ethical codes.
We are considered to be the pioneers on the Norwegian
continental shelf and contribute significantly to the global
market. The innovative technology we use epitomizes our
philosophy for cost effective and environmentally-friendly
operations.
We shed light on issues which are important for the company’s
future, concerning both financial stability and social
awareness. Our company strives to ensure safe operations
that protect people, environment and material assets. We
emphasize on the psychosocial aspects of the working
environment and promote the well-being of all our employees.
Statoil thrives to be the global leader in energy supply, crossing
frontiers while visualizing a sustainability, concerning the
environment protection for the future generations.
Proposed:
Do we answer todays challenges?
Company Revenue Headquarters
Exxon Mobil 496,255 United States
Royal Dutch Shell 484,489 Netherlands
BP 386,463 United Kingdom
Sinopec 375,214 China
China National Petroleum
Corporation
352,338 China
Chevron Corporation 245,621 United States
Conoco Phillips 237,272 United States
Total 231,580 France
Gazprom 157,830 Russia
Eni 153,676 Italy
Petrobras 145,915 Brazil
GDF Suez 126,076 France
Pemex 125,344 Mexico
Valero Energy 125,095 United States
PDVSA 124,754 Venezuela
Statoil 119,561 Norway
JX Holdings 119,258 Japan
Lukoil 111,433 Russia
Petronas 97,355 Malaysia
Indian Oil 86,016 India
Rivalry
Barriers
Suppliers
Substitutes
Buyers
Competitive Profile Matrix
Statoil BP Chevron Total SA
Critical
Success
factors
Weight Rating Score Rating Score Rating Score Rating Score
Brand Name 0.12 2 0.24 4 0.48 3 0.36 3 0.36
Sustainability 0.13 3 0.39 2 0.26 2 0.26 3 0.39
Frequency of
accidents
0.05 2 0.10 1 0.05 3 0.15 3 0.15
Global
expansion
0.12 2 0.24 4 0.48 3 0.36 3 0.36
Market Share 0.18 2 0.36 3 0.54 3 0.54 2 0.36
Technology 0.16 1 0.16 4 0.64 3 0.48 4 0.64
Acquisition /
Partnership
0.15 3 0.45 3 0.45 2 0.30 2 0.30
Total 1 1.94 2.90 2.45 2.56
How competitive are we?
Key external factors Weight Rating Weighted Score
Opportunities
Growing population in emerging economies 0.13 1 0.13
''Gina Krog'' offshore oil field development 0.06 4 0.24
Increase in gas demand 0.08 3 0.24
Other forms of energy 0.05 4 0.20
Acreage on the Norwegian continental shelf 0.07 3 0.21
Partnership with U.K and Germany 0.05 3 0.15
Planned oil terminal at Veidnes making Northern
Norway a strong petroleum margin
0.04 2 0.08
Easy access to capital market due to Brand
name
0.02 2 0.04
Threats
Fishery and environmental organizations 0.06 1 0.06
Tight fiscal conditions 0.11 1 0.11
Rival competition 0.03 3 0.09
Instability in oil prices 0.11 3 0.33
Delayed projects in Arctic Barrel sea 0.05 2 0.10
Global social instability 0.07 1 0.07
Total 1.00
2,05
How is our macro-environment?
Liquidity /
Financial
Health
2010 2011 2012 2013
Current Ratio 1.09 1.16 1.12 1.43
Quick Ratio 0.87 0.92 0.93 1.22
Financial
Leverage
2.93 2.76 2.46 2.49
 Ratio < 1 company unable to pay
 Leverage is the amount of debt
used to finance a firm's assets
CONCLUSION
1. Current & Quick Ratio increased – easy to
pay back its liabilities.
2. Financial Leverage stable – good position in
transactions - a continues investment.
Growth 2011 2012 2013
Total Revenues
670.0 722.0 637.4
Net Operating Income
211.8 206.6 155.5
Net Income
78.4 69.5 39.2
25%
75%
Net Income
Taxes
Year 2013
73%
27%
Norway
International
54%
46% Net Operation
Income
Expenses
Year 2013
2%
98%
Net Operating Income
Expenses
Year 2013
88%
8%
3%
1% Upstream
Downstream
Fuel & Retail
Other
Key Internal Factors Weight Rating W. Score
Strengths
• Strong safety culture 0.02 3 0.06
• Established and growing international position 0.08 3 0.24
• Financial distress due to government support 0.06 4 0.24
• Funds from operations over the year of NOK120 billion–130 billion. 0.05 3 0.15
• Manageable short-term debt of NOK17 billion 0.03 3 0.09
• Profitability measures among the highest in its peer group 0.08 3 0.24
• Develops and operates subsea technologies in order to increase production and
recovery
0.08 4 0.32
• Industry leader in seismic imaging and interpretation 0.05 4 0.20
• Ability to build on competitive advantages and stimulates innovation 0.04 3 0.12
• Internationally recognized R&D results 0.06 3 0.18
• Reliable natural gas supplier with a strong position 0.07 3 0.21
• e-learning program on business ethics and anti-corruption compliance 0.01 3 0.03
Weaknesses
• High capital expenditure and resulting weak free cash generation 0.07 2 0.14
• Limited vertical integration in manufacturing, meaning refining and marketing. 0.06 1 0.06
• Persistent negative discretionary cash flow and weak free operating cash flow 0.05 2 0.10
• Group's modest leverage. 0.07 2 0.14
• Low reserve-replacement rate, averaging only about 86% organically over the past
three years
0.05 1 0.05
• Exposure to volatile and capital-intensive exploration and production sector, with
near-term risk of falling oil prices.
0.07 2 0.14
Total 1 2,71
Strengths-
S
Weaknesses -
W
Opportunities-O
SO-
Strategies
WO-Strategies
Threats-T
ST-
Strategies
WT-Strategies
 Matching Strengths, Weaknesses, Opportunities &
Threats in order to form strategies
 Market
Penetration
/Market
Development
 Partnerships
 Related
diversification
 Divestiture
RAPID MARKET GROWTH
SLOW MARKET GROWTH
STRONGCOMPETITIVEPOSITION
WEAKCOMPETITIVEPOSITION
 Annual decrease in sales → slow market growth
 Statoil ASA is considered to be in strong
competitive position
 Proposed Strategies: 1. Joint Ventures 2. Related
Diversification
 Based on two dimensions: IFE & EFE Scores
 Company belongs to V division → Hold & Maintain
Strategies
 Proposed Strategy: Market Penetration
Proposed
Strategic
Options
Internal –
External
(IE) Matrix
SWOT
Matrix
Grant
Strategy
Matrix
Market
Penetration
x x x
Market
development
x
Product
development
Horizontal
integration
Related
diversification
x x
Unrelated
diversification
Divestiture x
 List proposed strategies from the results of
the matching techniques (SWOT, GSM, IE
Matrix)
Existing Strategy:
 Upstream-oriented
 Merger, acquisition and partnership activities
 Long-term strategy
Proposed Strategy:
 Market Penetration
– Development
 Related
Diversification
through
Partnerships
 Emerging Trend in
Unconventional
Sources
 Geographical
Expansion/ Entrance
in new, challenging
market
 Increase of gas
demand in emerging
economies
Team Members:
F. Zachopoulos
S. Kosteroglou
S. Kyriakidis
E. Michailidi
A. Mitsis

Presentation for Statoil ASA case study

  • 1.
  • 2.
    Founded 14 June1972 Headquarters Stavanger, Norway Key people Helge Lund (CEO), Svein Rennemo (Chair) Products Petroleum Natural gas Petrochemicals Electrical power
  • 3.
    25% Norway’s Gross Domestic Product Statoil Other 67%10% 6% 9%8% Distribution of Shareholders (2013) Norwegian Private Owners Norwegian State UK US Rest of Europe Rest of World 70% 10% 6% 14% Distribution of Proven Reserves Norway Eurasia Africa Americas
  • 5.
    “Imagine we’re ona journey. Our vision tells us where we are heading. It reminds us what we’re aiming to achieve. It brings us together. It motivates us and drives change. Our vision tells the story of a trusted pioneer: Crossing energy frontiers.” Existing: “We strive to generate and serve a guide for people who seek to cross new borders. We are crossing energy frontiers, providing a sustainable well-being for future generations. Proposed:
  • 6.
    “Our mission isthe reason why we exist as a company. It’s why we go to work every day. It’s what we have to do to achieve our vision: To accommodate the world’s energy needs in a responsible manner, we apply technology and create innovative business solutions. Our approach is founded in a values-based performance culture, a belief in cooperation and a striving for continuous operational improvement.” Existing:
  • 7.
    Our mission isto keep a strong position within the global energy market, concurrently incorporating our values and ethical codes. We are considered to be the pioneers on the Norwegian continental shelf and contribute significantly to the global market. The innovative technology we use epitomizes our philosophy for cost effective and environmentally-friendly operations. We shed light on issues which are important for the company’s future, concerning both financial stability and social awareness. Our company strives to ensure safe operations that protect people, environment and material assets. We emphasize on the psychosocial aspects of the working environment and promote the well-being of all our employees. Statoil thrives to be the global leader in energy supply, crossing frontiers while visualizing a sustainability, concerning the environment protection for the future generations. Proposed:
  • 9.
    Do we answertodays challenges? Company Revenue Headquarters Exxon Mobil 496,255 United States Royal Dutch Shell 484,489 Netherlands BP 386,463 United Kingdom Sinopec 375,214 China China National Petroleum Corporation 352,338 China Chevron Corporation 245,621 United States Conoco Phillips 237,272 United States Total 231,580 France Gazprom 157,830 Russia Eni 153,676 Italy Petrobras 145,915 Brazil GDF Suez 126,076 France Pemex 125,344 Mexico Valero Energy 125,095 United States PDVSA 124,754 Venezuela Statoil 119,561 Norway JX Holdings 119,258 Japan Lukoil 111,433 Russia Petronas 97,355 Malaysia Indian Oil 86,016 India
  • 10.
  • 11.
    Competitive Profile Matrix StatoilBP Chevron Total SA Critical Success factors Weight Rating Score Rating Score Rating Score Rating Score Brand Name 0.12 2 0.24 4 0.48 3 0.36 3 0.36 Sustainability 0.13 3 0.39 2 0.26 2 0.26 3 0.39 Frequency of accidents 0.05 2 0.10 1 0.05 3 0.15 3 0.15 Global expansion 0.12 2 0.24 4 0.48 3 0.36 3 0.36 Market Share 0.18 2 0.36 3 0.54 3 0.54 2 0.36 Technology 0.16 1 0.16 4 0.64 3 0.48 4 0.64 Acquisition / Partnership 0.15 3 0.45 3 0.45 2 0.30 2 0.30 Total 1 1.94 2.90 2.45 2.56 How competitive are we?
  • 12.
    Key external factorsWeight Rating Weighted Score Opportunities Growing population in emerging economies 0.13 1 0.13 ''Gina Krog'' offshore oil field development 0.06 4 0.24 Increase in gas demand 0.08 3 0.24 Other forms of energy 0.05 4 0.20 Acreage on the Norwegian continental shelf 0.07 3 0.21 Partnership with U.K and Germany 0.05 3 0.15 Planned oil terminal at Veidnes making Northern Norway a strong petroleum margin 0.04 2 0.08 Easy access to capital market due to Brand name 0.02 2 0.04 Threats Fishery and environmental organizations 0.06 1 0.06 Tight fiscal conditions 0.11 1 0.11 Rival competition 0.03 3 0.09 Instability in oil prices 0.11 3 0.33 Delayed projects in Arctic Barrel sea 0.05 2 0.10 Global social instability 0.07 1 0.07 Total 1.00 2,05 How is our macro-environment?
  • 14.
    Liquidity / Financial Health 2010 20112012 2013 Current Ratio 1.09 1.16 1.12 1.43 Quick Ratio 0.87 0.92 0.93 1.22 Financial Leverage 2.93 2.76 2.46 2.49  Ratio < 1 company unable to pay  Leverage is the amount of debt used to finance a firm's assets CONCLUSION 1. Current & Quick Ratio increased – easy to pay back its liabilities. 2. Financial Leverage stable – good position in transactions - a continues investment.
  • 15.
    Growth 2011 20122013 Total Revenues 670.0 722.0 637.4 Net Operating Income 211.8 206.6 155.5 Net Income 78.4 69.5 39.2 25% 75% Net Income Taxes
  • 16.
  • 17.
  • 18.
  • 19.
    Key Internal FactorsWeight Rating W. Score Strengths • Strong safety culture 0.02 3 0.06 • Established and growing international position 0.08 3 0.24 • Financial distress due to government support 0.06 4 0.24 • Funds from operations over the year of NOK120 billion–130 billion. 0.05 3 0.15 • Manageable short-term debt of NOK17 billion 0.03 3 0.09 • Profitability measures among the highest in its peer group 0.08 3 0.24 • Develops and operates subsea technologies in order to increase production and recovery 0.08 4 0.32 • Industry leader in seismic imaging and interpretation 0.05 4 0.20 • Ability to build on competitive advantages and stimulates innovation 0.04 3 0.12 • Internationally recognized R&D results 0.06 3 0.18 • Reliable natural gas supplier with a strong position 0.07 3 0.21 • e-learning program on business ethics and anti-corruption compliance 0.01 3 0.03 Weaknesses • High capital expenditure and resulting weak free cash generation 0.07 2 0.14 • Limited vertical integration in manufacturing, meaning refining and marketing. 0.06 1 0.06 • Persistent negative discretionary cash flow and weak free operating cash flow 0.05 2 0.10 • Group's modest leverage. 0.07 2 0.14 • Low reserve-replacement rate, averaging only about 86% organically over the past three years 0.05 1 0.05 • Exposure to volatile and capital-intensive exploration and production sector, with near-term risk of falling oil prices. 0.07 2 0.14 Total 1 2,71
  • 20.
    Key Internal FactorsWeight Rating W. Score Strengths • Strong safety culture 0.02 3 0.06 • Established and growing international position 0.08 3 0.24 • Financial distress due to government support 0.06 4 0.24 • Funds from operations over the year of NOK120 billion–130 billion. 0.05 3 0.15 • Manageable short-term debt of NOK17 billion 0.03 3 0.09 • Profitability measures among the highest in its peer group 0.08 3 0.24 • Develops and operates subsea technologies in order to increase production and recovery 0.08 4 0.32 • Industry leader in seismic imaging and interpretation 0.05 4 0.20 • Ability to build on competitive advantages and stimulates innovation 0.04 3 0.12 • Internationally recognized R&D results 0.06 3 0.18 • Reliable natural gas supplier with a strong position 0.07 3 0.21 • e-learning program on business ethics and anti-corruption compliance 0.01 3 0.03 Weaknesses • High capital expenditure and resulting weak free cash generation 0.07 2 0.14 • Limited vertical integration in manufacturing, meaning refining and marketing. 0.06 1 0.06 • Persistent negative discretionary cash flow and weak free operating cash flow 0.05 2 0.10 • Group's modest leverage. 0.07 2 0.14 • Low reserve-replacement rate, averaging only about 86% organically over the past three years 0.05 1 0.05 • Exposure to volatile and capital-intensive exploration and production sector, with near-term risk of falling oil prices. 0.07 2 0.14 Total 1 2,71
  • 22.
    Strengths- S Weaknesses - W Opportunities-O SO- Strategies WO-Strategies Threats-T ST- Strategies WT-Strategies  MatchingStrengths, Weaknesses, Opportunities & Threats in order to form strategies  Market Penetration /Market Development  Partnerships  Related diversification  Divestiture
  • 23.
    RAPID MARKET GROWTH SLOWMARKET GROWTH STRONGCOMPETITIVEPOSITION WEAKCOMPETITIVEPOSITION  Annual decrease in sales → slow market growth  Statoil ASA is considered to be in strong competitive position  Proposed Strategies: 1. Joint Ventures 2. Related Diversification
  • 24.
     Based ontwo dimensions: IFE & EFE Scores  Company belongs to V division → Hold & Maintain Strategies  Proposed Strategy: Market Penetration
  • 25.
    Proposed Strategic Options Internal – External (IE) Matrix SWOT Matrix Grant Strategy Matrix Market Penetration xx x Market development x Product development Horizontal integration Related diversification x x Unrelated diversification Divestiture x  List proposed strategies from the results of the matching techniques (SWOT, GSM, IE Matrix)
  • 26.
    Existing Strategy:  Upstream-oriented Merger, acquisition and partnership activities  Long-term strategy Proposed Strategy:  Market Penetration – Development  Related Diversification through Partnerships  Emerging Trend in Unconventional Sources  Geographical Expansion/ Entrance in new, challenging market  Increase of gas demand in emerging economies
  • 27.
    Team Members: F. Zachopoulos S.Kosteroglou S. Kyriakidis E. Michailidi A. Mitsis