Download as PDF, PPTX


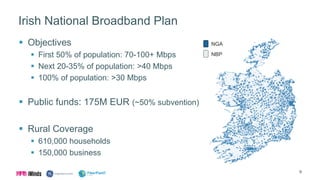
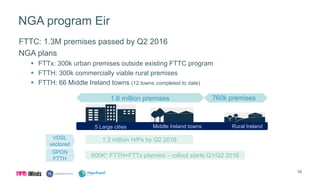


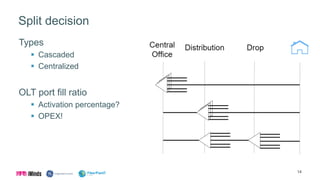
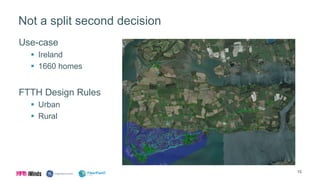
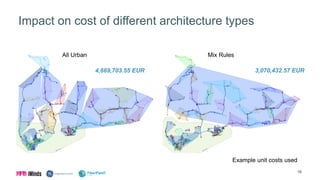


The document discusses the deployment of fiber-to-the-home (FTTH) technology in Ireland, focusing on Eir's experiences and strategies for enhancing broadband access. It highlights challenges and opportunities related to infrastructure, competition, and cost-effective deployment in both urban and rural areas. The Irish National Broadband Plan aims to ensure widespread access to high-speed internet across the country, with significant investment from public funds.


