Download to read offline
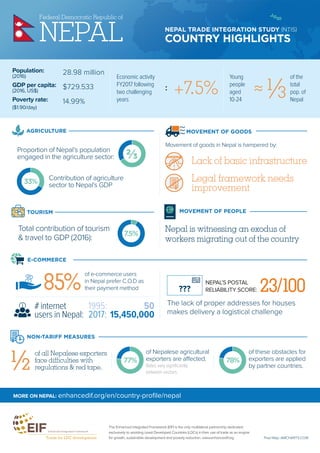


Nepal has a population of 28.98 million, GDP per capita of $729.533, and poverty rate of 14.99%. Agriculture is a major sector, contributing 33% to GDP and engaging 2/3 of the population. However, movement of goods in Nepal is hampered by a lack of basic infrastructure and legal framework issues. The country also relies heavily on tourism, which contributes 7.5% to GDP, and remittances from citizens working abroad.


![Presentation group g-1[1]](https://cdn.slidesharecdn.com/ss_thumbnails/presentationgroupg-11-161019171155-thumbnail.jpg?width=640&height=640&fit=bounds)


![Blended Finance Brief [English]](https://cdn.slidesharecdn.com/ss_thumbnails/blendedfinanceen-210419072656-thumbnail.jpg?width=640&height=640&fit=bounds)
![Official Development Assistance (ODA) and Aid for Trade Brief [English]](https://cdn.slidesharecdn.com/ss_thumbnails/odaen-210419072654-thumbnail.jpg?width=640&height=640&fit=bounds)
![Foreign Direct Investment Brief [English]](https://cdn.slidesharecdn.com/ss_thumbnails/fdien-210419072650-thumbnail.jpg?width=640&height=640&fit=bounds)


