Using model parameters for dimensionality reduction
•
1 like•1,193 views

Using model parameters for dimensionality reduction

Recommended
More Related Content
What's hot
What's hot (20)
More from Michael Munroe
Recently uploaded
Recently uploaded (20)
Using model parameters for dimensionality reduction
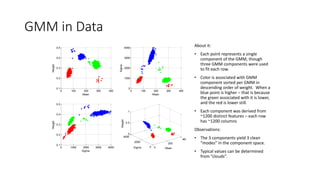
- 1. GMM in Data About it: •Each point represents a single component of the GMM, though three GMM components were used to fit each row. •Color is associated with GMM component sorted per GMM in descending order of weight. When a blue point is higher –that is because the green associated with it is lower, and the red is lower still. •Each component was derived from ~1200 distinct features –each row has ~1200 columns Observations: •The 3 components yield 3 clean “modes” in the component space. •Typical values can be determined from “clouds”. 01002003004000.10.20.30.40.5Mean Weight 010020030040001000200030004000Mean Sigma 010002000300040000.10.20.30.40.5Sigma Weight 020040002000400000.51MeanSigma Weight