1. Hromada 1
USING SURFACE ENHANCED RAMAN SCATTERING (SERS) TO INVESTIGATE THE ROLE OF
COMPETITION FOR BINDING SITES IN THE DETECTION OF MUSEUM-RELEVANT ANALYST WHEN
USING SILVER COLLOID AS THE SERS SUBSTRATE
EMILY A. HROMADA
Department of Chemistry, Chemical Biology, Biomedical Enginnering
Stevens Institute of Technology, Hoboken, NJ 07030
Department of Scientific Research
The Metropolitan Museum of Art, 1000 5th
Ave, New York, NY 10028
May 5, 2014
Undergraduate Research CH 499
In partial fulfillment of a Senior Research Project under the Supervision of
Dr. Nuran M. Kumbaraci
“I pledge my honor that I have abided by the Stevens Honor System.”
Emily Hromada _______________________
Advisor _________________________ Date _____
2. Hromada 2
Abstract:
Surface Enhanced Raman Scattering (SERS) has been used in museum setting because
many of the samples that are being researched are dyes or colorants. Normal Raman
spectrometry cannot always be used in this setting because some of these samples will have
fluorescence in the visible spectrum, therefore interfering with, and overloading, the normal
Raman signals. SERS technique is being used more often but the way that the colloid system
works and effects analytes is not thoroughly understood. Alizarin, an organic molecule used as a
colorant that has a good signal level in SERS systems, was used in order to help understand the
colloid system. By finding out how alizarin interacts with the nanoparticles in the colloid we can
see how levels of colloid aggregation and the analyte concentration affect the nanoparticles, and
therefore signals of SERS. In association with alizarin, purpurin, a similar molecule was also
studied in relation to the colloid system. The two molecules are often present in a pigment,
madder, and finding the ways each molecule interacts with the colloid system can start to pave a
way for quantitative analysis to be done in madder pigment samples.
Introduction:
The identification of valuable and irreplaceable material, such as dyes and colorants in
works of arts and archeological objects, is extremely difficult because of the often low
concentrations at which they are used and the requirement to limit sampling to extremely small
fragments.4
In the museum setting different techniques need to be used in order to compensate
for the type of analytes that are being used. Surface-enhanced Raman scattering (SERS) was first
used to identify dyes in 1987, when it was shown that SERS spectra of alizarin could be
obtained.5
Since then extensive design and testing of plasmonic nanostructured surfaces and
3. Hromada 3
colloids has been done in order to use SERS to be used for the analysis of art materials. Because
of the nature of art materials the goal is to quench fluorescence and enhance the weak Raman
scattering effect, while also minimizing sample material and handling.2
Citrate-reduced silver colloids have been the most popular substrate for SERS of cultural
heritage materials, because of their ease of preparation and use.7
Different investigations have
been carried out in order to increase sensitivity and demonstrate new procedures in the colloid
system. Although work has been done using silver colloids the mechanisms behind the system
have not been thoroughly investigated. In order to have a complete view of the interactions
between nanoparticles, analytes, and aggregate in the system, a specific setup of measurements
for series of samples was made. This setup will help to investigate how alizarin, one of the oldest
molecules used with SERS functions within the system. Alizarin’s activity can then be used to
compare other molecules that are in dyes and colorants to create full picture that can help to
show how SERS sensitivity and signal strength can be maximized for the small sizes of samples
that are used most frequently in museum research.
Analysis of purpurin in the colloid system was also done so that the two molecules could
be compared to each other in their interactions within the system. Purpurin has similar levels of
signal to alizarin, and the molecules are very similar, differing only by one R group, where
alizarin has a H and purpurin has OH. Quantitative analysis of mixture samples of purpurin and
alizarin have had mixed results. We have been able to differentiate between the two signals of
alizarin and purpurin but often the known proportions of the molecules does not show in the
analysis.9
The interactions between the molecules and the colloid are most likely the reason why
the ratios of the molecules can not be clearly seen. Different molecules have different ways of
attaching to the silver nanoparticle surfaces in the colloid. Because of this the layering on the
4. Hromada 4
silver nanoparticles may be different for each molecule. It is possible that even if one molecule
adheres to the particle first the affinity of the other may cause the other to come off. 10
This could
also be complicated if the particles attach on top of each other. If we study the ways that each
molecule interacts within the colloid system it is possible that we can make inferences about how
each attaches to the nanoparticles on their own and therefore help us gain a better picture as to
what happens when they are in the system together.
Experimental Details:
Chemicals and Instrumentation - Silver nitrate, sodium citrate, potassium nitrate,
methanol, ethanol, sulfuric acid, nitric acid, and hydrofluoric acid were purchased from Fisher
Scientific. Alizarin and glucose were purchased from Sigma-Aldrich. SERS spectra were
obtained using a Bruker Senterra Raman instrument equipped with a charge-coupled device
(CCD) detector and a 1800 rulings.mm holographic grating providing a resolution of 3-5 cm-1
.
The employed excitation source was 488 nm radiation emitted by a Spectra Physics Cyan solid
state laser, with a power at the sample of about 4.00 mW. The spectra were acquired with a
single integration of 30 seconds with an Olympus 5x microscope objective, focusing at the
bottom of a quartz window, as will be described in the “method for SERS measurements”
section.
Ag Colloid Synthesis and Sample Preparation – All silver colloids synthesized for this study
were made using microwave reduction of Ag2SO4 in the presence of glucose and sodium citrate
following a half ratio recipe of that published previously by Dr. Marco Leona.6
Samples of
Alizarin were made by dissolving alizarin into either water or methanol depending on the
specific need of the experiment, and using the concentrated to create the diluted concentrations.
5. Hromada 5
For example 10-3
Malizarin was made by dissolving 3.36 x 10⁻³
g of alizarin into 14.00 mL of
ultrapure water; this solution was then used to make 1.500mL of 10-4
M alizarin by adding 150
µL of 10-3
M alizarin to 1.350 mL of ultrapure water. The dilution process was continued to make
a concentration gradient. The concentration gradient for alizarin in water ranged from 5.0 x10⁻⁹
M
to 10-3-
M and the gradient for alizarin ranged from 10-8
M to 10-4
M. The aggregate potassium
nitrate, KNO3, was made by dissolving KNO3 into ultrapure water. A stock solution of 0.50 M
KNO3 was made by dissolving 0.70772 g of KNO3 into 14.00 mL of ultrapure water. The
concentration gradient samples for KNO3 were made by the same methods as the alizarin
concentration gradient samples by making 3.00M KNO3 first and diluting this solution for the
other concentrations; the range of this gradient was 5.00 x 10⁻⁴
M KNO3 to 3.00 M KNO3.
Method for SERS Measurements – Particular attention was dedicated to developing a
method for the SERS measurement that would provide reproducible and consistent signal level.
The normal way of taking SERS spectrum is to use a droplet (usually 10.0 µL or smaller in size)
on a polystyrene BEEM embedding capsule (size 00) or microscope slide and measuring directly
from the drop by either focusing right below the surface of the bubble67
or on the microscope
slide surface158
. This is not that reliable because the droplet is exposed to the air which allows it
to evaporate quickly, therefore changing the concentration of the silver nanoparticles and the
analyte. The droplet form also allows for currents and movement which can change the signal
results. The goal was to create a setup where concentrations will remain constant over the
integration time and minimize movement and currents. This was done by mounting a cap of a
polystyrene BEEM embedding capsule (size 00) onto a microscope slide using vacuum grease.
The sample solution was added to this capsule cap in the following order, 33.0 µL of Ag colloid,
then 33.0 µL of desired alizarin solution, a period of about 10 seconds would be allotted which
6. Hromada 6
after 4.13 µL of a specific molarity of KNO3 was added to induce aggregation of the
nanoparticles. A quartz window, cleaned previously with nitric acid and ethanol, was placed on
top of the capsule cap to close off the system. The solution of colloid, sample, and aggregate will
fill the cap so that when the quartz window is placed on top no air bubbles are in between the cap
and the quartz window. Using the Bruker Senterra Raman Microscope the bottom surface of the
quartz window was found by using the aperture on the Olympus 20x LMPlanFL long working
distance microscope objective; after the surface was focused, the objective was then switched to
the Olympus 5x for the spectra to be taken. The time after which the aggregate was added to
solution was catalogued using a stopwatch. Samples of solutions at specific concentrations were
tested multiple times.
Alizarin Signal Level and Colloid Calibration – Relative signal level of the spectra of
alizarin was found by subtracting the signal given at the valley at 1310 cm-1
from the signal peak
at about 1325 cm-1
. For a specific concentration measurements were taken at time intervals of
about one and a half minutes. An average signal level was taken from all of the time iterations. A
“corrected average” was also recorded for the time range when the signal level had reached a
stable point. In order to complete the concentration curves multiple colloid samples were needed,
therefor it was necessary to calibrate the colloids to one another in order to create a full
concentration curve.
Alizarin in Water Concentration Curve – In this part, the alizarin samples were made by
dissolving alizarin into ultrapure water. The concentration curve was made by varying the
concentration of the sample of alizarin and using 0.50 M KNO3 as the aggregate. The SERS
measurements were taken as previously noted.
7. Hromada 7
Alizarin in Methanol Concentration Curve – Alizarin was dissolved in methanol at varying
concentrations. The same procedure was used as in the water concentration curve. Because the
colloid is made in water the ending solution was 50/50 water methanol ratio.
Aggregate KNO3 Concentration Curve – The concentration gradient of KNO3 was made
by keeping the concentration of alizarin constant, at 10-7
M alizarin in water. The ratios from the
SERS measurements remained consistent as with the alizarin concentration curves.
Purpurin in Water Concentration Curve – In this part, the purpurin samples were made
by dissolving purpurin into ultrapure water. The concentration curve was made by varying the
concentration of the sample of purpurin and using 0.50 M KNO3 as the aggregate. The SERS
measurements were taken as previously noted. Only one colloid batch was used for the entire
curve so it was not necessary to calibrate colloids together.
Purpurin in Methanol Concentration Curve - Purpurin in was dissolved in methanol at
varying concentrations. The same procedure was used in the water concentration curve. Because
the colloid is made in water the ending solution for when the measurements were taken was
50/50 water methanol ratio.
Aggregate KNO3 Concentration Curve with Purpurin - The concentration gradient of
KNO3 was made by keeping the concentration of alizarin constant, at 5x10⁻⁶
M purpurin in
water. The ratios from the SERS measurements remained consistent as with the purpurin
concentration curves.
Results and Discussion:
Method for Measurements – The unique set up that was employed to take the SERS
measurements provided consistent measurements that lead to reproducibility of measurements.
8. Hromada 8
The method could allow for other types of samples to be analyzed in a similar way. This method
is a consistent way to complete a series of measurements that has proven to be a better method
than the traditional droplet that has been used in the past.
Alizarin in Water Concentration Curve – Two samples of colloid were needed to
complete this curve of concentration of alizarin in water versus SERS signal level. The two
colloids will be called Ag Colloid 1 (AgC1) and Ag Colloid 2 (AgC2). Figures 1 and 2 show the
effects of concentration in the colloid system. A calibration between Ag Colloid 1 and Ag
Colloid 2 was done to show the complete concentration curve. The curve shows that after 10-5
M
alizarin is used that the signal level starts to level off and decrease which is an indication that
only a given amount of alizarin molecules can attach to the nanoparticles in the colloid after
which no further signal increase is shown. It is also possible that the decrease in signal is due to
shielding of signal from large clusters of nanoparticles. It was observed that with higher
concentrations of alizarin the nanoparticle aggregation was greatly increased even before the
addition of the KNO3 aggregate to the solution. If the clusters became so large that the
nanoparticles themselves made it so that the signal could not make it directly back to the sensor
the signal level would decrease. Along with shielding the large clusters also forced the
nanoparticles to precipitate or fall to the bottom of the solution faster; since readings are taken at
the top of the solution when the nanoparticles begin to fall to the bottom of the capsule the signal
level decreases.
9. Hromada 9
Figure 1 - Concentration Curve of Alizarin in Water
Figure 2 - Logarithmic vs logarithmic plot of the concentration curve of alizarin in water.
10. Hromada 10
Alizarin in Methanol Concentration Curve – Again two samples of colloid were needed
to perform this curve, Ag Colloid 2 (AgC2) and Ag Colloid 3 (AgC3). A calibration between Ag
colloid 2 and 3 was done to make a continuous curve. Figures 3 and 4 show the effects of
concentration of alizarin in methanol compared to signal level. The SERS signal levels have the
same tendencies as the alizarin in water. It was observed that the aggregation in methanol
compared to water was much greater. The stability point came at a different time than the water
trials as well.
Figure 3 - Concentration curve of alizarin in methanol.
11. Hromada 11
Figure 4 - Log vs Log plot of the concentration curve of alizarin in methanol.
Effects of Water versus Methanol as a Solvent – Both water and Methanol are used in the
museum setting to dissolve samples and take SERS measurements but there are drastic changes
to the colloid system and to the SERS spectrum that come from using the different solvents. Ag
Colloid 2 was used in the water concentration curve as well as the methanol concentration curve
and therefore the signal levels of methanol and water could be compared directly to each other
without calibration. One of the most noticeable differences between the different solvents is that
the methanol signal levels are generally lower than the water signal levels; figures 5 and 6 help
to show these differences. Methanol is able to dissolve more alizarin than water so the
concentrations above 10-3
M go against this pattern. At lower concentrations of alizarin, water has
much higher signal levels than when alizarin is dissolved in methanol. Having methanol in the
system may lead to interference with the alizarin on the colloid surface. Further proof of the
12. Hromada 12
interference of methanol can also be seen in the SERS spectrum, which is shown in figures 7 and
8. Figure 7 shows the differences between the 10-6
M alizarin in water (red spectrum) and 10-6
M
alizarin in methanol (blue spectrum). In the spectrum where methanol is the solvent, not only is
the signal strength significantly lower, but the alizarin peak at 1424 cm-1
is missing and the peaks
above 1424 cm-1
are skewed or missing as well. Using the methanol SERS spectrum, figure 8, it
has been determined that the peak at 1023 cm-1
is a methanol peak. This peak shows how
methanol has interfered with the alizarin spectrum.
Figure 5 - The concentration curves using different solvents compared.
13. Hromada 13
Figure 6 - Log vs log plot of the comparison between methanol and water.
Figure 7 - SERS spectra of alizarin dissolved in two different solvents. Red spectrum is alizarin in water; blue spectrum is
alizarin in methanol.
14. Hromada 14
Figure 82 - SERS spectrum of methanol.
Effects of KNO3 Concentration - Using 10-7
M Alizarin in water and changing the
concentration of KNO3 the following curves were found to illustrate the effects of the
concentration of the aggregate on the system. Two colloid samples were used in this
concentration curve, Ag Colloid 3 (AgC3) and Ag Colloid 4 (AgC4) and a calibration was done
between them in order to create a full curve. Figures 9 and 1o show the effects of aggregate on
the SERS signal. The concentration that yielded the highest signal was 1.5 M KNO3. The
problem with higher concentrations of aggregate is that the silver nanoparticles form large
masses much quicker which leads to shielding and precipitation as we saw with higher
concentrations of analyte. Unlike when using 0.5 M KNO3 using higher concentrations makes
the time that the signal is stable much shorter and often if the time iterations of the measurements
are not performed exactly correct then the stabilization point cannot be seen. The decrease of
signal at higher concentrations of aggregate also suggests that there is competition between the
aggregate and the analyte.
15. Hromada 15
Figure 3 – Keeping the concentration of Alizarin at 10-7
M in water the concentration of the aggregate KNO3 was changed
to create the concentration curve of KNO3.
Figure 4 – A log vs log plot of the concentration curve or KNO3.
0
500
1000
1500
2000
2500
0.0001 0.001 0.01 0.1 1
SignalLevel
Concentration of KNO3 (M)
Concentration of KNO3 vs Signal Level
Ag Colloid 4
Corrected
Averages
Addition
Polynomial
Calibration AgC4
to AgC3
Ag Colloid 3
Corrected
Averages
1
10
100
1000
10000
0.0001 0.001 0.01 0.1 1
SignalLevel
Concentration of KNO3 (M)
Concentration of KNO3 vs Signal Level
Ag Colloid 4
Corrected
Averages
Addition
Polynomial
Calibration AgC4
to AgC3
Ag Colloid 3
Corrected
Averages
16. Hromada 16
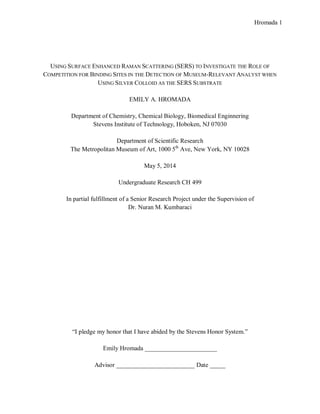
Purpurin in Water Concentration Curve – Figures 13 and 14 show the effects of
concentration of purpurin in the colloid system. The curve shows that after 10-4
M purpurin is
used that the signal level starts to level off and decrease which is an indication that only a given
amount of purpurin molecules can attach to the nanoparticles in the colloid after which no further
signal increase is shown. It is also possible that the decrease in signal is due to shielding of signal
from large clusters of nanoparticles. It was observed that with higher concentrations of purpurin
the nanoparticle aggregation was greatly increased even before the addition of the KNO3
aggregate to the solution. If the clusters became so large that the nanoparticles themselves made
it so that the signal could not make it directly back to the sensor the signal level would decrease.
Along with shielding the large clusters also forced the nanoparticles to precipitate or fall to the
bottom of the solution faster; since readings are taken at the top of the solution when the
nanoparticles begin to fall to the bottom of the capsule the signal level decreases.
Figure 13 Concentration of Purpurin in H2O versus Signal Level
0
200
400
600
800
1000
1200
1400
1600
1800
0.0000001 0.000001 0.00001 0.0001
SignalLevel
Concentration of Purpurin in H2O (M)
Purpurin Concentration in H2O vs Signal Level
17. Hromada 17
Figure 14: Logarithmic versus logarithmic plot of concentration of purpurin in H2O vs signal level.
Purpurin in Methanol Concentration Curve – Figures 15 and 16 show the effects of
concentration of alizarin in methanol compared to signal level. The SERS signal levels have the
same tendencies as the purpurin in water except that the signal levels were much higher and the
curve is much more defined. It was observed that the aggregation in methanol compared to
water was much greater. The stability point in methanol was at a different point than in water.
1
10
100
1000
10000
0.0000001 0.000001 0.00001 0.0001
SignalLevel
Concentration of Purpurin in H2O (M)
Purpurin Concentration in H2O vs Signal Level
18. Hromada 18
Figure 15: Concentration Curve for purpurin in methanol versus signal level.
Figure 16: Logarithmic vs logarithmic plot of the conentration of purpurin vs the signal level.
0
1000
2000
3000
4000
5000
6000
7000
8000
1E-10 1E-09 1E-08 0.0000001 0.000001 0.00001 0.0001
SignalLevel
Concentration of Purpurin in Methanol(M)
Purpurin Concentration in Methanol vs Signal Level
1
10
100
1000
10000
1E-10 1E-09 1E-08 0.0000001 0.000001 0.00001 0.0001
SignalLevel
Concentration of Purpurin in Methanol(M)
Purpurin Concentration in Methanol vs Signal
Level
19. Hromada 19
Effects of Water versus Methanol as a Solvent – Both water and Methanol are used in the
museum setting to dissolve samples and take SERS measurements but there are drastic changes
to the colloid system and to the SERS spectrum that come from using the different solvents. Ag
Colloid 1 from Aug 22nd
was used in the water concentration curve as well as the methanol
concentration curve and therefore the signal levels of methanol and water could be compared
directly to each other without calibration. One of the most noticeable differences between the
different solvents is that the water signal levels are generally lower than the methanol signal
levels; figures 17 and 18 help to show these differences. At lower concentrations of purpurin,
methanol has much higher signal levels than when purpurin is dissolved in water. In water the
signal for purpurin can not be seen in concentrations lower than 10-7
M purpurin, while in
methanol the signal level at this concentration is still strong. The results here are much different
than the results in alizarin. Figure 19 shows the differences between the 10-5
M purpurin in water
(red spectrum) and 10-5
M purpurin in methanol (blue spectrum). In the spectrum where methanol
is the solvent, not only is the signal strength significantly higher, but the peak shapes between
1500 cm-1
and 1350 cm-1
are much different in the different solvents.. This might be due to the
fact that methanol changes the way that the purpurin attaches to the surface of the nanoparticles.
A different way of attachment means that the molecule will be read differently.
20. Hromada 20
Figure 17: Concentration curves of purpurin were compared using the different solvents
0
1000
2000
3000
4000
5000
6000
7000
8000
1E-10 1E-09 1E-08 0.0000001 0.000001 0.00001 0.0001
SignalLevel
Concentration of Purpurin (M)
Purpurin Concentrations in Different Solvents vs
Signal Level
Purpurin
in Water
Purpurin
in
Methanol
21. Hromada 21
Figure18: Logarithmic vs logarithmic plot of the concentration curves of purpurin in different solvents.
Figure 19: SERS Spectrum of purpurin in different solvents. Blue signal is for purpurin in methanol and red signal is for
purpurin in water.
Effects of KNO3 Concentration - Using 5x10⁻⁶
M purpurin in water and changing the
concentration of KNO3 the following curves were found to illustrate the effects of the
1
10
100
1000
10000
1E-10 1E-09 1E-08 0.0000001 0.000001 0.00001 0.0001
SignalLevel
Concentration of Purpurin (M)
Purpurin Concentrations in Different Solvents vs
Signal Level
Purpurin
in Water
Purpurin
in
Methanol
22. Hromada 22
concentration of the aggregate on the system. Figures 20 shows the effects of aggregate on the
SERS signal. The concentration that yielded the highest signal was 3 M KNO3. The problem
with higher concentrations of aggregate is that the silver nanoparticles form large masses much
quicker which leads to shielding and precipitation as we saw with higher concentrations of
analyte. Unlike when using 0.5 M KNO3 using higher concentrations makes the time that the
signal is stable much shorter and often if the time iterations of the measurements are not
performed exactly correct then the stabilization point cannot be seen. The most stable KNO3
concentration was found to be 0.4M, this provided the most consistent signals over the longest
period of time.
Figure 20: Keeping the purpurin concentration constant at 5x10⁻⁶ M, a concentration curve for the aggregate KNO3 was
created.
Conclusion and Summary:
The experiments that were done provided valuable insight into the ways that the colloid
system works. In the future scientists can use the information gathered here to help get the best
0
100
200
300
400
500
600
700
800
900
0 0.5 1 1.5 2 2.5 3
SignalLevel
Concentration of KNO3 (M)
Concentration of KNO3 vs Signal Level
23. Hromada 23
possible SERS spectrum of samples. It has been shown that there is a point where increasing the
concentration of sample does not help the signal anymore due to aggregation and room on the
nanoparticles. It is possible that using higher concentration of aggregate could enhance the
signal, but again if the concentration is too high the rate of aggregation can lead to shielding and
possibly competition between the analyte and the aggregate. Because both methanol and water
are used in the museum setting, the solvents were tested and their effects on the system were
surprising. When methanol was used as the solvent the signal of the alizarin was interfered with
and was much lower than when water was used as the solvent. In contrast the purpurin signal
was enhanced by the use of methanol. Further studies have to be done to see why this happens.
This may help to explain why the ratios seen in quantitative experiments are not as they are
expected to be.
Time was also seen as an important factor when looking into how the colloid system
works. Often a relatively long incubation time is taken with the colloid and sample together, after
viewing the effects of time on the colloid system this method may not be the most effect way to
obtain a good spectrum. In order to illustrate this time versus signal level curves are being
worked on to be presented at a later date. It was also noticed that the calibration between colloid
samples became a time consuming endeavor, after the curves and experiments were finished it
was realized that altering the centrifugation portion in the synthesis of the colloid so that more
volume of colloid was in each sample would be a good way to avoid the need for calibration. In
future attempts centrifuging 1.5 mL of stock colloid instead of the original 1 mL6
would
probably alleviate the issue. After alizarin was completed the method was changed to using 1.5
mL of stock colloid and the issue was elevated providing better and more concise measurements.
24. Hromada 24
Now that alizarin and purpurin have been studied in the colloid system. The competition
for binding sites on the nanoparticles must be tested. If the competition between alizarin and
purpurin was studied then a way to quantify the amounts of each in the pigment can be found.
Quantization can lead to the ability to find provenance which can help to prove authenticity of
pieces of art work.
References:
1. Bruni, S.; Guglielmi, V.; Pozzi, F. Historical organic dyes: a surface-enhanced Raman
scattering (SERS) spectral database on Ag Lee – Meisel colloids aggregated by NaClO4.
J. Raman Spectrosc. 2010. 42, 1267-1281.
2. Casadio, F.; Leona, M.; Lombardi, J. R.; Van Duyne, R. Identification of Organic
Colorants in Fibers, Paints, and Glazes by Surface Enhanced Raman Spectroscopy. Acc.
Chem. Res. 2010. 43 (6), 782-791.
3. Chen, K.; Leona, M.; Vo-Dinh, K.; Yan, F.; Wabuyele, M. B.; Vo-Dihn, T. Application
of surface-enhanced Raman scattering (SERS) for the identification of antraquinone dyes
used in works of art. J. Raman Spectrosc. 2006. 37, 520-527.
4. Leona, M.; Decuzzi, Peter.; Kubic, T. A.; Gates, G.; Lombardi, J. R. Nondesctructive
Identification of Natural and Synthetic Organic Colorants in Works of Art by Surface
Enhanced Raman Scattering. Anal. Chem. 2011. 83, 3990-3993.
5. Leona, M.; Stenger, J.; Ferloni, E. Application of surface-enhanced Raman scattering
techniques to the ultrasensitive identification of natural dyes in works of art. J. Raman
Spectrosc. 2006. 37, 981-992.
25. Hromada 25
6. Leona, M. Microanalysis of organic pigments and glazes in polychrome works of art by
surface-enhanced resonance Raman scattering. Proc. Natl. Acad. Sci. 2009. 106 (35),
14757-14762.
7. Pozzi, F.; Lombradi, J. R.; Bruni, S.; Leona, M. Sample Treatment Considerations in the
Analysis of Organic Colorants by Surface-Enhanced Raman Scattering. Anal. Chem.
2012. 84, 3751-3757.
8. Wang, M.; Teslova, T., Xu F.; Spataru, T.; Lombardi, J. R.; Birke, R. L.; Leona, M.
Raman and Surface Enhanced Raman Scattering of 3-Hydroxyflavone. J. Phys. Chem.
2007. 111, 3038-3043.
9. Shadi, Iqbal T.; Chowdhry, Babur Z.; Snowden, Martin J.; Withnall, Robert. Semi-
quantitative Analysis of Alizarin and Purpurin by Surface-enhanced Resonance Raman
Spectroscopy (SERRS) Using Silver Colloids. Journal of Raman Spectroscopy. 2004. 35,
800-807.
10. Bell, S. E. J.; Barrett L. J.; Dennis A. C.; Spence, S. J.; Inaugural UK SERS Forum.
National Physical Laboratory: Teddington, Middlesex, UK, 2003.