
Recommended
Recommended
More Related Content
What's hot
What's hot (13)
Similar to CREB Economic Region Real Estate and Economic Report
Similar to CREB Economic Region Real Estate and Economic Report (20)
More from Dean Koeller
Recently uploaded
Recently uploaded (20)
CREB Economic Region Real Estate and Economic Report
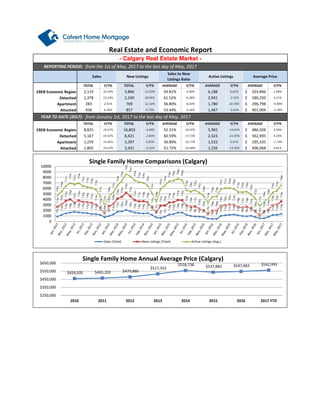
- 1. CREB Economic Region Detached Apartment Attached 2017 CREB Economic Region Detached Apartment Attached 4.20% 8,825 TOTAL Y/Y% TOTAL Y/Y% AVERAGE Y/Y% 5,167 14.52% 8,421 -2.00% 60.59% 17.73% 2,323 -21.05% 562,995$ -1.74% 1,805 16.23% 3,431 -3.22% 51.72% 3.59% AVERAGE Y/Y% AVERAGE Y/Y% 10.67% 16,803 -4.69% 52.31% 16.02% 5,965 -14.81% 486,504$ 401,904$ -3.78%857 9.73% 53.44% -3.16% 1,467 -3.61% from January 1st, 2017 to the last day of May, 2017 458 6.26% YEAR TO DATE (2017): 2,941 -2.55% 580,250$ 3.21% 283 2.91% 769 12.10% 36.80% -8.20% 1,780 10.70% 296,798$ AVERAGE 6,188 0.65% 503,846$ 1.98%2,119 -4.98% - Calgary Real Estate Market - from the 1st of May, 2017 to the last day of May, 2017 10.19% 3,866 22.03% 54.81% -5.40% REPORTING PERIOD: AVERAGE Y/Y%Y/Y% 1,378 13.23% 2,240 20.95% 61.52% -6.38% TOTAL Y/Y% TOTAL Y/Y% AVERAGE Y/Y% Real Estate and Economic Report Sales New Listings Sales to New Listings Ratio Active Listings Average Price 19.68% 1,226 -13.39% 406,068$ 0.81% 1,259 14.35% 3,397 3.85% 36.89% 10.77% 1,532 3.67% 295,335$ $459,035 $465,202 $479,880 $517,333 $558,738 $537,883 $547,683 $562,995 $250,000 $350,000 $450,000 $550,000 $650,000 2010 2011 2012 2013 2014 2015 2016 2017 YTD Single Family Home Annual Average Price (Calgary) 0 1000 2000 3000 4000 5000 6000 7000 8000 9000 10000 Single Family Home Comparisons (Calgary) Sales (Total) New Listings (Total) Active Listings (Avg.)
- 2. Total Residential Single Family Detached Condominium Duplex/Rowhouse 2017 Total Residential Single Family Detached Condominium Duplex/Rowhouse Sales to New Listings Ratio Average Price - Edmonton Real Estate Market - TOTAL Y/Y% TOTAL Y/Y% AVERAGE Y/Y% AVERAGE REPORTING PERIOD: from the 1st of May, 2017 to the last day of May, 2017 Sales New Listings Y/Y% -1.72% 810 4.52% 1,387 8.11% 58.00% -3.98% 449,683$ 1.10% 1,354 3.99% 2,782 14.39% 48.67% -9.09% 379,516$ -2.34% 133 -8.28% 222 12.69% 60.00% -18.48% 364,236$ 0.01% AVERAGE Y/Y% 394 8.84% 1,109 22.27% 36.00% -9.80% 249,217$ YEAR TO DATE (2017): from January 1st, 2017 to the last day of May, 2017 AVERAGE Y/Y% 5,010 1.52% 11,047 -10.07% 44.53% 10.25% TOTAL Y/Y% 372,367$ 0.95% TOTAL Y/Y% 2,918 -0.41% 5,477 -18.19% 51.97% 17.13% 444,664$ 1.63% 1,520 4.32% 4,423 4.46% 34.00% -0.55% 244,746$ -0.73% 484 -0.21% 916 -12.09% 52.60% 9.83% 368,934$ 5.70% 528 648 923 1,022 1,179 1,198 1,125 983 857 863 673 436 485 747 917 1,147 1,213 1,324 1,158 1,019 1,020 908 777 439 390 547 876 1,001 1,078 1,243 1,111 884 873 728 680 435 342 517 605 691 775 802 670 623 621 585 433 333 323 460 661 664 810 955 1,115 1,467 1,569 1,911 1,586 1,491 1,349 1,268 1,059 783 415 1,070 1,082 1,585 1,818 2,085 1,829 1,601 1,354 1,335 1,260 794 534 1,298 1,428 1,883 1,964 1,974 1,886 1,782 1,741 1,660 1,283 1,059 719 1,308 1,584 1,241 1,279 1,283 1,216 1,130 1,136 1,084 855 710 369 784 905 1,204 1,197 1,387 0 500 1000 1500 2000 2500 Single Family Home Comparisons (Edmonton) Sales (Total) New Listings (Total) 20 25 30 35 40 45 50 Single Family Home Average Days on Market (Calgary) 0 50 100 150 200 250 300 < $100 $100 - $199 $200 - $299 $300 -$ 349 $350 - $399 $400 - $449 $450 - $499 $500 - $549 $550 - $599 $600 - $649 $650 - $699 $700 - $799 $800 - $899 $900 - $999 $1M + May-16 May-17 Number of Sales by Price Range (Calgary Total Sales)
- 3. Alberta Canada Unemployment Rate May-17 in Alberta Retail Trade (mill. $'s) in Canada Feb-17 Total Mortgages Feb-17 *the following information is based on current available data from: http://economicdashboard.albertacanada.com/, www.statcan.gc.ca/dai-quo/ and RBC Economic Outlook,http://www.cba.ca/en/component/content/publication/69-statistics, http://www.atb.com/SiteCollectionDocuments - Alberta Economic Indicators - TOTAL Y/Y%2017f 2.60% in Alberta in Alberta 7.80% in Canada 2016f Real GDP Growth Annual Y/Y%TOTAL Net Migration to AB Jan-17 580,612 7.23%in Alberta 6,631 in Canada in Alberta 4,282 1.51% 31.46 -3.60% 9.79% in Canada 4,720,283 47,763 6.60% -4.35% 8.06% 2.90% 0.81% 0.62% -0.20% Apr-17 $1,122.54 -0.90% $877.84 -8.61% 2,736 Mortgages 90 Day Arrears Feb-17 Avg. Weekly Earnings 13,057 -2.11%in Canada Housing Starts (SAAR*, 000's) 2016f 1.50% 42.13% $383,226 $379,485 $392,446 $409,438 $431,882 $436,416 $441,046 $444,664 $300,000 $350,000 $400,000 $450,000 2010 2011 2012 2013 2014 2015 2016 2017 YTD Single Family Home Annual Average Price (Edmonton) 0 20 40 60 80 Average Days on Market (Edmonton) 0.20% 0.23% 0.25% 0.28% 0.30% 0.33% 0.35% 0.38% 0.40% 0.43% 0.45% 0.48% 0.50% Mortgages % of Arrears to Total Number of Mortgages (AB) % of Arrears to Total Number of Mortgages (Canada) Mortgage Arrears Ratio; Canada vs Alberta
- 4. Resources http://economicdashboard.albertacanada.com/ http://www.creb.com/ http://www.ereb.com/REALTORSAssociationOfEdmonton.html http://www.capp.ca/Pages/default.aspx http://homepriceindex.ca/hpi_tool_en.html http://www.cba.ca/en/component/content/publication/69-statistics http://www.finance.alberta.ca/aboutalberta/ http://www.statcan.gc.ca/dai-quo/ http://www.housepriceindex.ca/default.aspx?langue=EN *Housing Starts: This represents that seasonally adjusted annual rate (SAAR) for the month. The statements and statistics in this report have been compiled by Calvert Home Mortgage Investment Corporation based on information from sources considered to be reliable. We make no representation or warranty, express or implied, as to its accuracy or completeness. This publication is for the people we work with and should not be construed as an offer to sell or a solicitation to buy securities. http://www.rbc.com/economics/economic-data/index.html http://www.bankofcanada.ca/wp-content/uploads/2014/12/fsr-december2014.pdf 1,146 1,119 1,113 $1,090 $1,100 $1,110 $1,120 $1,130 $1,140 $1,150 2015 2016 2017YTD Average Weekly Earnings Average Weekly Earnings (Alberta) $0.00 $10.00 $20.00 $30.00 $40.00 $50.00 $60.00 $70.00 WCS Oil Prices WTI Oil Prices WTI - WCS Price Differential WTI and WCS Pricing and Price Differential (US$) 4,100 4,150 4,200 4,250 4,300 2015 2016 2017YTD Population of Alberta Population (thousands)