
Recommended
Recommended
More Related Content
What's hot
What's hot (20)
Viewers also liked
Similar to CHMIC Economic Report- November 2016
Similar to CHMIC Economic Report- November 2016 (20)
Recently uploaded
Recently uploaded (20)
CHMIC Economic Report- November 2016
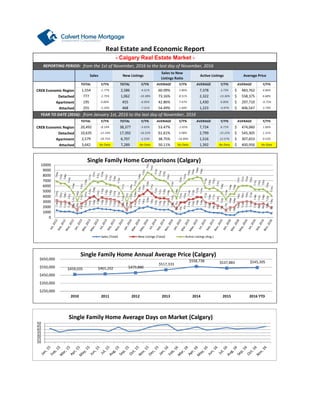
- 1. CREB Economic Region Detached Apartment Attached 2016 CREB Economic Region Detached Apartment Attached 1.31% 20,492 TOTAL Y/Y% TOTAL Y/Y% AVERAGE Y/Y% YEAR TO DATE (2016): 1.06% AVERAGE Y/Y% AVERAGE Y/Y% -8.14% 38,377 -5.65% 53.47% -2.65% 7,724 6.71% 474,060$ 10,635 -12.14% 406,547$ 3.79%468 -7.51% 54.49% 2.49% 1,223 -4.97% from January 1st, 2016 to the last day of November, 2016 255 -5.20% 2,322 -13.36% 558,375$ 6.68% 195 0.00% 455 -6.95% 42.86% 7.47% 1,430 6.00% 297,710$ AVERAGE 7,378 3.73% 483,762$ 4.96%1,554 -0.72% - Calgary Real Estate Market - from the 1st of November, 2016 to the last day of November, 2016 -1.77% 2,586 -4.51% 60.09% 2.86% REPORTING PERIOD: AVERAGE Y/Y%Y/Y% 777 -2.75% 1,062 -10.38% 73.16% 8.51% TOTAL Y/Y% TOTAL Y/Y% AVERAGE Y/Y% Real Estate and Economic Report Sales New Listings Sales to New Listings Ratio Active Listings Average Price 17,392 -16.52% 61.61% 5.08% 2,799 -15.22% 545,305$ 0.53% 3,642 No Data 7,289 No Data 50.11% No Data 1,392 No Data 400,956$ No Data 2,579 -18.75% 6,707 -2.53% 38.75% -16.90% 1,516 12.57% 307,653$ $459,035 $465,202 $479,880 $517,333 $558,738 $537,883 $545,305 $250,000 $350,000 $450,000 $550,000 $650,000 2010 2011 2012 2013 2014 2015 2016 YTD Single Family Home Annual Average Price (Calgary) 0 1000 2000 3000 4000 5000 6000 7000 8000 9000 10000 Single Family Home Comparisons (Calgary) Sales (Total) New Listings (Total) Active Listings (Avg.) 20 25 30 35 40 45 50 Single Family Home Average Days on Market (Calgary)
- 2. Total Residential Single Family Detached Condominium Duplex/Rowhouse 2016 Total Residential Single Family Detached Condominium Duplex/Rowhouse Sales to New Listings Ratio Average Price - Edmonton Real Estate Market - TOTAL Y/Y% TOTAL Y/Y% AVERAGE Y/Y% AVERAGE REPORTING PERIOD: from the 1st of November, 2016 to the last day of November, 2016 Sales New Listings Y/Y% 2.98% 433 -0.46% 710 -1.25% 60.99% -0.02% 453,810$ 1.55% 754 5.75% 1,447 13.22% 52.11% -6.60% 377,136$ -2.52% 79 21.54% 136 25.93% 58.09% -3.19% 371,799$ -0.65% AVERAGE Y/Y% 230 13.86% 563 41.81% 40.85% -19.90% 242,681$ YEAR TO DATE (2016): from January 1st, 2016 to the last day of November, 2016 AVERAGE Y/Y% 11,263 -27.47% 24,167 -18.49% 47.45% -9.59% TOTAL Y/Y% 373,349$ 0.33% TOTAL Y/Y% 6,664 -29.53% 12,826 -26.20% 53.51% -2.71% 442,304$ 1.15% 3,360 -24.05% 8,701 -4.84% 38.77% -20.15% 250,178$ -0.86% 1,075 -20.84% 2,035 -14.35% 54.31% -5.02% 358,226$ 0.97% $383,226 $379,485 $392,446 $409,438 $431,882 $436,416 $442,304 $340,000 $360,000 $380,000 $400,000 $420,000 $440,000 $460,000 2010 2011 2012 2013 2014 2015 2016 YTD Single Family Home Annual Average Price (Edmonton) 941 854 773 782 623 419 528 648 923 1,022 1,179 1,198 1,125 983 857 863 673 436 485 747 917 1,147 1,213 1,324 1,158 1,019 1,020 908 777 439 390 547 876 1,001 1,078 1,243 1,111 884 873 728 680 435 342 517 605 691 775 802 670 623 621 585 433 1,455 1,380 1,266 1,082 769 409 955 1,115 1,467 1,569 1,911 1,586 1,491 1,349 1,268 1,059 783 415 1,070 1,082 1,585 1,818 2,085 1,829 1,601 1,354 1,335 1,260 794 534 1,298 1,428 1,883 1,964 1,974 1,886 1,782 1,741 1,660 1,283 1,059 719 1,308 1,584 1,241 1,279 1,283 1,216 1,130 1,136 1,084 855 710 0 500 1000 1500 2000 2500 Single Family Home Comparisons (Edmonton) Sales (Total) New Listings (Total) 0 50 100 150 200 250 < $100 $100 - $199 $200 - $299 $300 -$ 349 $350 - $399 $400 - $449 $450 - $499 $500 - $549 $550 - $599 $600 - $649 $650 - $699 $700 - $799 $800 - $899 $900 - $999 $1M + Nov-15 Nov-16 Number of Sales by Price Range (Calgary Total Sales)
- 3. Alberta Canada Unemployment Rate Nov-16 in Alberta Retail Trade (mill. $'s) in Canada Sep-16 Total Mortgages Sep-16 *the following information is based on current available data from: http://economicdashboard.albertacanada.com/, www.statcan.gc.ca/dai-quo/ and RBC Economic Outlook,http://www.cba.ca/en/component/content/publication/69-statistics, http://www.atb.com/SiteCollectionDocuments - Alberta Economic Indicators - TOTAL Y/Y%2016f 1.30% in Alberta in Alberta 8.03% in Canada 2015 Real GDP Growth Annual Y/Y%TOTAL Net Migration to AB Nov-16 576,483 -2.45%in Alberta 6,102 in Canada in Alberta No Data No Data 25.91 -3.50% -18.71% in Canada 4,702,952 44,375 6.80% -2.94% 2.27% -2.90% 0.39% 0.34% 33.79% Oct-16 $1,106.10 -2.96% $951.80 -0.11% 2,506Mortgages 90 Day Arrears Sep-16 Avg. Weekly Earnings 11,031 5.12%in Canada Housing Starts (000's) 2015 1.10% 59.11% 0 20 40 60 80 Average Days on Market (Edmonton) 1,149 1,146 1,119 $1,100 $1,120 $1,140 $1,160 2014 2015 2016YTD Average Weekly Earnings Average Weekly Earnings (Alberta) 0.20% 0.23% 0.25% 0.28% 0.30% 0.33% 0.35% 0.38% 0.40% 0.43% 0.45% 0.48% 2015-01 2015-02 2015-03 2015-04 2015-05 2015-06 2015-07 2015-08 2015-09 2015-10 2015-11 2015-12 2016-01 2016-02 2016-03 2016-04 2016-05 2016-06 2016-07 2016-08 2016-09 Mortgages % of Arrears to Total Number of Mortgages (AB) % of Arrears to Total Number of Mortgages (Canada) Mortgage Arrears Ratio; Canada vs Alberta
- 4. Resources http://economicdashboard.albertacanada.com/ http://www.creb.com/ http://www.ereb.com/REALTORSAssociationOfEdmonton.html http://www.capp.ca/Pages/default.aspx http://homepriceindex.ca/hpi_tool_en.html http://www.cba.ca/en/component/content/publication/69-statistics http://www.finance.alberta.ca/aboutalberta/ http://www.statcan.gc.ca/dai-quo/ http://www.housepriceindex.ca/default.aspx?langue=EN http://www.rbc.com/economics/economic-data/index.html http://www.bankofcanada.ca/wp-content/uploads/2014/12/fsr-december2014.pdf $0.00 $10.00 $20.00 $30.00 $40.00 $50.00 $60.00 $70.00 WCS Oil Prices WTI Oil Prices WTI - WCS Price Differential WTI and WCS Pricing and Price Differential (US$) 4,000 4,100 4,200 4,300 2014 2015 2016YTD Population of Alberta Population (thousands)