1. April 2015 Personal Income Data
Today we receivedApril2015 personal income data. We decidedtotake some time to share withreaderssome of
our takeaways.
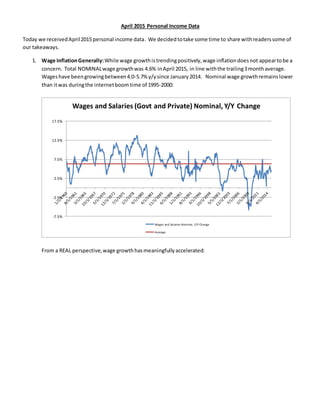
1. Wage InflationGenerally:While wage growthistrendingpositively,wage inflationdoesnot appeartobe a
concern. Total NOMINALwage growthwas 4.6% inApril 2015, in line withthe trailing3monthaverage.
Wageshave beengrowingbetween4.0-5.7% y/ysince January2014. Nominal wage growthremainslower
than itwas duringthe internetboom time of 1995-2000:
From a REAL perspective,wage growthhasmeaningfullyaccelerated:
-7.5%
-2.5%
2.5%
7.5%
12.5%
17.5%
Wages and Salaries (Govt and Private) Nominal, Y/Y Change
Wages and Salaries Nominal, Y/Y Change
Average
5. 4. Personal ConsumptionExpendituresas a Function of EmploymentGrowth: On botha NOMINALandREAL
basis,consumption remainsquite tepidrelativetothe jobgrowthwe are seeingandiswell below whatwe
saw duringthe internetboom. Infact,on a nominal basis,consumptionrelativetoemploymentisatlevels
lastseenin2008:
-5.0%
0.0%
5.0%
10.0%
15.0%
20.0%
Disposable PersonalIncome, Nominal, Y/Y
Disposable Personal Income, Total Average
0.0%
2.0%
4.0%
6.0%
8.0%
10.0%
12.0%
14.0%
PersonalConsumption Expenditures, Nominal
Deflated by Non-Farm Payrolls
Personal Consumption Expenditures, Nominal Deflated by Non-Farm Payrolls Average
7. Households,on average,are now saving over $6,000, equal to 12% of the average householdincome of
$50,000. As it is unlikelythat the average familyis able to save 12% of their income (the current savings
rate appliedto the average income is roughly$2,800), savings must be skewedto the highestearners:
Withthe average householdtheoreticallysavings$2,800 per year,one can understandwhycreditissovital
to a home purchase. The medianprice of an existinghome soldinthe USinApril 2015 was$265k. A 20%
downpaymentwouldrequire $53kequal to19 years of savingsusingthe currentsavingsrate.
We believe amore accurate portrayal of the savingsrate is encapsulatedbythe chartbelow. While the
overall savingsrate (blue line)is5.7%,if we exclude governmenttransfers(redline),the savingsrate is
roughly -15%. Similarly,if we exclude supplementstowages(greenline),2/3of whichconsistsof actual and
actuarial contributionstopensions,the savingsrate isroughly -7% (we donotknow how muchare actual and
howmuch are actuarial contributionsbutthisdistinctionisclearlyimportantasthe formerisa cash flow
itemwhile the latterisnot). Saidanotherway,if youdon’treceive apensionorgovernmenttransfer,you
likelyhave anegative savingsrate:
0
1,000
2,000
3,000
4,000
5,000
6,000
7,000
8,000
9,000
10,000
1q65
4q66
3q68
2q70
1q72
4q73
3q75
2q77
1q79
4q80
3q82
2q84
1q86
4q87
3q89
2q91
1q93
4q94
3q96
2q98
1q00
4q01
3q03
2q05
1q07
4q08
3q10
2q12
1q14
Annual Savings/Household, Level Data (1965-
Present)
Annual Savings/Household,Level Data (1965-Present)