

Recommended
More Related Content
What's hot
What's hot (20)
Similar to Consumer surplus
Similar to Consumer surplus (20)
More from DAVIS THOMAS
More from DAVIS THOMAS (20)
Recently uploaded
Recently uploaded (20)
Consumer surplus
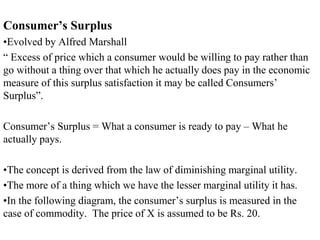
- 1. Consumer’s Surplus •Evolved by Alfred Marshall “ Excess of price which a consumer would be willing to pay rather than go without a thing over that which he actually does pay in the economic measure of this surplus satisfaction it may be called Consumers’ Surplus”. Consumer’s Surplus = What a consumer is ready to pay – What he actually pays. •The concept is derived from the law of diminishing marginal utility. •The more of a thing which we have the lesser marginal utility it has. •In the following diagram, the consumer’s surplus is measured in the case of commodity. The price of X is assumed to be Rs. 20.
- 4. Limitations 1. Consumers surplus can not be measured precisely. 2. In the case of of necessaries, the MU of the earlier with are infinitely large. 3. It is affected by the availability of Substitutes. 4. There is no simple ways of deriving the utility scale of articles which are used fortheir prestige value. 5. It cannot be measured in terms of money because, the MU of money changes as purchases are made and consumer’s stock of money diminishes. 6. The concept can be accepted only if it is assumed that utility can be measured in terms of money.
- 5. Indifference Curve Analysis A very popular and realistic method of explaining Consumer’s DD This approach to Consumer Behaviour is based on consumer preferences Human satisfaction being a psychological phenomena can not be measured quantitatively in monetary terms. This consumer preference approach is an ordinal concept based on ordering of preferences
- 6. Assumptions 1. The consumer is rational and posesses full information about all the aspects of economic environment in which he leaves. 2. The consumer is capable of ranking all conceivable combinations of goods according to the satisfaction they yield. 3. If the consumer prefers combination A to B and B to C then he must prefer combination A to C. 4. If combination A has more commodities than combination B, then A must preferred to B.
- 7. • What are Indifference Curve An Indifference curve is a curve which represents all those combinations of goods which give the same satisfaction to the consumer. In other words since all the combinations provide the same level of satisfaction the consumer prefers them equally and does not mind which combination he gets.
- 9. Indifference Map It depicts complete picture of consumers takes and preferences.
- 10. Marginal Rate of Substitution (MRS) • It is the rate at which the consumer is prepared to exchange goods X and Y.As the consumer has more and more use of a good, he is prepared to give up less and less units of other goods. Reasons 1. The want for a particular good is satiable so that when a consumer has more of its quantity, his intensity of want for it decreases. 2. Most of the goods are Imperfect substitute for one another.
- 11. Properties of Indifference Curves 1. Indifference Curves (IC) slop downwards to the right. 2. ICs are always convex to the origin. 3. ICs can never intersect each other. 4. A higher IC represents a higher level of satisfaction
- 12. Budget Line • It shows all those combinations of two goods which the consumer can buy spending his given money income on the two goods at their given prices. • All the combinations which are with in the reach of the consumer will lie on the budget line. • Point H is beyond the reach of the consumer and point K shows under spending by the consumer.
- 14. Consumers Equilibrium • Consumer is in equilibrium when he is deriving maximum possible satisfaction from the goods and is in no position to rearrange his purchases of goods. Assumptions • The consumer has a given Indifference map which shows his scale of preferences for various combinations of two goods X and Y. • He has a fixed money income which he has to spent wholly on goods X and Y. • Prices of goods X and Y are given and are fixed for him.
- 16. • In the figure IC1, IC2,IC3,IC4 and IC5 are shown together with the Budget line PLfor good X and good Y. • The combinations R,S,Q,T and H cost the same to the consumer. • Since there is a budget constraint he will be forced to remain on the given budget line i.e. he will have to choose any combinations from among only those which lie on the given price line. • In the diagram Q is the best choice because this combination lies not only on his budget line but also puts him on the highest possible IC i.e. IC3 •
- 17. • At point Q his budget line PL is tangent to the IC curve (IC3) where the consumer will buy OM of X and OM of Y. • At the tangency point Q, the slopes of the price line PL and indifference curve IC3 are equal. The slope of the indifference curve shows the marginal rate of substitution of X for Y (MRSxy) • Which is equal to MUx while the slope of the price line indicates the ratio between the MUy • prices of two goods i.e. Px Py • Thus at point Q MRSxy= MUx = Px MUy Py
- 18. • Hence we can say that the consumer is in equilibrium position when the price line is tangent to the indifference curve or when the marginal rate of substitution of goods X and Y is equal to the ratio between the prices of the two goods.