This document discusses key concepts in consumer behavior including:
1. Consumer preferences are evaluations consumers make about products based on factors like quality, price, and taste. Preferences are assumed to be complete, transitive, and where more is better than less.
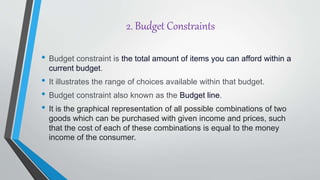
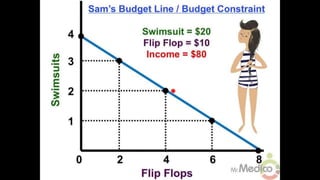
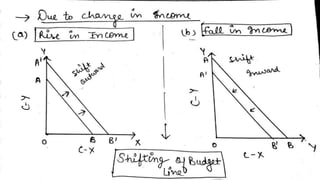
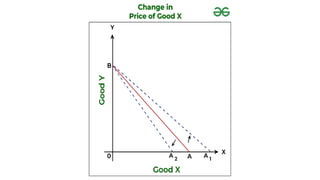
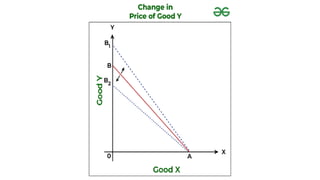
2. Budget constraints graphically represent all combinations of goods that can be purchased with a given income and prices. Changes in income or prices shift the budget line in or out.
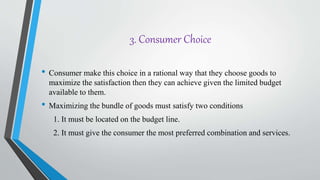
3. Consumers make choices to maximize satisfaction within their budget constraint by locating their preferred bundle on the budget line.