SlideShare a Scribd company logo
1 of 15
Laboratory Experiment. Number 6 & 7
Heat Treatment and Hardenability of Steels
Laboratory Experiment No. 6 & 7
Heat Treatment and Hardenability of Steels
Abstract
This experiment is attempted to measure the hardenability of the
steel and understand the process of heat treatment of different
materials at different cooling strategies. Cooling through
different procedures will cause the materials to have different
properties and different microstructures. Furthermore next stage
of experiment relates the cooling rate and hardness of 1045
steel and 4143 steel. This also helps in determine how alloying
a material permits it to be heat treated more homogeneously.
Investigated results also proven to be close enough to expected
results in obtaining higher brittleness with rapid cooling in and
to improve ductility the process of tempering is proven to be
very efficient with increase of tempering temperature the
hardness of material must be decrease. Last but not least, after
finishing experiment 6 the group found out that the lower the
tempering temperature the lower the hardness. Also, the results
that the group found from experiment 7 after finishing it proved
being inconsistent from what it should be.
Introduction
The purpose of this experiment is to determine what effect heat
treating and then cooling has on the hardness and grain
structure of two different types of steel. The two different types
of steels were utilized are 1045 steel samples and 4143 steel
sample which is considered to be a low-alloy steel.
The heat-treating process is a method to alter physical and
mechanical properties of the material. The heat-treating process
is consists of three crucial steps of annealing, hardening, and
tempering. Annealing is primarily used to soften and to induce
the ductility of the specimens by heating and holding at suitable
temperature and then cooling, by instantly quenching in the
water, which produces the higher brittleness with low ductility
and toughness in the specimens. Moreover, tempering is a
process of heat-treating, which is used to increase the toughness
of metal. Tempering is important because it used to achieve
desired hardness. To restore some the toughness and impact
properties is obtained by tempering where specimens are
reheated to a temperature between 5000 F and 10000 F for
certain time which removes the internal strain caused by sudden
cooling in the quenching bath without a large decrease in
hardness or strength.
In attempting the first phase of the experiment it cannot
determined why some heat-treated materials don’t reach a high
hardness when cooled at certain temperature. With the hardness
test the hardness of a material can be determined. The
Hardenability is a property that determines the depth and
distribution of hardness when steel is heated to a given
temperature and then quenched to reach martensitic structure,
which is obtained by performing Jominy test, where an
austenitized steel bar is quenched at one end only, thus
producing a range of cooling rates along the bar.
Procedure
First of all, the experiment provided six 1045 steel specimens
were for heat treating process, and for the second were only two
steel rods of 1045 steel and 4143 steel respectively used to
perform the Jominy test. In order to go though the details read
the following: First the group begin with identifying all each
specimen by punching different letter on to them using hammer.
Second, the engineer students heated all specimens at 16000 F
for 1/2 hour after obtaining the Rockwell a scale hardness
measurement. Third, The four samples were quenched in water,
one sample is allowed for air cool, and the other sample is set
for furnace cool for one hour and quenched in water. Then, the
two steel rods of different properties also allowed for heated at
16000 F for 45 minutes after obtaining the Rockwell scale
hardness measurements. Also, the group measured the Rockwell
a scale hardness on all six quenched specimens after being heat
treated and tempered the three-quenched specimen at different
temperature of 6000 F, 8000 F, and 10000 F respectively for 30
minutes. After tempering specimens then quenched in water.
Moreover, obtained hardness measurements using Brinell (3000
kg) and Rockwell A scale on all six steel specimens. In order to
perform the Jominy test one steel rod is then removed from the
furnace and is placed in the cooling tower for 10 minutes before
quenching in water, repeated the same procedure for other steel
rod. Finally, measured the hardness 1/16 inch for the first inch
and every 1/8 for the next inch and 1/4 for the next 2 inches
using Rockwell a scale for both steel rods.
Results and Discussions
The experiments “Heat Treatment of Steel” and “Hardenability
of Steel” are two different experiments, which show the effects
of heat-treating, and quenching of specimen provides different
hardness and microstructure in the materials. During first phase
of experiment the two specimens are left to cool at room
temperature and furnace temperature, these specimens were
quenched after an hour. The reason for this quenching after an
hour is due to the fact that the grains in the material are given a
chance to form when cooling at room temperature and furnace
cooling temperature. If the grains are not given enough time to
form when cooling at room and oven temperature the grain
structure would not be accurate as if actually air cooled and
furnace cooled. From the Table 1 it can be clearly seen the
hardness obtained through furnace cooled is lesser than
hardness obtained by air cooled specimens because in furnace
cooling allow the grains to from due to its slow cooling process
where as during air cool specimens tends to cool much quicker
compare to furnace cool and specimens have less time to form
grains. Due to that specimens will have more boundaries, which
mean there will be more interference with dislocation motion.
Also, in Table 1 it shows the Rockwell measurement is 76.99
for the instant quench. On the other hand, the furnace cooled is
55.05. Moreover, in Table 2 represent the Ultimate Tensile
strength (psi) for all samples from the average Brinell Hardness
number obtained. In fact, the hardness of both of the measured
BNH and the measured Rockwell are decreasing. The Ultimate
Tensile Strength (psi) is also decreasing because the hardness is
going down. As we know the harder a material is the higher the
strength is. Furthermore, the instant quenched sample has the
highest hardness and the Ultimate Tensile strength results.
Finally, Table 3 represents the hardness of the Steel 1045
sample after it has been placed at different tempering
temperatures. Moreover, Table 4 shows the difference in
hardness between Steel 1045 and Steel 4143 that that was taken
at different distance from the quenched end.
Table 1 Comparison between performed Brinell hardness
numbers measurements with Brinell hardness numbers obtained
by conversion of Rockwell A scale measurements.
Specimens
Rockwell
A scale
measurements
RHA Conversion to BHN
Dimple Diameters (mm)
BHN from Dimple Diameters
S instant quench
76.99
500
2.50
601
H Tempered @540 0C
71.58
390
3.20
363
D Tempered @ 430 0C
69.19
353
2.90
444
K Tempered @ 315 0C
70.89
381
2.81
417
M (air cooled)
53.39
172
4.29
197
E (Furnace cooled)
53.05
169
4.51
179
Table 2 Computed Ultimate Tensile strength (psi) based on the
average Brinell Hardness number obtained.
Specimens
Measured BHN
(3000)kg
Measured Rockwell A scale numbers (HRA )
Conversion BHN
Average BHN
Ultimate Tensile Strength (psi)
S
401
75.53
500
550.5
2.75E+05
D
429
71.71
353
398.5
1.99E+05
K
444
66.89
381
399
2.00E+05
H
388
66.99
390
376.5
1.88E+05
M
211
55.92
172
184.5
9.23E+04
E
363
52.10
169
174
8.70E+04
The obtained Brinell hardness comparing to Brinell hardness
obtained from the conversion scale of Rockwell A scale
hardness both results increase and decrease accordingly to the
hardness. The data represented in Table 1 and Figure 1 shows
that Brinell hardness increase in relation to the cooling rate and
heat treating hardness for Rockwell A scale hardness
measurements, but did not increase between specimens “K” and
“D” instead hardness went down. If both the Brinell hardness
and Rockwell a numbers were proportional to each other a
straight line would be seen. A graph like the one shown in
Figure 1 could be a result of an inaccurate machine or
inaccurate measurement taking strategies.
Figure 1 Brinell Hardness numbers vs. Rockwell A scale
numbers obtained after heat treating of the specimens.
Table 3 The hardness measurements obtained using Rockwell A
scale for three 1045 steel specimens that has been tempered at
different temperatures after being heat treated.
Specimens
Hardness Rockwell
A scale (HRA)
Tempering temperature ( c )
D
71.71
430
K
66.89
315
H
66.99
540
Figure 2 Hardness obtained using Rockwell A scale hardness
after tempering the specimens.
To obtain desired mechanical properties in steel specimens it is
necessary to process heat treating, quenching, and tempering of
the steel. Hardening is way of making steel harder, by first heat
treating the specimens to 8850 C for half hour and immediately
cools it by quenching the specimens in water, which increase
the brittleness of the substance at much higher rate with very
low ductility and toughness in the samples. The tempering is the
process through which brittleness is reduced to improve
ductility and toughness by heating the specimens at different
temperature for certain time.
Higher tempering temperature will yield a somewhat softer
material with higher toughness, whereas a lower tempering
temperature will produce a harder and somewhat more brittle
material, as shown by the Figure 2 where hardness increases
with the increase of tempering temperature.
The possible errors of not quenching the specimens in desired
time or factors of obtaining the hardness of the samples at
softer spot may have occurred in processing the tempering of
specimens, which resulted on the graphs for not obtaining
consistency.
The decline in hardness of tempered specimens once has been
heat treated and quenched in Table 3 proves the hypothesis of
decrease in brittleness by tempering the specimens.
The Ultimate tensile strength of materials is determined using
equation 1 by using data collected for Brinell hardness for all
the specimens mentioned in Table 2.
Equation 1 Calculating the Ultimate Tensile Strength of
materials.
In determining the strength, obtaining the hardness is great
ways of making comparison, which can be attain using
Rockwell A scale and Brinell hardness scale which is directly
proportional to the tensile strength. In using Brinell hardness
scale timing in maintaining the load on the specimens may have
been a factor of slight variation of results where as in Rockwell
A scale ha
From the Figure 4 the amount of carbide ((Fe3C) can be
calculated at temperature 1338 0F for 1045 steel using equation
2 where C1 is 45% because that is the weight percent of carbon
in 1045 steel. Ca and Cb calculated using the lever rule which
consists of drawing a line across to determine how much weight
percent of material there is in the steel, where “a” is alpha and
“b” is Iron Carbide (Fe3C). Using equation 2 is determined that
Iron carbide percent is about 0.68% and 99.32% is presumed to
be alpha phase.
Wb = (C1 – Ca)/(Cb – Ca) , Ca= 2.2%, and Cb= 65% are the
weight percent composition.
Equation 2 To find the Fe3C (carbide) content using weight
percent equation.
Figure 4 The iron-iron carbide phase diagram.
Different microstructures obtained when specimens processed
through differen cooling strategies that is why the TTT (Time,
Temperature, Transformation) chart in Figure 5 is proven to be
great tool in determining the microstructure. The TTT chart
shows the amount of time needed to quench a material to reach
a certain phase. The left part line represents the beginning of
the transformation and the right part line represents the
conclusion of the transformation. The TTT chart also explains
the need of quenching the specimens after an hour of cooling
due to after certain time the specimens does not require any
more transformation. The martensite structure which is one of
the hardest of all phases is obtained upon quenching instantly to
a low temperature. But the other samples that quenched were
temperd again to move higher up in the TTT chart where less
hardened materials are . To obtained a desired phase it is
neccsary to for rapid change in temperature with respect to time
when quenching the 1045 steel to reach a Bainite phase.
The specimens that were furnace cooled and cooled at room
temperature are most likely to fall in the pearlite phase where
the one cooled at room temperature is said to be fine pearlite
while the other one is more close to coarse pearlite due to slow
cooling process. The specimens tempered at 540°C falls
between pearlite and bainite phases. The specimens tempered at
430°C and 315°C fall under the Bainite phase, the one tempered
at a lower temperature could be classified as being of finer
Bainite.
Figure 5 The TTT (Time, Temperature, Transformation) chart
for 1045 steel.
Microstructure and hardness are closely correlated;
microstructure consists of grain size and crystal structure. When
the specimens were reached at austenite phase, the grains are
more uniform and homogeneously distributed; upon completion
of this process the specimens are ready to be cooled in order to
obtain different hardeneability in the material. During instant
quenching of the specimens the specimens with evenly
distributed grains are not given a chance to form and are then
solidified giving the material a fine grain structure in contrast
to a material slowly cooling which gives a material more coarse
grains making the material less hard and more ductile. The
Jominy test results illustrated in Figure 3 prove that how
cooling rate affects hardness data obtained on the attempt of
experiment. The greater distance of quenching the less hard the
material is because, as mentioned before, the grains are given
more time to form, and the bigger the grains the less hard the
material. The inconsistency among results obtained instead of
constantly moving downward may have caused due to
experimental errors such as not placing it fast enough on the
Jominy tester. The graph line obtained by the 4143steel and
1045 steel quickly goes up and down not opening the water
enough for quenching during the Jominy test. The overall graph
is also does not matches to the expected results where 1045
steel graph must lower than the graph line obtained by the 4061
steel rod specimen is considered to be an experimental error of
not transporting the specimen on the tester with in time
duration.
Table 4 The Jominy test results obtained on two steel rods.
Distance from quenched end (in)
1045 Steel
4143 Steel
0.0625
75.9
66.2
0.125
72.2
66.4
0.1875
61.7
66.5
0.25
50.3
68.5
0.3125
58.2
67.6
0.375
56.9
61.3
0.4375
55.6
65.1
0.5
55.9
60.8
0.5625
53.6
60.6
0.625
55.7
61.4
0.6875
54.4
57.8
0.75
49.7
58.2
0.8125
51.8
53.8
0.875
51.2
55.9
0.9375
51.6
51.9
1
50.2
56.6
1.125
49.2
52.3
1.25
50.8
55
1.375
50.5
53.5
1.5
48.4
51.8
1.625
49.2
49.8
1.75
49.1
51.9
1.875
47.8
52
2
47.2
47.7
2.25
47.3
49.7
2.5
47.5
49.7
2.75
46.9
45.5
3
44.2
45.8
3.25
38.6
45.1
3.5
40.1
22.9
3.75
42.7
32
4
36.4
26.3
Figure 3 Plot showing Hardness as a function of distance from
the quenched end for 1045 steel and 4061 steel specimens. The
dash line is the Steel 4061 and the solid line is the Steel 1045.
Conclusion
Materials that cool at slower cooling rates tend to be softer
materials while those that are cooled at faster cooling rates tend
to be harder. Tempering a material lowers its ultimate strength
but increases the amount of stress the material can absorb
(toughness), higher the tempering temperature the lower the
ultimate strength. Tempering also adds more ductile
characteristics to the material. High hardness in materials only
can be attain when there is a low toughness, in order to acquire
toughness in a material that has been quenched, The tempering
of the specimens is then processed to improve the toughness in
the material and lower the brittleness.Fine grain structures tend
to be hard material where as materials with coarse grain
structure has more ductile properties. Furthermore, the data
does not accurately show what should be happening. The data I
collected has error that is obviously shows in my graph. The
graph should show a straight line going down similar to the one
in experiment 6. For example, after heating the Steel and
quenched it the group had to measured it and probably by
mistake the engineer student measured the same point twice or
took similar points close to each other. Also, maybe the time it
took to move the Steel from furnace to be quenched was too
long which effected the measurements. Moreover, the water that
was used to quench could have been too strong hitting the
specimen, which leads to make a huge differences in
measurements.
References
D. Callister Jr, Fundamentals of Materials Science and
Engineering, J. Wiley & Sons, NY, 3rd Ed. 2008, Flinn and
Trojan, Engineering Materials and Their Application, Chapter 6
Dieter, Mechanical Metallurgy ASM Handbook on Heat
Treatment, Vol. 2
http://www.smt.sandvik.com/en/products/strip-steel-and-strip-
based-products/strip-products/knife-steel/hardening-
guide/purpose-of-hardening-and-tempering/
http://www.carbidedepot.com/formulas-hardness.htm
William D. Callister, Jr., David G. Rethwisch. Fundamentals of
materials science and engineering, third edition
www.csun.edu/~bavarian/Courses/MSE%20227/Labs/2-
Charpy_test.pdf
Rockwell A Hardness vs. Tempering Temperature 540.0
315.0 71.58 70.89
Tempering Temperature (C)
Hardness (Rockwell A scale)
Distance From Quenching (in) vs. Hardness (HRA)
1045 Steel 0.0625 0.125 0.1875 0.25 0.3125
0.375 0.4375 0.5 0.5625 0.625 0.6875
0.75 0.8125 0.875 0.9375 1.0 1.125 1.25
1.375 1.5 1.625 1.75 1.875 2.0 2.25 2.5
2.75 3.0 3.25 3.5 3.75 4.0 75.9 72.2 61.7 50.3 58.2
56.9 55.6 55.9 53.6 55.7 54.4 49.7 51.8 51.2 51.6 50.2
49.2 50.8 50.5 48.4 49.2 49.1 47.8 47.2 47.3 47.5 46.9
44.2 38.6 40.1 42.7 36.4 4061 Steel 0.0625 0.125
0.1875 0.25 0.3125 0.375 0.4375 0.5 0.5625
0.625 0.6875 0.75 0.8125 0.875 0.9375
1.0 1.125 1.25 1.375 1.5 1.625 1.75 1.875
2.0 2.25 2.5 2.75 3.0 3.25 3.5 3.75 4.0 66.2 66.4
66.5 68.5 67.6 61.3 65.1 60.8 60.6 61.4 57.8 58.2 53.8
55.9 51.9 56.6 52.3 55.0 53.5 51.8 49.8 51.9 52.0 47.7
49.7 49.7 45.5 45.8 45.1 22.9 32.0 26.3
Distance From Quenching (in)
Hardness (HRA)
Brinell Hardness (krg) vs. Rockwell A Hardness (hra)
BHN vs. Rockwell A 601.0 444.0 417.0 363.0
197.0 179.0 76.99 69.19 70.89 71.58
53.39 53.05
Brinell Hardness (krg)
Hardness (Rockwell A scale) hra

More Related Content

Similar to Laboratory Experiment. Number 6 & 7Heat Treatment and Hardenabil.docx

Paper_40595_manuscript_14121_0
Paper_40595_manuscript_14121_0Paper_40595_manuscript_14121_0
Paper_40595_manuscript_14121_0
Jennifer Rui Zhang
 
Effect of Subzero Treatment on Microstructure and Material Properties of EN...
Effect of Subzero Treatment on Microstructure and Material  Properties of EN...Effect of Subzero Treatment on Microstructure and Material  Properties of EN...
Effect of Subzero Treatment on Microstructure and Material Properties of EN...
IJMER
 
Effect of heat treatment on the microstructure
Effect of heat treatment on the microstructureEffect of heat treatment on the microstructure
Effect of heat treatment on the microstructure
Khin Shwe
 
Material Property Effects abbreviated
Material Property Effects abbreviatedMaterial Property Effects abbreviated
Material Property Effects abbreviated
Amanda Gee
 
Effect of Subzero Treatment on Microstructure and Material Properties of EN24...
Effect of Subzero Treatment on Microstructure and Material Properties of EN24...Effect of Subzero Treatment on Microstructure and Material Properties of EN24...
Effect of Subzero Treatment on Microstructure and Material Properties of EN24...
IJMER
 
Steel 4140Left MiddleRight AVGHardness (HRA)42.7.docx
Steel 4140Left MiddleRight AVGHardness (HRA)42.7.docxSteel 4140Left MiddleRight AVGHardness (HRA)42.7.docx
Steel 4140Left MiddleRight AVGHardness (HRA)42.7.docx
rafaelaj1
 

Similar to Laboratory Experiment. Number 6 & 7Heat Treatment and Hardenabil.docx (20)

Effect of water temperature on the mechanical properties of water quenched me...
Effect of water temperature on the mechanical properties of water quenched me...Effect of water temperature on the mechanical properties of water quenched me...
Effect of water temperature on the mechanical properties of water quenched me...
 
Effect of Heat Treatment on Corrosion Behavior of Spring Steels
Effect of Heat Treatment on Corrosion Behavior of Spring SteelsEffect of Heat Treatment on Corrosion Behavior of Spring Steels
Effect of Heat Treatment on Corrosion Behavior of Spring Steels
 
Paper_40595_manuscript_14121_0
Paper_40595_manuscript_14121_0Paper_40595_manuscript_14121_0
Paper_40595_manuscript_14121_0
 
Annealing
AnnealingAnnealing
Annealing
 
Effect of Subzero Treatment on Microstructure and Material Properties of EN...
Effect of Subzero Treatment on Microstructure and Material  Properties of EN...Effect of Subzero Treatment on Microstructure and Material  Properties of EN...
Effect of Subzero Treatment on Microstructure and Material Properties of EN...
 
Experimental Investigation on Characteristic Study of the Carbon Steel C45 in...
Experimental Investigation on Characteristic Study of the Carbon Steel C45 in...Experimental Investigation on Characteristic Study of the Carbon Steel C45 in...
Experimental Investigation on Characteristic Study of the Carbon Steel C45 in...
 
Effect of heat treatment on the microstructure
Effect of heat treatment on the microstructureEffect of heat treatment on the microstructure
Effect of heat treatment on the microstructure
 
Material Property Effects abbreviated
Material Property Effects abbreviatedMaterial Property Effects abbreviated
Material Property Effects abbreviated
 
Analysis of mechanical properties of heat treated mild steel
Analysis of mechanical properties of heat treated mild steelAnalysis of mechanical properties of heat treated mild steel
Analysis of mechanical properties of heat treated mild steel
 
Effect of Quenching Media on Mechanical Properties for Medium Carbon Steel
Effect of Quenching Media on Mechanical Properties for Medium Carbon SteelEffect of Quenching Media on Mechanical Properties for Medium Carbon Steel
Effect of Quenching Media on Mechanical Properties for Medium Carbon Steel
 
Annealing
AnnealingAnnealing
Annealing
 
Effect of Step Quenching and Tempering on the Corrosion Behaviour of a Low Ca...
Effect of Step Quenching and Tempering on the Corrosion Behaviour of a Low Ca...Effect of Step Quenching and Tempering on the Corrosion Behaviour of a Low Ca...
Effect of Step Quenching and Tempering on the Corrosion Behaviour of a Low Ca...
 
Effect of Subzero Treatment on Microstructure and Material Properties of EN24...
Effect of Subzero Treatment on Microstructure and Material Properties of EN24...Effect of Subzero Treatment on Microstructure and Material Properties of EN24...
Effect of Subzero Treatment on Microstructure and Material Properties of EN24...
 
The influence of artificial aging on tensile properties of Al 6061-T4.pdf
The influence of artificial aging on tensile properties of Al 6061-T4.pdfThe influence of artificial aging on tensile properties of Al 6061-T4.pdf
The influence of artificial aging on tensile properties of Al 6061-T4.pdf
 
Example discussion section
Example discussion sectionExample discussion section
Example discussion section
 
SuperCoolingFinal Lab
SuperCoolingFinal LabSuperCoolingFinal Lab
SuperCoolingFinal Lab
 
Steel 4140Left MiddleRight AVGHardness (HRA)42.7.docx
Steel 4140Left MiddleRight AVGHardness (HRA)42.7.docxSteel 4140Left MiddleRight AVGHardness (HRA)42.7.docx
Steel 4140Left MiddleRight AVGHardness (HRA)42.7.docx
 
International Journal of Engineering Research and Development
International Journal of Engineering Research and DevelopmentInternational Journal of Engineering Research and Development
International Journal of Engineering Research and Development
 
Effect of Hardness and Wear Resistance on En 353 Steel by Heat Treatment
Effect of Hardness and Wear Resistance on En 353 Steel by Heat  Treatment Effect of Hardness and Wear Resistance on En 353 Steel by Heat  Treatment
Effect of Hardness and Wear Resistance on En 353 Steel by Heat Treatment
 
Heat treatment part 2
Heat treatment part 2Heat treatment part 2
Heat treatment part 2
 

More from DIPESH30

Please submit a minimum of five (5) detailed and discussion-provokin.docx
Please submit a minimum of five (5) detailed and discussion-provokin.docxPlease submit a minimum of five (5) detailed and discussion-provokin.docx
Please submit a minimum of five (5) detailed and discussion-provokin.docx
DIPESH30
 
Please use the following technique-Outline the legal issues t.docx
Please use the following technique-Outline the legal issues t.docxPlease use the following technique-Outline the legal issues t.docx
Please use the following technique-Outline the legal issues t.docx
DIPESH30
 
Please share your thoughts about how well your employer, military .docx
Please share your thoughts about how well your employer, military .docxPlease share your thoughts about how well your employer, military .docx
Please share your thoughts about how well your employer, military .docx
DIPESH30
 
Please see the attachment for the actual work that is require.  This.docx
Please see the attachment for the actual work that is require.  This.docxPlease see the attachment for the actual work that is require.  This.docx
Please see the attachment for the actual work that is require.  This.docx
DIPESH30
 

More from DIPESH30 (20)

please write a short essay to address the following questions. Lengt.docx
please write a short essay to address the following questions. Lengt.docxplease write a short essay to address the following questions. Lengt.docx
please write a short essay to address the following questions. Lengt.docx
 
please write a diary entry from the perspective of a French Revoluti.docx
please write a diary entry from the perspective of a French Revoluti.docxplease write a diary entry from the perspective of a French Revoluti.docx
please write a diary entry from the perspective of a French Revoluti.docx
 
Please write the definition for these words and provide .docx
Please write the definition for these words and provide .docxPlease write the definition for these words and provide .docx
Please write the definition for these words and provide .docx
 
Please view the filmThomas A. Edison Father of Invention, A .docx
Please view the filmThomas A. Edison Father of Invention, A .docxPlease view the filmThomas A. Edison Father of Invention, A .docx
Please view the filmThomas A. Edison Father of Invention, A .docx
 
Please watch the clip from the movie The Break Up.  Then reflect w.docx
Please watch the clip from the movie The Break Up.  Then reflect w.docxPlease watch the clip from the movie The Break Up.  Then reflect w.docx
Please watch the clip from the movie The Break Up.  Then reflect w.docx
 
please write a report on Social Media and ERP SystemReport should.docx
please write a report on Social Media and ERP SystemReport should.docxplease write a report on Social Media and ERP SystemReport should.docx
please write a report on Social Media and ERP SystemReport should.docx
 
Please write 200 wordsHow has the healthcare delivery system chang.docx
Please write 200 wordsHow has the healthcare delivery system chang.docxPlease write 200 wordsHow has the healthcare delivery system chang.docx
Please write 200 wordsHow has the healthcare delivery system chang.docx
 
Please view the documentary on Typhoid Mary at httpswww..docx
Please view the documentary on Typhoid Mary at httpswww..docxPlease view the documentary on Typhoid Mary at httpswww..docx
Please view the documentary on Typhoid Mary at httpswww..docx
 
Please use the two attachments posted to complete work.  Detailed in.docx
Please use the two attachments posted to complete work.  Detailed in.docxPlease use the two attachments posted to complete work.  Detailed in.docx
Please use the two attachments posted to complete work.  Detailed in.docx
 
Please use the sources in the outline (see photos)The research.docx
Please use the sources in the outline (see photos)The research.docxPlease use the sources in the outline (see photos)The research.docx
Please use the sources in the outline (see photos)The research.docx
 
Please submit a minimum of five (5) detailed and discussion-provokin.docx
Please submit a minimum of five (5) detailed and discussion-provokin.docxPlease submit a minimum of five (5) detailed and discussion-provokin.docx
Please submit a minimum of five (5) detailed and discussion-provokin.docx
 
Please think about the various learning activities you engaged in du.docx
Please think about the various learning activities you engaged in du.docxPlease think about the various learning activities you engaged in du.docx
Please think about the various learning activities you engaged in du.docx
 
Please type out the question and answer it underneath. Each question.docx
Please type out the question and answer it underneath. Each question.docxPlease type out the question and answer it underneath. Each question.docx
Please type out the question and answer it underneath. Each question.docx
 
Please use the following technique-Outline the legal issues t.docx
Please use the following technique-Outline the legal issues t.docxPlease use the following technique-Outline the legal issues t.docx
Please use the following technique-Outline the legal issues t.docx
 
Please use from these stratagies This homework will be to copyies .docx
Please use from these stratagies This homework will be to copyies .docxPlease use from these stratagies This homework will be to copyies .docx
Please use from these stratagies This homework will be to copyies .docx
 
PLEASE THOROUGHLY ANSWER THE FOLLOWING FIVE QUESTIONS BELOW IN.docx
PLEASE THOROUGHLY ANSWER THE FOLLOWING FIVE QUESTIONS BELOW IN.docxPLEASE THOROUGHLY ANSWER THE FOLLOWING FIVE QUESTIONS BELOW IN.docx
PLEASE THOROUGHLY ANSWER THE FOLLOWING FIVE QUESTIONS BELOW IN.docx
 
Please share your thoughts about how well your employer, military .docx
Please share your thoughts about how well your employer, military .docxPlease share your thoughts about how well your employer, military .docx
Please share your thoughts about how well your employer, military .docx
 
Please select and answer one of the following topics in a well-org.docx
Please select and answer one of the following topics in a well-org.docxPlease select and answer one of the following topics in a well-org.docx
Please select and answer one of the following topics in a well-org.docx
 
Please see the attachment for the actual work that is require.  This.docx
Please see the attachment for the actual work that is require.  This.docxPlease see the attachment for the actual work that is require.  This.docx
Please see the attachment for the actual work that is require.  This.docx
 
Please see the attachment and look over the LOOK HERE FIRST file b.docx
Please see the attachment and look over the LOOK HERE FIRST file b.docxPlease see the attachment and look over the LOOK HERE FIRST file b.docx
Please see the attachment and look over the LOOK HERE FIRST file b.docx
 

Recently uploaded

1029 - Danh muc Sach Giao Khoa 10 . pdf
1029 -  Danh muc Sach Giao Khoa 10 . pdf1029 -  Danh muc Sach Giao Khoa 10 . pdf
1029 - Danh muc Sach Giao Khoa 10 . pdf
QucHHunhnh
 
Russian Escort Service in Delhi 11k Hotel Foreigner Russian Call Girls in Delhi
Russian Escort Service in Delhi 11k Hotel Foreigner Russian Call Girls in DelhiRussian Escort Service in Delhi 11k Hotel Foreigner Russian Call Girls in Delhi
Russian Escort Service in Delhi 11k Hotel Foreigner Russian Call Girls in Delhi
kauryashika82
 
Ecosystem Interactions Class Discussion Presentation in Blue Green Lined Styl...
Ecosystem Interactions Class Discussion Presentation in Blue Green Lined Styl...Ecosystem Interactions Class Discussion Presentation in Blue Green Lined Styl...
Ecosystem Interactions Class Discussion Presentation in Blue Green Lined Styl...
fonyou31
 

Recently uploaded (20)

Software Engineering Methodologies (overview)
Software Engineering Methodologies (overview)Software Engineering Methodologies (overview)
Software Engineering Methodologies (overview)
 
Sanyam Choudhary Chemistry practical.pdf
Sanyam Choudhary Chemistry practical.pdfSanyam Choudhary Chemistry practical.pdf
Sanyam Choudhary Chemistry practical.pdf
 
Grant Readiness 101 TechSoup and Remy Consulting
Grant Readiness 101 TechSoup and Remy ConsultingGrant Readiness 101 TechSoup and Remy Consulting
Grant Readiness 101 TechSoup and Remy Consulting
 
Sports & Fitness Value Added Course FY..
Sports & Fitness Value Added Course FY..Sports & Fitness Value Added Course FY..
Sports & Fitness Value Added Course FY..
 
Z Score,T Score, Percential Rank and Box Plot Graph
Z Score,T Score, Percential Rank and Box Plot GraphZ Score,T Score, Percential Rank and Box Plot Graph
Z Score,T Score, Percential Rank and Box Plot Graph
 
1029 - Danh muc Sach Giao Khoa 10 . pdf
1029 -  Danh muc Sach Giao Khoa 10 . pdf1029 -  Danh muc Sach Giao Khoa 10 . pdf
1029 - Danh muc Sach Giao Khoa 10 . pdf
 
The Most Excellent Way | 1 Corinthians 13
The Most Excellent Way | 1 Corinthians 13The Most Excellent Way | 1 Corinthians 13
The Most Excellent Way | 1 Corinthians 13
 
microwave assisted reaction. General introduction
microwave assisted reaction. General introductionmicrowave assisted reaction. General introduction
microwave assisted reaction. General introduction
 
Advanced Views - Calendar View in Odoo 17
Advanced Views - Calendar View in Odoo 17Advanced Views - Calendar View in Odoo 17
Advanced Views - Calendar View in Odoo 17
 
Web & Social Media Analytics Previous Year Question Paper.pdf
Web & Social Media Analytics Previous Year Question Paper.pdfWeb & Social Media Analytics Previous Year Question Paper.pdf
Web & Social Media Analytics Previous Year Question Paper.pdf
 
IGNOU MSCCFT and PGDCFT Exam Question Pattern: MCFT003 Counselling and Family...
IGNOU MSCCFT and PGDCFT Exam Question Pattern: MCFT003 Counselling and Family...IGNOU MSCCFT and PGDCFT Exam Question Pattern: MCFT003 Counselling and Family...
IGNOU MSCCFT and PGDCFT Exam Question Pattern: MCFT003 Counselling and Family...
 
Accessible design: Minimum effort, maximum impact
Accessible design: Minimum effort, maximum impactAccessible design: Minimum effort, maximum impact
Accessible design: Minimum effort, maximum impact
 
Russian Escort Service in Delhi 11k Hotel Foreigner Russian Call Girls in Delhi
Russian Escort Service in Delhi 11k Hotel Foreigner Russian Call Girls in DelhiRussian Escort Service in Delhi 11k Hotel Foreigner Russian Call Girls in Delhi
Russian Escort Service in Delhi 11k Hotel Foreigner Russian Call Girls in Delhi
 
SOCIAL AND HISTORICAL CONTEXT - LFTVD.pptx
SOCIAL AND HISTORICAL CONTEXT - LFTVD.pptxSOCIAL AND HISTORICAL CONTEXT - LFTVD.pptx
SOCIAL AND HISTORICAL CONTEXT - LFTVD.pptx
 
Introduction to Nonprofit Accounting: The Basics
Introduction to Nonprofit Accounting: The BasicsIntroduction to Nonprofit Accounting: The Basics
Introduction to Nonprofit Accounting: The Basics
 
Presentation by Andreas Schleicher Tackling the School Absenteeism Crisis 30 ...
Presentation by Andreas Schleicher Tackling the School Absenteeism Crisis 30 ...Presentation by Andreas Schleicher Tackling the School Absenteeism Crisis 30 ...
Presentation by Andreas Schleicher Tackling the School Absenteeism Crisis 30 ...
 
Ecosystem Interactions Class Discussion Presentation in Blue Green Lined Styl...
Ecosystem Interactions Class Discussion Presentation in Blue Green Lined Styl...Ecosystem Interactions Class Discussion Presentation in Blue Green Lined Styl...
Ecosystem Interactions Class Discussion Presentation in Blue Green Lined Styl...
 
Interactive Powerpoint_How to Master effective communication
Interactive Powerpoint_How to Master effective communicationInteractive Powerpoint_How to Master effective communication
Interactive Powerpoint_How to Master effective communication
 
Class 11th Physics NEET formula sheet pdf
Class 11th Physics NEET formula sheet pdfClass 11th Physics NEET formula sheet pdf
Class 11th Physics NEET formula sheet pdf
 
Call Girls in Dwarka Mor Delhi Contact Us 9654467111
Call Girls in Dwarka Mor Delhi Contact Us 9654467111Call Girls in Dwarka Mor Delhi Contact Us 9654467111
Call Girls in Dwarka Mor Delhi Contact Us 9654467111
 

Laboratory Experiment. Number 6 & 7Heat Treatment and Hardenabil.docx

  • 1. Laboratory Experiment. Number 6 & 7 Heat Treatment and Hardenability of Steels Laboratory Experiment No. 6 & 7 Heat Treatment and Hardenability of Steels Abstract This experiment is attempted to measure the hardenability of the steel and understand the process of heat treatment of different materials at different cooling strategies. Cooling through different procedures will cause the materials to have different properties and different microstructures. Furthermore next stage of experiment relates the cooling rate and hardness of 1045 steel and 4143 steel. This also helps in determine how alloying a material permits it to be heat treated more homogeneously. Investigated results also proven to be close enough to expected results in obtaining higher brittleness with rapid cooling in and to improve ductility the process of tempering is proven to be very efficient with increase of tempering temperature the hardness of material must be decrease. Last but not least, after finishing experiment 6 the group found out that the lower the tempering temperature the lower the hardness. Also, the results that the group found from experiment 7 after finishing it proved being inconsistent from what it should be. Introduction The purpose of this experiment is to determine what effect heat treating and then cooling has on the hardness and grain structure of two different types of steel. The two different types of steels were utilized are 1045 steel samples and 4143 steel sample which is considered to be a low-alloy steel. The heat-treating process is a method to alter physical and mechanical properties of the material. The heat-treating process is consists of three crucial steps of annealing, hardening, and tempering. Annealing is primarily used to soften and to induce the ductility of the specimens by heating and holding at suitable temperature and then cooling, by instantly quenching in the
  • 2. water, which produces the higher brittleness with low ductility and toughness in the specimens. Moreover, tempering is a process of heat-treating, which is used to increase the toughness of metal. Tempering is important because it used to achieve desired hardness. To restore some the toughness and impact properties is obtained by tempering where specimens are reheated to a temperature between 5000 F and 10000 F for certain time which removes the internal strain caused by sudden cooling in the quenching bath without a large decrease in hardness or strength. In attempting the first phase of the experiment it cannot determined why some heat-treated materials don’t reach a high hardness when cooled at certain temperature. With the hardness test the hardness of a material can be determined. The Hardenability is a property that determines the depth and distribution of hardness when steel is heated to a given temperature and then quenched to reach martensitic structure, which is obtained by performing Jominy test, where an austenitized steel bar is quenched at one end only, thus producing a range of cooling rates along the bar. Procedure First of all, the experiment provided six 1045 steel specimens were for heat treating process, and for the second were only two steel rods of 1045 steel and 4143 steel respectively used to perform the Jominy test. In order to go though the details read the following: First the group begin with identifying all each specimen by punching different letter on to them using hammer. Second, the engineer students heated all specimens at 16000 F for 1/2 hour after obtaining the Rockwell a scale hardness measurement. Third, The four samples were quenched in water, one sample is allowed for air cool, and the other sample is set for furnace cool for one hour and quenched in water. Then, the two steel rods of different properties also allowed for heated at 16000 F for 45 minutes after obtaining the Rockwell scale hardness measurements. Also, the group measured the Rockwell a scale hardness on all six quenched specimens after being heat
  • 3. treated and tempered the three-quenched specimen at different temperature of 6000 F, 8000 F, and 10000 F respectively for 30 minutes. After tempering specimens then quenched in water. Moreover, obtained hardness measurements using Brinell (3000 kg) and Rockwell A scale on all six steel specimens. In order to perform the Jominy test one steel rod is then removed from the furnace and is placed in the cooling tower for 10 minutes before quenching in water, repeated the same procedure for other steel rod. Finally, measured the hardness 1/16 inch for the first inch and every 1/8 for the next inch and 1/4 for the next 2 inches using Rockwell a scale for both steel rods. Results and Discussions The experiments “Heat Treatment of Steel” and “Hardenability of Steel” are two different experiments, which show the effects of heat-treating, and quenching of specimen provides different hardness and microstructure in the materials. During first phase of experiment the two specimens are left to cool at room temperature and furnace temperature, these specimens were quenched after an hour. The reason for this quenching after an hour is due to the fact that the grains in the material are given a chance to form when cooling at room temperature and furnace cooling temperature. If the grains are not given enough time to form when cooling at room and oven temperature the grain structure would not be accurate as if actually air cooled and furnace cooled. From the Table 1 it can be clearly seen the hardness obtained through furnace cooled is lesser than hardness obtained by air cooled specimens because in furnace cooling allow the grains to from due to its slow cooling process where as during air cool specimens tends to cool much quicker compare to furnace cool and specimens have less time to form grains. Due to that specimens will have more boundaries, which mean there will be more interference with dislocation motion. Also, in Table 1 it shows the Rockwell measurement is 76.99 for the instant quench. On the other hand, the furnace cooled is 55.05. Moreover, in Table 2 represent the Ultimate Tensile strength (psi) for all samples from the average Brinell Hardness
  • 4. number obtained. In fact, the hardness of both of the measured BNH and the measured Rockwell are decreasing. The Ultimate Tensile Strength (psi) is also decreasing because the hardness is going down. As we know the harder a material is the higher the strength is. Furthermore, the instant quenched sample has the highest hardness and the Ultimate Tensile strength results. Finally, Table 3 represents the hardness of the Steel 1045 sample after it has been placed at different tempering temperatures. Moreover, Table 4 shows the difference in hardness between Steel 1045 and Steel 4143 that that was taken at different distance from the quenched end. Table 1 Comparison between performed Brinell hardness numbers measurements with Brinell hardness numbers obtained by conversion of Rockwell A scale measurements. Specimens Rockwell A scale measurements RHA Conversion to BHN Dimple Diameters (mm) BHN from Dimple Diameters S instant quench 76.99 500 2.50 601 H Tempered @540 0C 71.58 390 3.20 363 D Tempered @ 430 0C 69.19 353 2.90
  • 5. 444 K Tempered @ 315 0C 70.89 381 2.81 417 M (air cooled) 53.39 172 4.29 197 E (Furnace cooled) 53.05 169 4.51 179 Table 2 Computed Ultimate Tensile strength (psi) based on the average Brinell Hardness number obtained. Specimens Measured BHN (3000)kg Measured Rockwell A scale numbers (HRA ) Conversion BHN Average BHN Ultimate Tensile Strength (psi) S 401 75.53 500 550.5 2.75E+05 D 429 71.71
  • 6. 353 398.5 1.99E+05 K 444 66.89 381 399 2.00E+05 H 388 66.99 390 376.5 1.88E+05 M 211 55.92 172 184.5 9.23E+04 E 363 52.10 169 174 8.70E+04 The obtained Brinell hardness comparing to Brinell hardness obtained from the conversion scale of Rockwell A scale hardness both results increase and decrease accordingly to the hardness. The data represented in Table 1 and Figure 1 shows that Brinell hardness increase in relation to the cooling rate and heat treating hardness for Rockwell A scale hardness measurements, but did not increase between specimens “K” and “D” instead hardness went down. If both the Brinell hardness
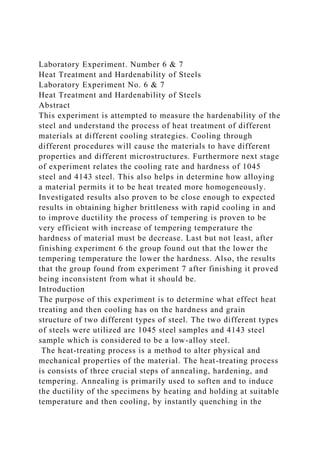
  • 7. and Rockwell a numbers were proportional to each other a straight line would be seen. A graph like the one shown in Figure 1 could be a result of an inaccurate machine or inaccurate measurement taking strategies. Figure 1 Brinell Hardness numbers vs. Rockwell A scale numbers obtained after heat treating of the specimens. Table 3 The hardness measurements obtained using Rockwell A scale for three 1045 steel specimens that has been tempered at different temperatures after being heat treated. Specimens Hardness Rockwell A scale (HRA) Tempering temperature ( c ) D 71.71 430 K 66.89 315 H 66.99 540 Figure 2 Hardness obtained using Rockwell A scale hardness after tempering the specimens. To obtain desired mechanical properties in steel specimens it is necessary to process heat treating, quenching, and tempering of the steel. Hardening is way of making steel harder, by first heat treating the specimens to 8850 C for half hour and immediately cools it by quenching the specimens in water, which increase the brittleness of the substance at much higher rate with very low ductility and toughness in the samples. The tempering is the process through which brittleness is reduced to improve
  • 8. ductility and toughness by heating the specimens at different temperature for certain time. Higher tempering temperature will yield a somewhat softer material with higher toughness, whereas a lower tempering temperature will produce a harder and somewhat more brittle material, as shown by the Figure 2 where hardness increases with the increase of tempering temperature. The possible errors of not quenching the specimens in desired time or factors of obtaining the hardness of the samples at softer spot may have occurred in processing the tempering of specimens, which resulted on the graphs for not obtaining consistency. The decline in hardness of tempered specimens once has been heat treated and quenched in Table 3 proves the hypothesis of decrease in brittleness by tempering the specimens. The Ultimate tensile strength of materials is determined using equation 1 by using data collected for Brinell hardness for all the specimens mentioned in Table 2. Equation 1 Calculating the Ultimate Tensile Strength of materials. In determining the strength, obtaining the hardness is great ways of making comparison, which can be attain using Rockwell A scale and Brinell hardness scale which is directly proportional to the tensile strength. In using Brinell hardness scale timing in maintaining the load on the specimens may have been a factor of slight variation of results where as in Rockwell A scale ha From the Figure 4 the amount of carbide ((Fe3C) can be calculated at temperature 1338 0F for 1045 steel using equation 2 where C1 is 45% because that is the weight percent of carbon in 1045 steel. Ca and Cb calculated using the lever rule which consists of drawing a line across to determine how much weight percent of material there is in the steel, where “a” is alpha and “b” is Iron Carbide (Fe3C). Using equation 2 is determined that Iron carbide percent is about 0.68% and 99.32% is presumed to be alpha phase.
  • 9. Wb = (C1 – Ca)/(Cb – Ca) , Ca= 2.2%, and Cb= 65% are the weight percent composition. Equation 2 To find the Fe3C (carbide) content using weight percent equation. Figure 4 The iron-iron carbide phase diagram. Different microstructures obtained when specimens processed through differen cooling strategies that is why the TTT (Time, Temperature, Transformation) chart in Figure 5 is proven to be great tool in determining the microstructure. The TTT chart shows the amount of time needed to quench a material to reach a certain phase. The left part line represents the beginning of the transformation and the right part line represents the conclusion of the transformation. The TTT chart also explains the need of quenching the specimens after an hour of cooling due to after certain time the specimens does not require any more transformation. The martensite structure which is one of the hardest of all phases is obtained upon quenching instantly to a low temperature. But the other samples that quenched were temperd again to move higher up in the TTT chart where less hardened materials are . To obtained a desired phase it is neccsary to for rapid change in temperature with respect to time when quenching the 1045 steel to reach a Bainite phase. The specimens that were furnace cooled and cooled at room temperature are most likely to fall in the pearlite phase where the one cooled at room temperature is said to be fine pearlite while the other one is more close to coarse pearlite due to slow cooling process. The specimens tempered at 540°C falls between pearlite and bainite phases. The specimens tempered at 430°C and 315°C fall under the Bainite phase, the one tempered at a lower temperature could be classified as being of finer Bainite. Figure 5 The TTT (Time, Temperature, Transformation) chart for 1045 steel.
  • 10. Microstructure and hardness are closely correlated; microstructure consists of grain size and crystal structure. When the specimens were reached at austenite phase, the grains are more uniform and homogeneously distributed; upon completion of this process the specimens are ready to be cooled in order to obtain different hardeneability in the material. During instant quenching of the specimens the specimens with evenly distributed grains are not given a chance to form and are then solidified giving the material a fine grain structure in contrast to a material slowly cooling which gives a material more coarse grains making the material less hard and more ductile. The Jominy test results illustrated in Figure 3 prove that how cooling rate affects hardness data obtained on the attempt of experiment. The greater distance of quenching the less hard the material is because, as mentioned before, the grains are given more time to form, and the bigger the grains the less hard the material. The inconsistency among results obtained instead of constantly moving downward may have caused due to experimental errors such as not placing it fast enough on the Jominy tester. The graph line obtained by the 4143steel and 1045 steel quickly goes up and down not opening the water enough for quenching during the Jominy test. The overall graph is also does not matches to the expected results where 1045 steel graph must lower than the graph line obtained by the 4061 steel rod specimen is considered to be an experimental error of not transporting the specimen on the tester with in time duration. Table 4 The Jominy test results obtained on two steel rods. Distance from quenched end (in) 1045 Steel 4143 Steel 0.0625 75.9 66.2
  • 13. 2.5 47.5 49.7 2.75 46.9 45.5 3 44.2 45.8 3.25 38.6 45.1 3.5 40.1 22.9 3.75 42.7 32 4 36.4 26.3 Figure 3 Plot showing Hardness as a function of distance from the quenched end for 1045 steel and 4061 steel specimens. The dash line is the Steel 4061 and the solid line is the Steel 1045. Conclusion Materials that cool at slower cooling rates tend to be softer materials while those that are cooled at faster cooling rates tend to be harder. Tempering a material lowers its ultimate strength but increases the amount of stress the material can absorb (toughness), higher the tempering temperature the lower the ultimate strength. Tempering also adds more ductile characteristics to the material. High hardness in materials only
  • 14. can be attain when there is a low toughness, in order to acquire toughness in a material that has been quenched, The tempering of the specimens is then processed to improve the toughness in the material and lower the brittleness.Fine grain structures tend to be hard material where as materials with coarse grain structure has more ductile properties. Furthermore, the data does not accurately show what should be happening. The data I collected has error that is obviously shows in my graph. The graph should show a straight line going down similar to the one in experiment 6. For example, after heating the Steel and quenched it the group had to measured it and probably by mistake the engineer student measured the same point twice or took similar points close to each other. Also, maybe the time it took to move the Steel from furnace to be quenched was too long which effected the measurements. Moreover, the water that was used to quench could have been too strong hitting the specimen, which leads to make a huge differences in measurements. References D. Callister Jr, Fundamentals of Materials Science and Engineering, J. Wiley & Sons, NY, 3rd Ed. 2008, Flinn and Trojan, Engineering Materials and Their Application, Chapter 6 Dieter, Mechanical Metallurgy ASM Handbook on Heat Treatment, Vol. 2 http://www.smt.sandvik.com/en/products/strip-steel-and-strip- based-products/strip-products/knife-steel/hardening- guide/purpose-of-hardening-and-tempering/ http://www.carbidedepot.com/formulas-hardness.htm William D. Callister, Jr., David G. Rethwisch. Fundamentals of materials science and engineering, third edition www.csun.edu/~bavarian/Courses/MSE%20227/Labs/2- Charpy_test.pdf
  • 15. Rockwell A Hardness vs. Tempering Temperature 540.0 315.0 71.58 70.89 Tempering Temperature (C) Hardness (Rockwell A scale) Distance From Quenching (in) vs. Hardness (HRA) 1045 Steel 0.0625 0.125 0.1875 0.25 0.3125 0.375 0.4375 0.5 0.5625 0.625 0.6875 0.75 0.8125 0.875 0.9375 1.0 1.125 1.25 1.375 1.5 1.625 1.75 1.875 2.0 2.25 2.5 2.75 3.0 3.25 3.5 3.75 4.0 75.9 72.2 61.7 50.3 58.2 56.9 55.6 55.9 53.6 55.7 54.4 49.7 51.8 51.2 51.6 50.2 49.2 50.8 50.5 48.4 49.2 49.1 47.8 47.2 47.3 47.5 46.9 44.2 38.6 40.1 42.7 36.4 4061 Steel 0.0625 0.125 0.1875 0.25 0.3125 0.375 0.4375 0.5 0.5625 0.625 0.6875 0.75 0.8125 0.875 0.9375 1.0 1.125 1.25 1.375 1.5 1.625 1.75 1.875 2.0 2.25 2.5 2.75 3.0 3.25 3.5 3.75 4.0 66.2 66.4 66.5 68.5 67.6 61.3 65.1 60.8 60.6 61.4 57.8 58.2 53.8 55.9 51.9 56.6 52.3 55.0 53.5 51.8 49.8 51.9 52.0 47.7 49.7 49.7 45.5 45.8 45.1 22.9 32.0 26.3 Distance From Quenching (in) Hardness (HRA) Brinell Hardness (krg) vs. Rockwell A Hardness (hra) BHN vs. Rockwell A 601.0 444.0 417.0 363.0 197.0 179.0 76.99 69.19 70.89 71.58 53.39 53.05 Brinell Hardness (krg) Hardness (Rockwell A scale) hra