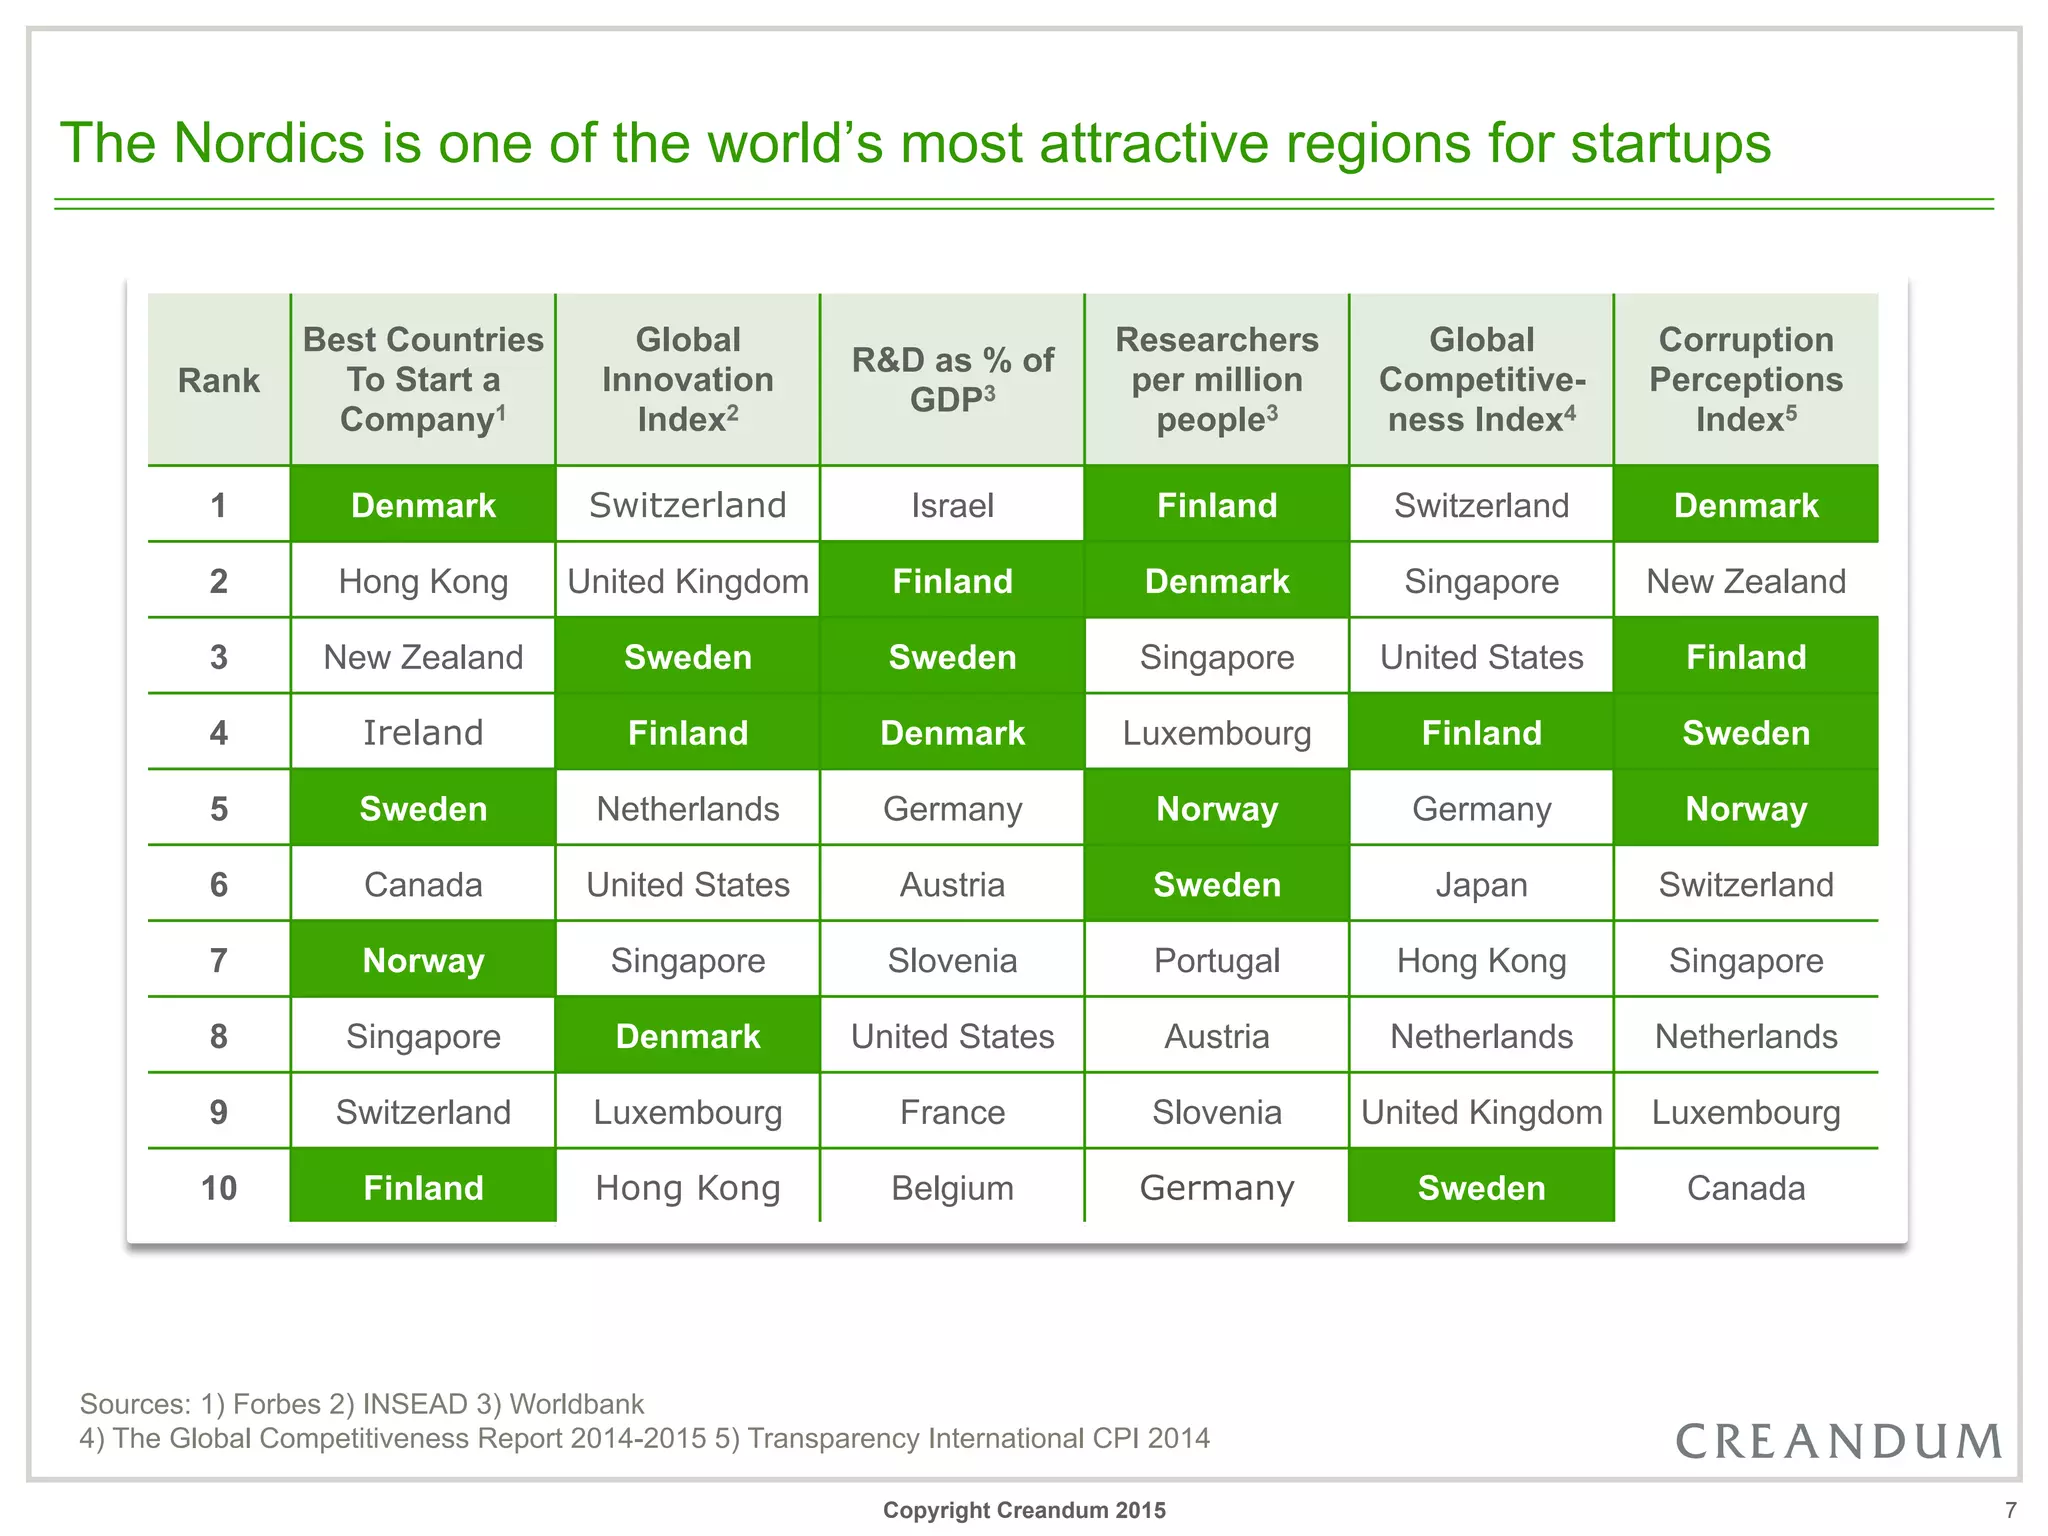
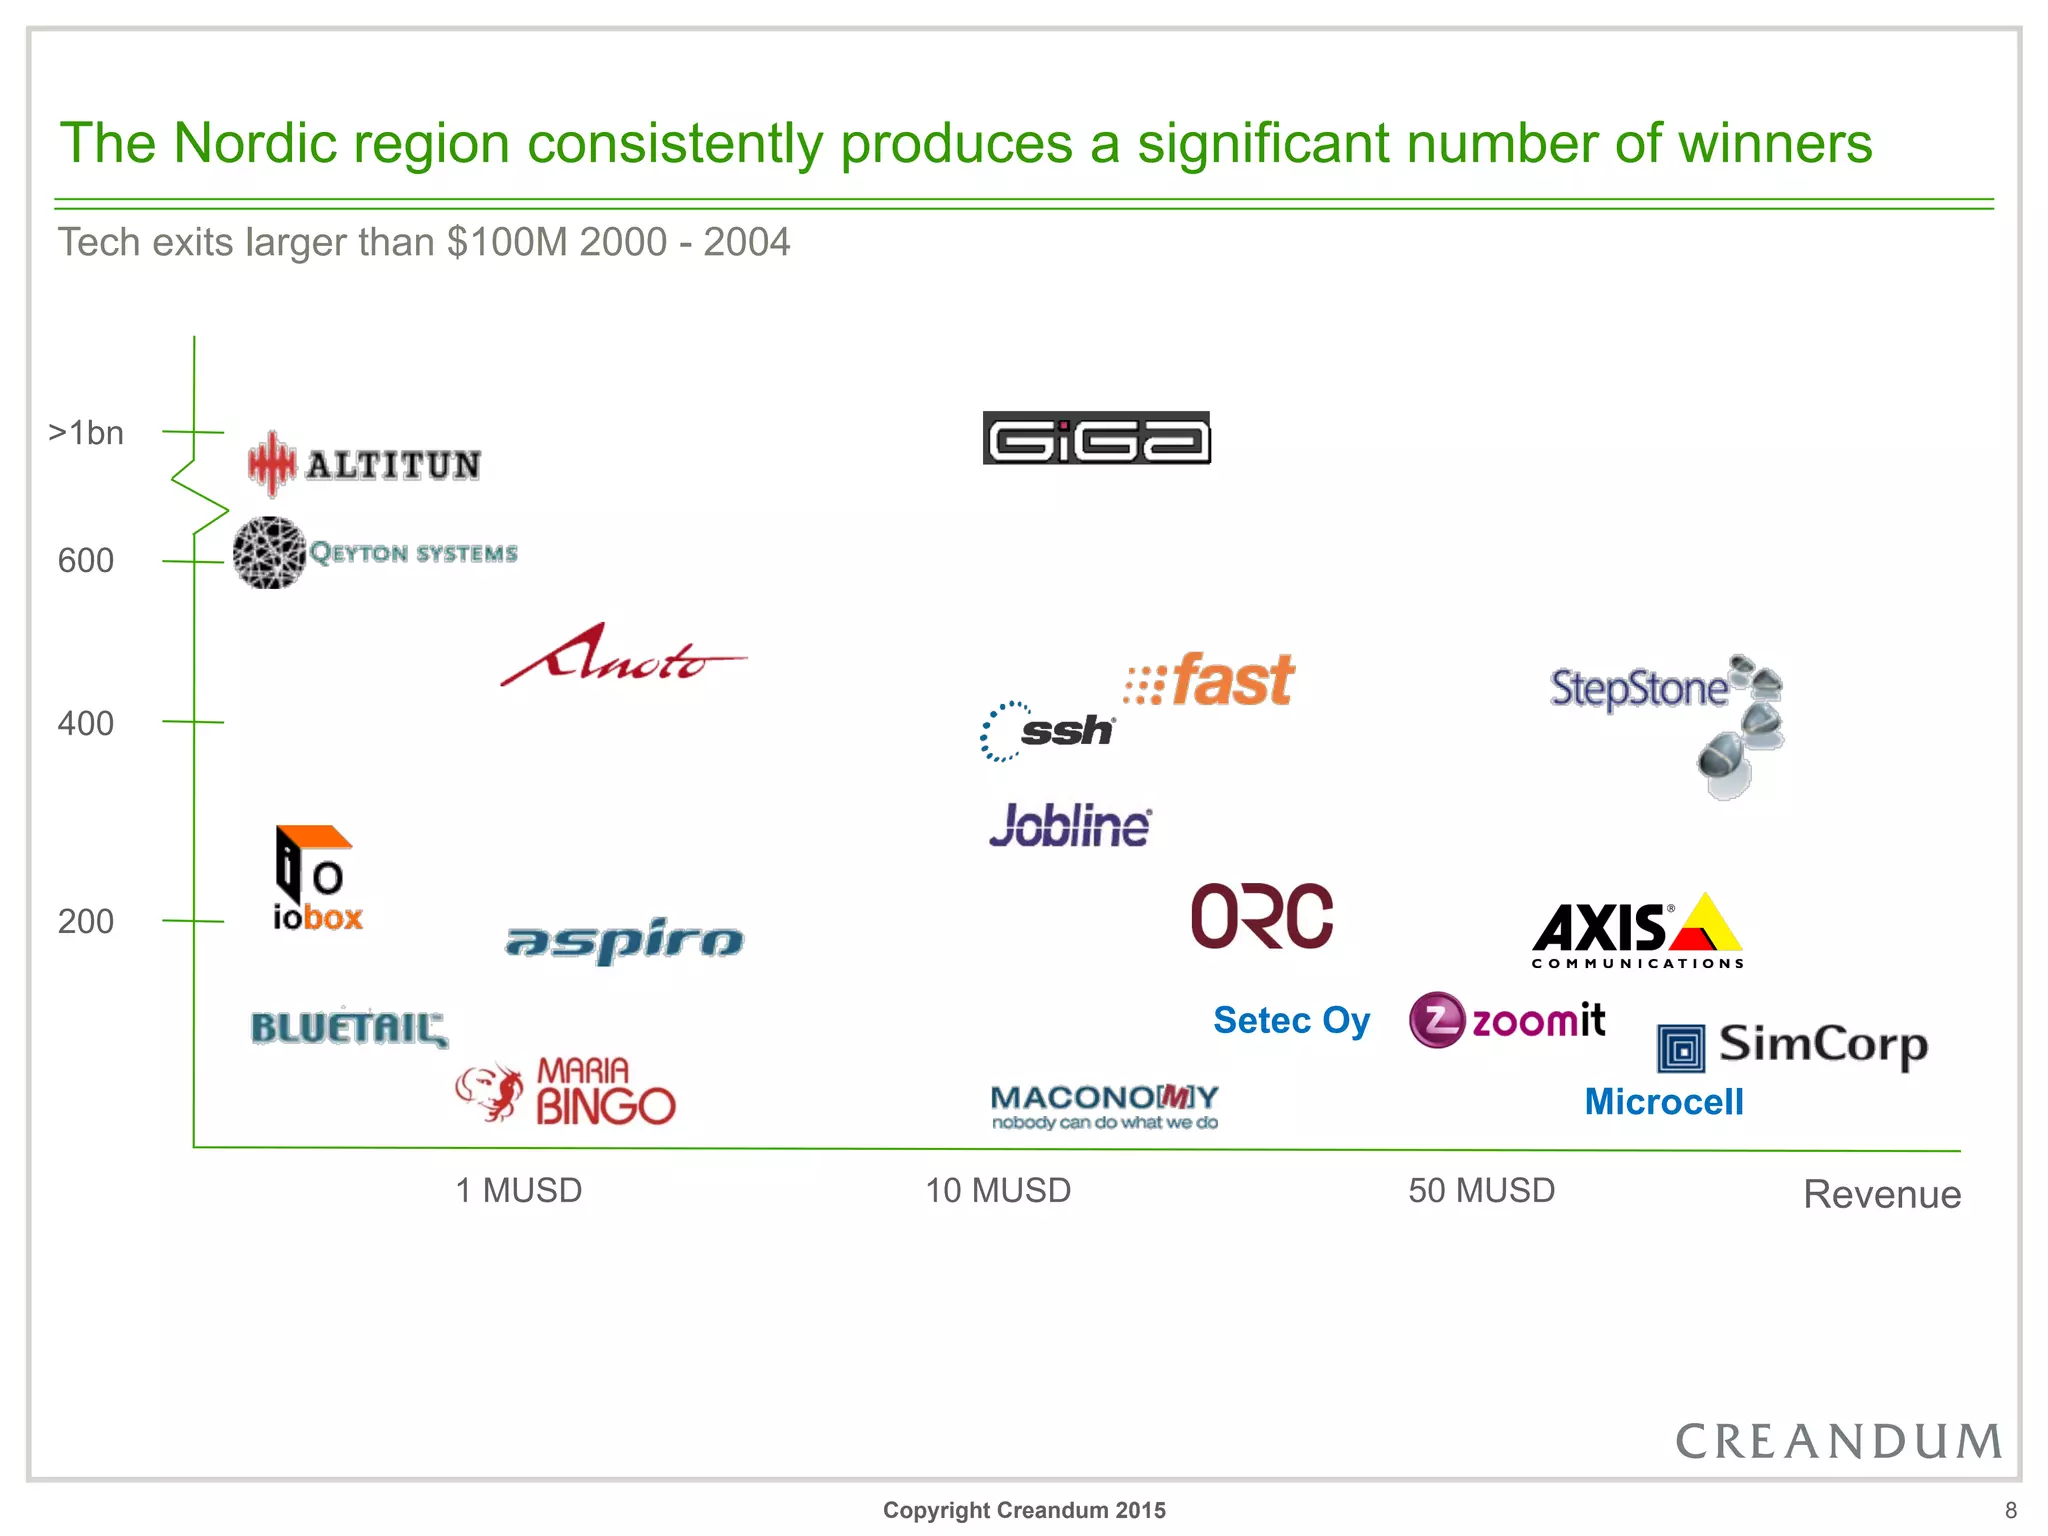
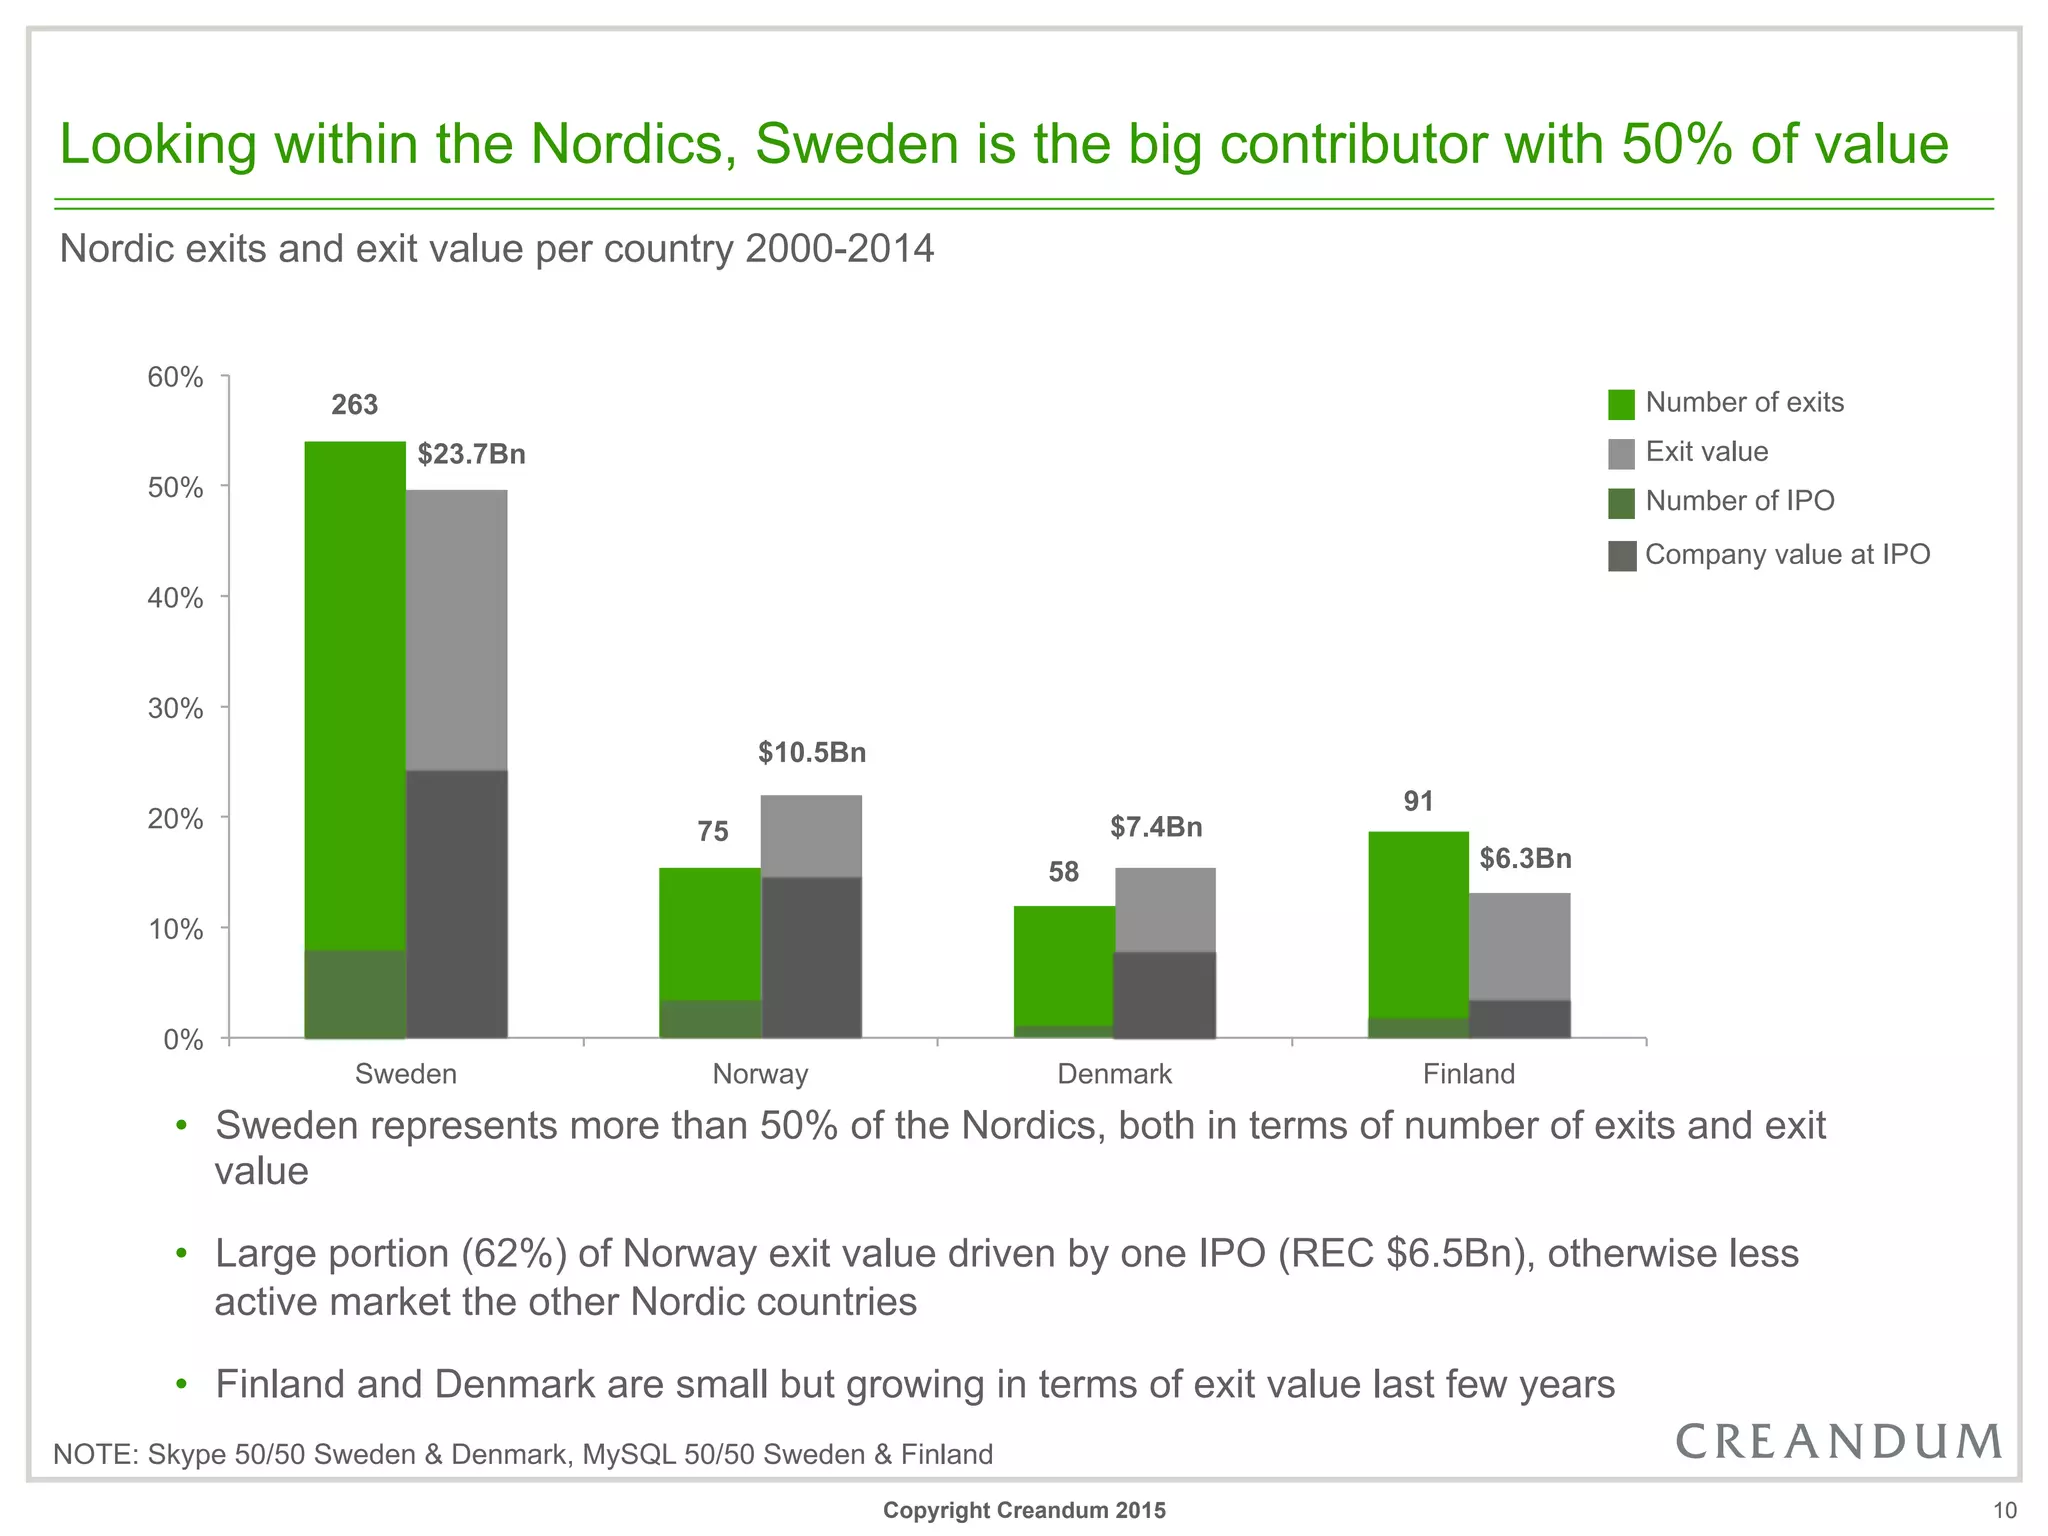
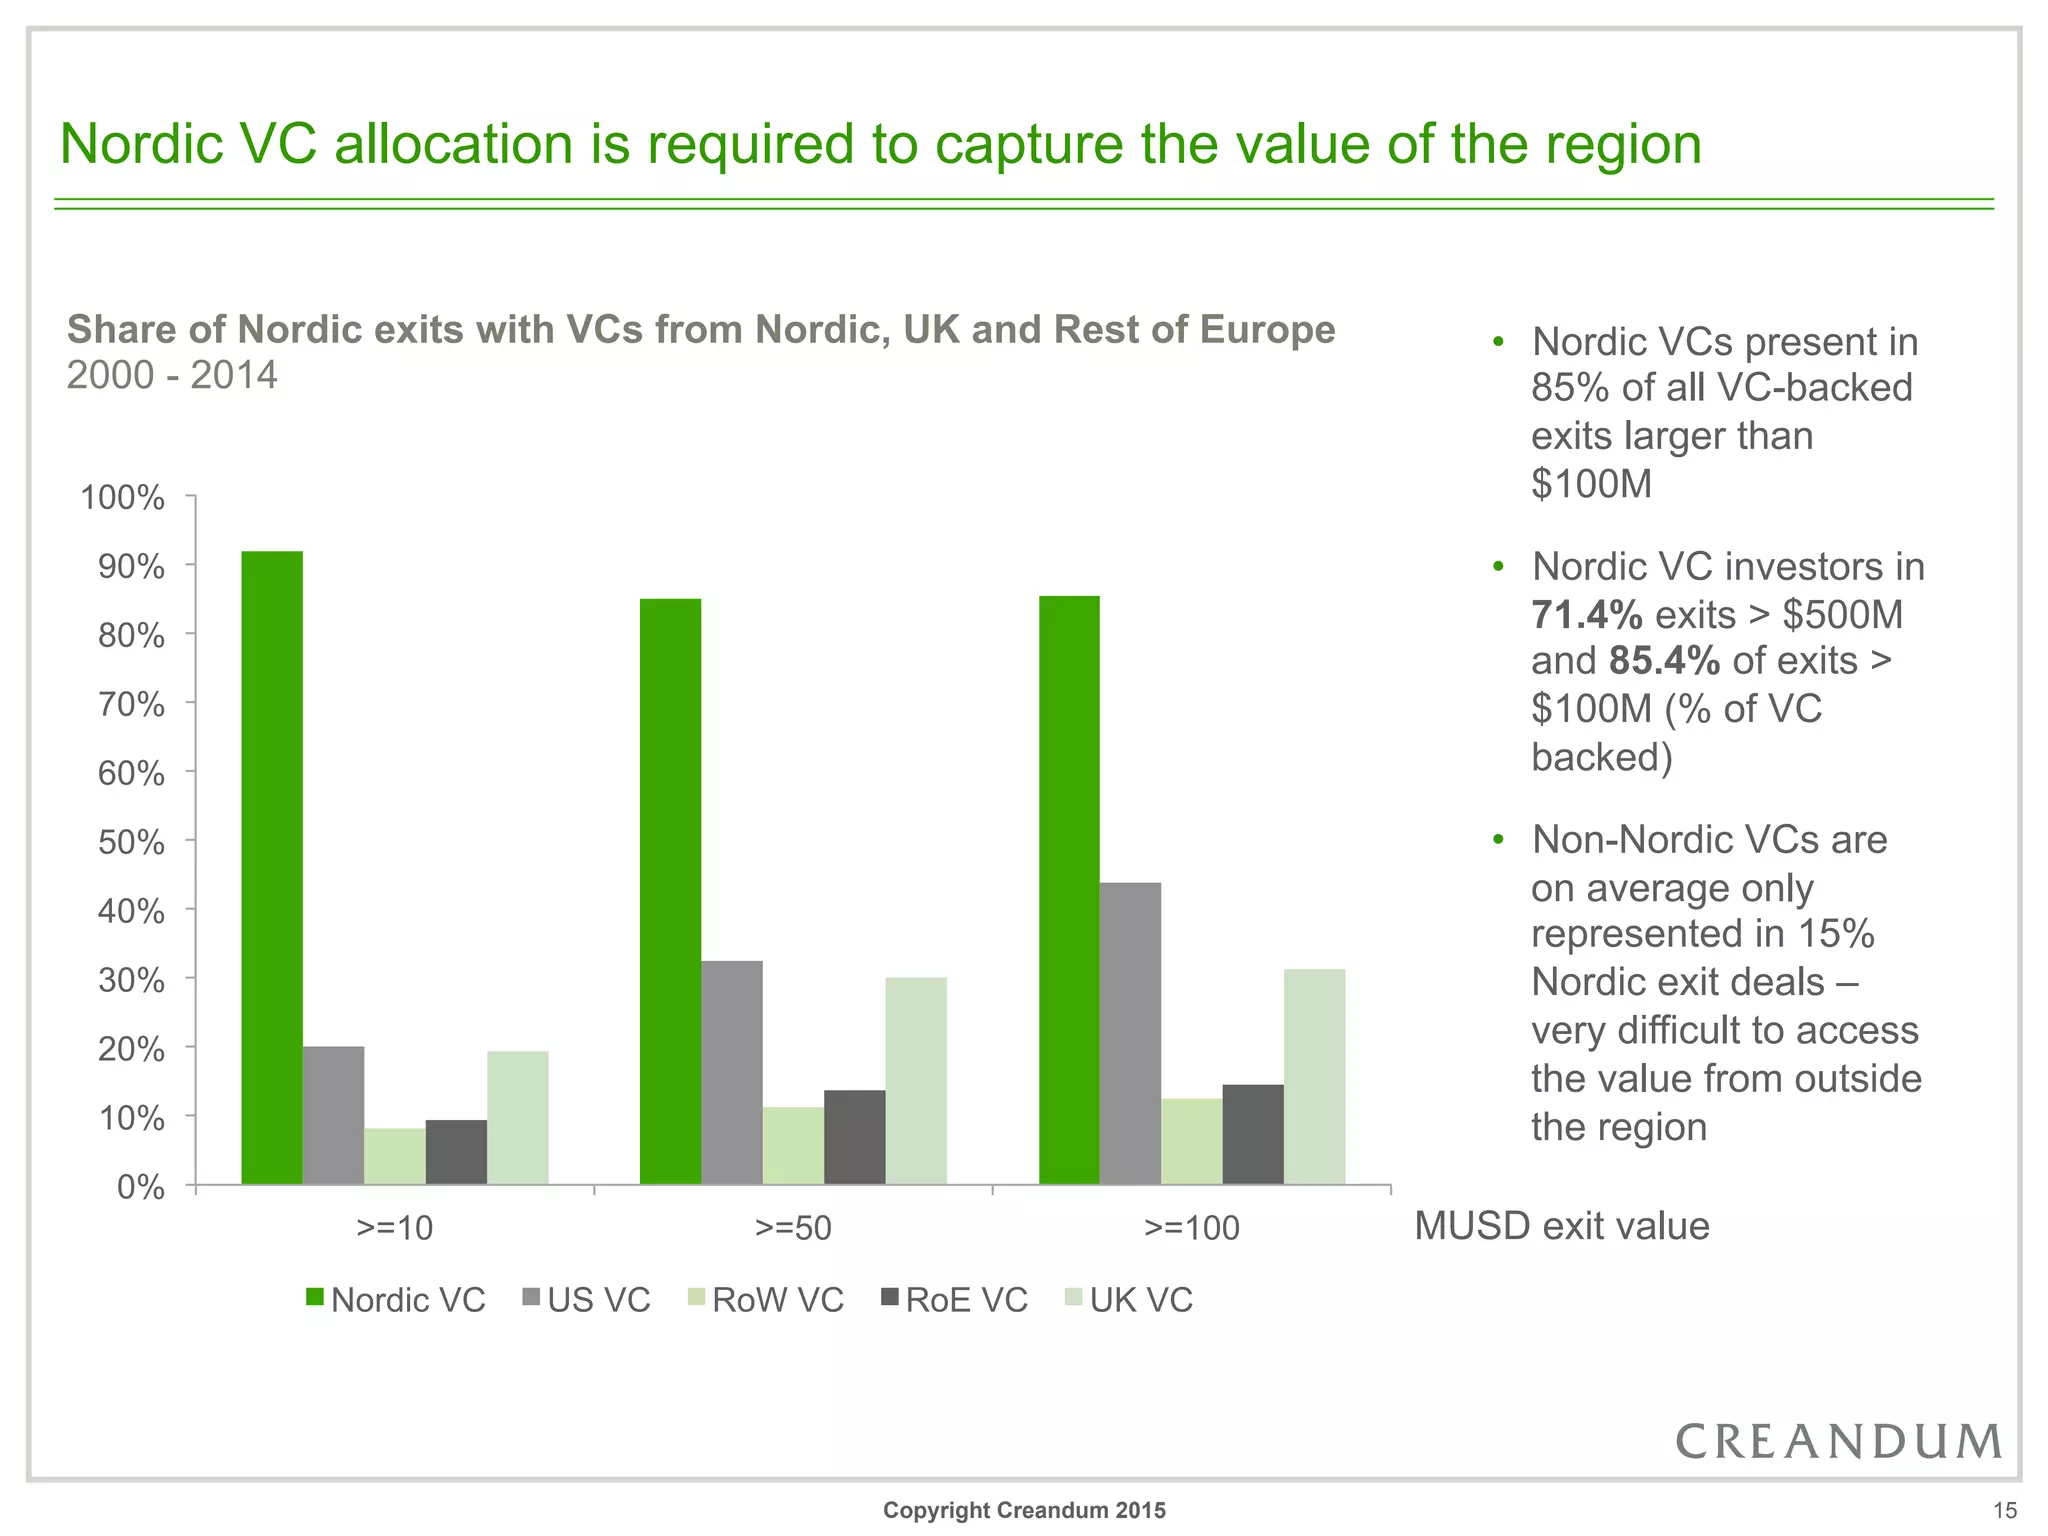
2014 was the best year ever for Nordic tech exits
•  2014 marked the best year ever in terms of exit value for Nordic
companies including three BUSD exits and more than $13 billion
in total exit value
•  The Nordic tech opportunity is large and steadily growing,
average exit value last 5 years is >$4 billion per year
•  Although the Nordics only represents 2% of global GDP, it
represents close to 10% of global BUSD exits
•  Looking at Europe, the Nordic stands for the majority of BUSD
exits (53% last 10 years) although the region only attracts
around 10% of VC capital
•  Within the Nordics, Sweden is the dominant market,
contributing to 50% of the Nordic exit value
•  Digital consumer services is the most valuable sector, but
software produces most >$100 million exits and is growing fast
•  Nordic VC allocation is required to capture the value in the
region, Nordic VC capital is invested in ~90% of Nordic winners
Copyright Creandum 2015
Creandum exit database
•  Database with ~490 private technology company exits
•  20+ parameters covered including exit value, exit revenue, exit type, years from
inception to exit
•  Companies originated from Denmark, Finland, Norway & Sweden
•  Focus on VC & angel investments – no buyout or privatizations
•  Exit value ($m) of companies at time of 1st trade sale or IPO (end of 1st day trading)
•  EXCLUDING Life science, med tech, bio tech, retail, energy (oil & gas etc),
environmental and consulting
•  Feel free to use the material but please mention the source
2Copyright Creandum 2015
Nordic entrepreneurs create world class companies and services
3
Sample of recent successful companies & services created by Nordic entrepreneurs
Note: Skype, Soundcloud, SuccessFactors, Playfish, Prezi primarily established outside Nordics
Copyright Creandum 2015
5 308
553
47 289 585
6 292
8 068
1 692 1 665
363
2 262
1 150
303
3 382
13 391
-
2 000
4 000
6 000
8 000
10 000
12 000
14 000
2000 2001 2002 2003 2004 2005 2006 2007 2008 2009 2010 2011 2012 2013 2014
M&A
IPO
Total Nordic exit value 2000-2014
The Nordic tech opportunity is large and steadily growing
•  Average exit value per year for the last five years is $4.1Bn
•  Total exit market value increased 3x between economic cycle in ’00-’04 and ‘10-’14
•  7.0% of M&As & IPOs represent 80% of total exit value
•  VC investors in 93.3% of exits > $500M and 81.4% of exits > €100M (% of VC backed exits)
MUSD
Exit year
Avg. annual exit value 2000-2004 Avg. annual exit value 2005-2009
4
$1.4Bn
$3.6Bn
$4.1Bn
Avg. annual exit value 2010-2014
Copyright Creandum 2015
12%
13%
Although being a small region, almost 10% of global BUSD exits are Nordic
•  Although accounting for 2% of global GDP, Nordic companies represented 9% of all global BUSD
technology exits
5
Nordics
GDP
BUSD
Exits*
Note: GDP based on 2013 numbers
* Share of exits in USD 2005 - 2014
RoEU US
China RoW
2%
9%
4.5x
27%
8%
0.3x
22%
66%
3.0x
1.1x
36%
5%
0.1x
GDP
BUSD
Exits*
GDP
BUSD
Exits*
GDP
BUSD
Exits*
GDP
BUSD
Exits*
Copyright Creandum 2015
*SoundCloud & Avito: Swedish founders but included in RoE
Billion dollar exits
Deloitte Europe
Fast-500 companies
The World's Most
Valuable Private Tech
Companies*
Amount of VC investment
…and constitutes of a disproportionally large portion of the European market
Nordics Rest of Europe
Population
6
53%
47%
Share of exits between 2005 - 2014
24%
76%
BUSD software
companies founded
since 2003*
30%
70%
11%
89%
3%
97%
Share or companies 2014 Share of tech VC 2014
Business Insider: Digital 100 Source: Atomico
28%
8%64%
Soundcloud
& Avito*
Copyright Creandum 2015
The Nordics is one of the world’s most attractive regions for startups
Sources: 1) Forbes 2) INSEAD 3) Worldbank
4) The Global Competitiveness Report 2014-2015 5) Transparency International CPI 2014
Rank
Best Countries
To Start a
Company1
Global
Innovation
Index2
R&D as % of
GDP3
Researchers
per million
people3
Global
Competitive-
ness Index4
Corruption
Perceptions
Index5
1 Denmark Switzerland Israel Finland Switzerland Denmark
2 Hong Kong United Kingdom Finland Denmark Singapore New Zealand
3 New Zealand Sweden Sweden Singapore United States Finland
4 Ireland Finland Denmark Luxembourg Finland Sweden
5 Sweden Netherlands Germany Norway Germany Norway
6 Canada United States Austria Sweden Japan Switzerland
7 Norway Singapore Slovenia Portugal Hong Kong Singapore
8 Singapore Denmark United States Austria Netherlands Netherlands
9 Switzerland Luxembourg France Slovenia United Kingdom Luxembourg
10 Finland Hong Kong Belgium Germany Sweden Canada
7Copyright Creandum 2015
1 MUSD 50 MUSD10 MUSD Revenue
The Nordic region consistently produces a significant number of winners
8
Tech exits larger than $100M 2000 - 2004
200
400
600
>1bn
Microcell
Setec Oy
Copyright Creandum 2015
Revenue
9
With a strong trends towards even higher revenues
1 MUSD 50 MUSD10 MUSD
Tech exits larger than $100M 2005 - 2014
200
400
600
>1bn
Copyright Creandum 2015
0%
10%
20%
30%
40%
50%
60%
Sweden Norway Denmark Finland
Looking within the Nordics, Sweden is the big contributor with 50% of value
10
•  Sweden represents more than 50% of the Nordics, both in terms of number of exits and exit
value
•  Large portion (62%) of Norway exit value driven by one IPO (REC $6.5Bn), otherwise less
active market the other Nordic countries
•  Finland and Denmark are small but growing in terms of exit value last few years
Nordic exits and exit value per country 2000-2014
263
75
58
91
$23.7Bn
$10.5Bn
$7.4Bn
$6.3Bn
Number of IPO
Company value at IPO
Exit value
Number of exits
NOTE: Skype 50/50 Sweden & Denmark, MySQL 50/50 Sweden & Finland
Copyright Creandum 2015
… and dominates in no of exits in all exits sizes
0%
10%
20%
30%
40%
50%
60%
Sweden Norway Finland Denmark
$100 - 499 $500 - 999 $>1,000
32
12
5
9
>100 MUSD Nordic exits per country 2000-2014
•  Sweden represents 55% of all exits larger than 100 MUSD and has most exits in all intervals
Copyright Creandum 2015
Software sector increasingly important, but consumer still dominating in value
12
Distribution of Nordic exits > $100M
Number of exits
Total exit value distribution last 5 years
Percent of USD value
•  Consumer sector 75% of exit value the last 5 years, although holding a small share in number of
exits
•  Nature of consumer products and services wither being a big global hit or nothing at all driving very
high exit values compared to other sectors
•  Software increasingly important sector, while hardware is on decline in number of exits and still is not
significant in value
71%
25%
4%
Consumer
Software
Hardware
0
2
4
6
8
10
12
Consumer Software Hardware Other*
2000 - 2004 2005 - 2009 2010 - 2014
Copyright Creandum 2015
Last 5 years have seen more than one BUSD exit per year
13
14
16
14
3
3
3
6
0
5
10
15
20
25
2000 - 2004 2005 - 2009 2010 - 2014
$ >1,000
$500-999 Exits
$100 - 499 Exits
>100 MUSD Nordic exits per time interval
•  On average, one BUSD tech company form the Nordics last 10 years
•  2x number of BUSD exits last 5 years vs 10 years before
Copyright Creandum 2015
Trade sale to US most important for large exits
14
•  Almost all exit value created in the Nordics is by M&A, especially after IPO market dried up in 2001
•  Most large exits are trade sale to US companies
M&A
Exit
intervals
in MUSD
Exit value per exit type
Share of exit value in USD
Exit distribution per exit size
Share of number of exits to each region per exit size
interval
	
  
440	
  	
  
IPO
M&A value per geography
30%	
  
4%	
  
47%	
  
19%	
  
Inside	
  Country	
   Other	
  Nordic	
  Country	
   US	
   RoW	
  
0%	
  
20%	
  
40%	
  
60%	
  
80%	
  
100%	
  
=<	
  10	
   10	
  -­‐	
  49	
   50	
  -­‐	
  99	
   100	
  -­‐	
  499	
   ≥	
  500	
  
Copyright Creandum 2015
Nordic VC allocation is required to capture the value of the region
15
•  Nordic VCs present in
85% of all VC-backed
exits larger than
$100M
•  Nordic VC investors in
71.4% exits > $500M
and 85.4% of exits >
$100M (% of VC
backed)
•  Non-Nordic VCs are
on average only
represented in 15%
Nordic exit deals –
very difficult to access
the value from outside
the region
Share of Nordic exits with VCs from Nordic, UK and Rest of Europe
2000 - 2014
0%
10%
20%
30%
40%
50%
60%
70%
80%
90%
100%
>=10 >=50 >=100
Nordic VC US VC RoW VC RoE VC UK VC
MUSD exit value
Copyright Creandum 2015
The Nordics create larger share of unicorns, driven by early global expansion
16
Share of exits per interval >$100MUSD
Percent of number of exits
0% 10% 20% 30% 40% 50% 60% 70% 80%
$100-499
$500-999
>=$1,000
Global Nordics
•  Since Nordic is a small market regarding customers the companies are forced to be global form an
early stage in order to grow
•  This drives a different distribution of unicorns vs other exits compared to global average
0% 10% 20% 30% 40% 50% 60% 70% 80%
$100 - 499
$500-999
$>=1,000
Note: Global exits for 2014. Nordic exits for since 2010
Copyright Creandum 2015
Wrapping up
17
>  Large and growing Nordic tech market
•  $3.9Bn yearly exit value last 10 years
•  A significant part of European and global exits
•  Increased high-quality deal flow
•  Software & consumer sectors dominant and Sweden
most important geography
>  Significantly maturing ecosystem
•  More serial entrepreneurs
•  Successful entrepreneurs becoming angel investors
•  Experienced growth company management teams
available
•  Few but more experienced investors active in the region
Copyright Creandum 2015

Creandum Nordic Exit Analysis 2015

  • 1.
    2014 was thebest year ever for Nordic tech exits •  2014 marked the best year ever in terms of exit value for Nordic companies including three BUSD exits and more than $13 billion in total exit value •  The Nordic tech opportunity is large and steadily growing, average exit value last 5 years is >$4 billion per year •  Although the Nordics only represents 2% of global GDP, it represents close to 10% of global BUSD exits •  Looking at Europe, the Nordic stands for the majority of BUSD exits (53% last 10 years) although the region only attracts around 10% of VC capital •  Within the Nordics, Sweden is the dominant market, contributing to 50% of the Nordic exit value •  Digital consumer services is the most valuable sector, but software produces most >$100 million exits and is growing fast •  Nordic VC allocation is required to capture the value in the region, Nordic VC capital is invested in ~90% of Nordic winners Copyright Creandum 2015
  • 2.
    Creandum exit database • Database with ~490 private technology company exits •  20+ parameters covered including exit value, exit revenue, exit type, years from inception to exit •  Companies originated from Denmark, Finland, Norway & Sweden •  Focus on VC & angel investments – no buyout or privatizations •  Exit value ($m) of companies at time of 1st trade sale or IPO (end of 1st day trading) •  EXCLUDING Life science, med tech, bio tech, retail, energy (oil & gas etc), environmental and consulting •  Feel free to use the material but please mention the source 2Copyright Creandum 2015
  • 3.
    Nordic entrepreneurs createworld class companies and services 3 Sample of recent successful companies & services created by Nordic entrepreneurs Note: Skype, Soundcloud, SuccessFactors, Playfish, Prezi primarily established outside Nordics Copyright Creandum 2015
  • 4.
    5 308 553 47 289585 6 292 8 068 1 692 1 665 363 2 262 1 150 303 3 382 13 391 - 2 000 4 000 6 000 8 000 10 000 12 000 14 000 2000 2001 2002 2003 2004 2005 2006 2007 2008 2009 2010 2011 2012 2013 2014 M&A IPO Total Nordic exit value 2000-2014 The Nordic tech opportunity is large and steadily growing •  Average exit value per year for the last five years is $4.1Bn •  Total exit market value increased 3x between economic cycle in ’00-’04 and ‘10-’14 •  7.0% of M&As & IPOs represent 80% of total exit value •  VC investors in 93.3% of exits > $500M and 81.4% of exits > €100M (% of VC backed exits) MUSD Exit year Avg. annual exit value 2000-2004 Avg. annual exit value 2005-2009 4 $1.4Bn $3.6Bn $4.1Bn Avg. annual exit value 2010-2014 Copyright Creandum 2015
  • 5.
    12% 13% Although being asmall region, almost 10% of global BUSD exits are Nordic •  Although accounting for 2% of global GDP, Nordic companies represented 9% of all global BUSD technology exits 5 Nordics GDP BUSD Exits* Note: GDP based on 2013 numbers * Share of exits in USD 2005 - 2014 RoEU US China RoW 2% 9% 4.5x 27% 8% 0.3x 22% 66% 3.0x 1.1x 36% 5% 0.1x GDP BUSD Exits* GDP BUSD Exits* GDP BUSD Exits* GDP BUSD Exits* Copyright Creandum 2015
  • 6.
    *SoundCloud & Avito:Swedish founders but included in RoE Billion dollar exits Deloitte Europe Fast-500 companies The World's Most Valuable Private Tech Companies* Amount of VC investment …and constitutes of a disproportionally large portion of the European market Nordics Rest of Europe Population 6 53% 47% Share of exits between 2005 - 2014 24% 76% BUSD software companies founded since 2003* 30% 70% 11% 89% 3% 97% Share or companies 2014 Share of tech VC 2014 Business Insider: Digital 100 Source: Atomico 28% 8%64% Soundcloud & Avito* Copyright Creandum 2015
  • 7.
    The Nordics isone of the world’s most attractive regions for startups Sources: 1) Forbes 2) INSEAD 3) Worldbank 4) The Global Competitiveness Report 2014-2015 5) Transparency International CPI 2014 Rank Best Countries To Start a Company1 Global Innovation Index2 R&D as % of GDP3 Researchers per million people3 Global Competitive- ness Index4 Corruption Perceptions Index5 1 Denmark Switzerland Israel Finland Switzerland Denmark 2 Hong Kong United Kingdom Finland Denmark Singapore New Zealand 3 New Zealand Sweden Sweden Singapore United States Finland 4 Ireland Finland Denmark Luxembourg Finland Sweden 5 Sweden Netherlands Germany Norway Germany Norway 6 Canada United States Austria Sweden Japan Switzerland 7 Norway Singapore Slovenia Portugal Hong Kong Singapore 8 Singapore Denmark United States Austria Netherlands Netherlands 9 Switzerland Luxembourg France Slovenia United Kingdom Luxembourg 10 Finland Hong Kong Belgium Germany Sweden Canada 7Copyright Creandum 2015
  • 8.
    1 MUSD 50MUSD10 MUSD Revenue The Nordic region consistently produces a significant number of winners 8 Tech exits larger than $100M 2000 - 2004 200 400 600 >1bn Microcell Setec Oy Copyright Creandum 2015
  • 9.
    Revenue 9 With a strongtrends towards even higher revenues 1 MUSD 50 MUSD10 MUSD Tech exits larger than $100M 2005 - 2014 200 400 600 >1bn Copyright Creandum 2015
  • 10.
    0% 10% 20% 30% 40% 50% 60% Sweden Norway DenmarkFinland Looking within the Nordics, Sweden is the big contributor with 50% of value 10 •  Sweden represents more than 50% of the Nordics, both in terms of number of exits and exit value •  Large portion (62%) of Norway exit value driven by one IPO (REC $6.5Bn), otherwise less active market the other Nordic countries •  Finland and Denmark are small but growing in terms of exit value last few years Nordic exits and exit value per country 2000-2014 263 75 58 91 $23.7Bn $10.5Bn $7.4Bn $6.3Bn Number of IPO Company value at IPO Exit value Number of exits NOTE: Skype 50/50 Sweden & Denmark, MySQL 50/50 Sweden & Finland Copyright Creandum 2015
  • 11.
    … and dominatesin no of exits in all exits sizes 0% 10% 20% 30% 40% 50% 60% Sweden Norway Finland Denmark $100 - 499 $500 - 999 $>1,000 32 12 5 9 >100 MUSD Nordic exits per country 2000-2014 •  Sweden represents 55% of all exits larger than 100 MUSD and has most exits in all intervals Copyright Creandum 2015
  • 12.
    Software sector increasinglyimportant, but consumer still dominating in value 12 Distribution of Nordic exits > $100M Number of exits Total exit value distribution last 5 years Percent of USD value •  Consumer sector 75% of exit value the last 5 years, although holding a small share in number of exits •  Nature of consumer products and services wither being a big global hit or nothing at all driving very high exit values compared to other sectors •  Software increasingly important sector, while hardware is on decline in number of exits and still is not significant in value 71% 25% 4% Consumer Software Hardware 0 2 4 6 8 10 12 Consumer Software Hardware Other* 2000 - 2004 2005 - 2009 2010 - 2014 Copyright Creandum 2015
  • 13.
    Last 5 yearshave seen more than one BUSD exit per year 13 14 16 14 3 3 3 6 0 5 10 15 20 25 2000 - 2004 2005 - 2009 2010 - 2014 $ >1,000 $500-999 Exits $100 - 499 Exits >100 MUSD Nordic exits per time interval •  On average, one BUSD tech company form the Nordics last 10 years •  2x number of BUSD exits last 5 years vs 10 years before Copyright Creandum 2015
  • 14.
    Trade sale toUS most important for large exits 14 •  Almost all exit value created in the Nordics is by M&A, especially after IPO market dried up in 2001 •  Most large exits are trade sale to US companies M&A Exit intervals in MUSD Exit value per exit type Share of exit value in USD Exit distribution per exit size Share of number of exits to each region per exit size interval   440     IPO M&A value per geography 30%   4%   47%   19%   Inside  Country   Other  Nordic  Country   US   RoW   0%   20%   40%   60%   80%   100%   =<  10   10  -­‐  49   50  -­‐  99   100  -­‐  499   ≥  500   Copyright Creandum 2015
  • 15.
    Nordic VC allocationis required to capture the value of the region 15 •  Nordic VCs present in 85% of all VC-backed exits larger than $100M •  Nordic VC investors in 71.4% exits > $500M and 85.4% of exits > $100M (% of VC backed) •  Non-Nordic VCs are on average only represented in 15% Nordic exit deals – very difficult to access the value from outside the region Share of Nordic exits with VCs from Nordic, UK and Rest of Europe 2000 - 2014 0% 10% 20% 30% 40% 50% 60% 70% 80% 90% 100% >=10 >=50 >=100 Nordic VC US VC RoW VC RoE VC UK VC MUSD exit value Copyright Creandum 2015
  • 16.
    The Nordics createlarger share of unicorns, driven by early global expansion 16 Share of exits per interval >$100MUSD Percent of number of exits 0% 10% 20% 30% 40% 50% 60% 70% 80% $100-499 $500-999 >=$1,000 Global Nordics •  Since Nordic is a small market regarding customers the companies are forced to be global form an early stage in order to grow •  This drives a different distribution of unicorns vs other exits compared to global average 0% 10% 20% 30% 40% 50% 60% 70% 80% $100 - 499 $500-999 $>=1,000 Note: Global exits for 2014. Nordic exits for since 2010 Copyright Creandum 2015
  • 17.
    Wrapping up 17 >  Largeand growing Nordic tech market •  $3.9Bn yearly exit value last 10 years •  A significant part of European and global exits •  Increased high-quality deal flow •  Software & consumer sectors dominant and Sweden most important geography >  Significantly maturing ecosystem •  More serial entrepreneurs •  Successful entrepreneurs becoming angel investors •  Experienced growth company management teams available •  Few but more experienced investors active in the region Copyright Creandum 2015