Downloaded 103 times

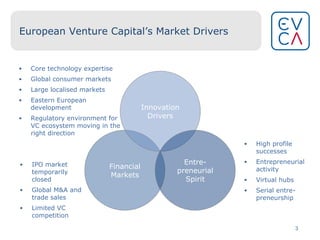
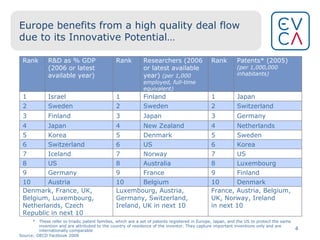
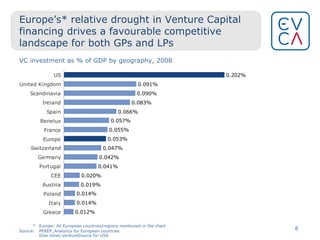
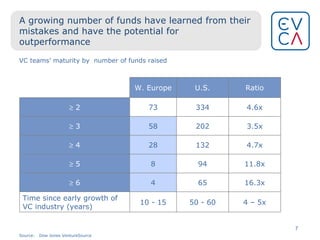
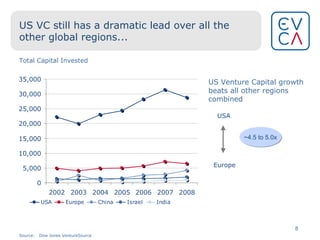
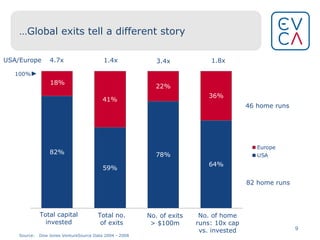
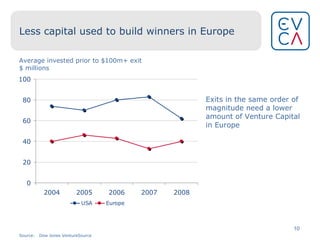
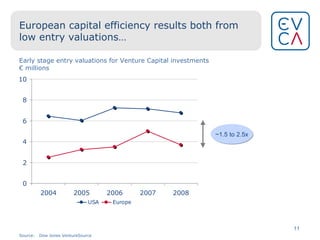
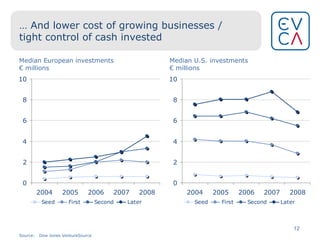
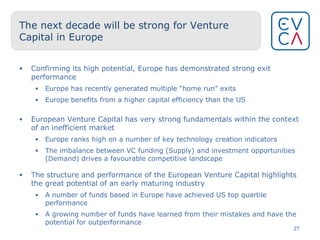

The document discusses the growth and potential of European venture capital, highlighting its competitive advantages such as lower entry valuations and improved capital efficiency compared to the US. It outlines the strong performance of European VC funds, an increase in high-value exits, and the maturing landscape of the entrepreneurial ecosystem. It concludes that despite market challenges, European venture capital is positioned for significant growth in the coming decade, supported by strong fundamentals in technology innovation.


![P Pt Invest France [Compatibility Mode]](https://cdn.slidesharecdn.com/ss_thumbnails/pptinvestfrancecompatibilitymode-1251123751307-phpapp02-thumbnail.jpg?width=640&height=640&fit=bounds)