Net Energy Generation by Source 2006 to June 2016
•
0 likes•30 views

The transition from coal to natural gas and renewables for electricity production continues.

Recommended
More Related Content
What's hot
What's hot (20)
Similar to Net Energy Generation by Source 2006 to June 2016
Similar to Net Energy Generation by Source 2006 to June 2016 (20)
More from Bruce LaCour
More from Bruce LaCour (20)
Recently uploaded
Recently uploaded (20)
Net Energy Generation by Source 2006 to June 2016
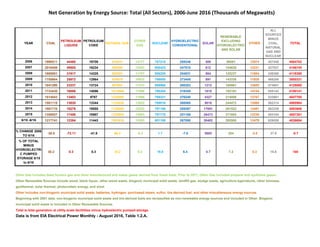
- 1. Net Generation by Energy Source: Total (All Sectors), 2006-June 2016 (Thousands of Megawatts) YEAR COAL PETROLEUM LIQUIDS PETROLEUM COKE NATURAL GAS OTHER GAS NUCLEAR HYDROELECTRIC CONVENTIONAL SOLAR RENEWABLE EXCLUDING HYDROELECTRIC AND SOLAR OTHER ALL SOURCES MINUS COAL, NATURAL GAS AND NUCLEAR TOTAL 2006 1990511 44460 19706 816441 14177 787219 289246 508 96081 12974 457446 4064702 2007 2016456 49505 16234 896590 13453 806425 247510 612 104626 12231 427937 4156745 2008 1985801 31917 14325 882981 11707 806208 254831 864 125237 11804 436360 4119388 2009 1755904 25972 12964 920979 10632 798855 273445 891 143338 11928 466206 3950331 2010 1847290 23337 13724 987697 11313 806968 260203 1212 165961 12855 474881 4125060 2011 1733430 16086 14096 1013689 11566 790204 319355 1818 192163 14154 555142 4100141 2012 1514043 13403 9787 1225895 11898 769331 276240 4327 214006 13787 533661 4047765 2013 1581115 13820 13344 1124836 12853 789016 268565 9016 244472 13588 562314 4065964 2014 1581710 18276 19555 1126609 12022 797166 259367 17691 261522 13461 582339 4093606 2015 1356057 17456 10987 1335608 12963 797178 251168 26473 271885 13239 593184 4087381 6/15 -6/16 1217741 12384 11443 1381816 13303 801188 267090 30402 292900 13479 629558 4036694 % CHANGE 2006 TO 6/16 -38.8 -72.11 -41.9 69.3 -6.2 1.7 -7.6 5885 204 -3.8 37.6 -0.7 % OF TOTAL MINUS HYDROELECTRI C PUMPED STORAGE 6/15 to 6/16 30.2 0.3 0.3 34.2 0.3 19.8 6.4 0.7 7.2 0.3 15.6 100 Data is from EIA Electrical Power Monthly - August 2016, Table 1.2.A. Other Gas includes blast furnace gas and other manufactured and waste gases derived from fossil fuels. Prior to 2011, Other Gas included propane and synthesis gases. Other Renewable Sources include wood, black liquor, other wood waste, biogenic municipal solid waste, landfill gas, sludge waste, agriculture byproducts, other biomass, geothermal, solar thermal, photovoltaic energy, and wind. Other includes non-biogenic municipal solid waste, batteries, hydrogen, purchased steam, sulfur, tire-derived fuel, and other miscellaneous energy sources. Beginning with 2001 data, non-biogenic municipal solid waste and tire-derived fuels are reclassified as non-renewable energy sources and included in Other. Biogenic municipal solid waste is included in Other Renewable Sources. Total is total generation at utility scale facililities minus hydroelectric pumped storage.
- 2. Net Generation by Energy Source: Total (All Sectors), 2006-June 2016 (Thousands of Megawatts) NATURAL GAS AND OTHER SOURCE CONSUMPTION (MAINLY WIND AND SOLAR) WILL CONTINUE TO INCREASE AS COAL CONSUMPTION DECLINES RAPIDLY. EXPECT COAL AS THE SOURCE FOR ELECTRICITY PRODUCTION TO DECREASE TO LESS THAN 25% OF TOTAL WITHIN 10 YEARS. SOME STATES WILL INCREASE RENEWABLES CONSUMPTION MORE THAN OTHERS. SOME STATES WILL RELY MAINLY ON NATURAL GAS TO THE BITTER END. 0 500000 1000000 1500000 2000000 2500000 3000000 3500000 4000000 4500000 2006 2007 2008 2009 2010 2011 2012 2013 2014 2015 6/15 -6/16 Thousands of Megawatts of Net Electricity Generated at Utility Scale Facilities Coal Natural Gas Nuclear Total Other Source Expect these two lines to get much closer next decade.