SlideShare a Scribd company logo
1 of 42
Download to read offline
FUTURE TRENDS – THE BABY BOOMER MIRAGE IS
FADING FAST
Page 1 of 42
The U.S. Baby Boomer mirage has been kept the importers of “stuff” into the United States with
positive trade deficits happy, as shown in the two tables below,. That is coming to an end. China,
Europe, Japan, and Mexico have benefitted greatly from Joe Sixpack and Mary Spend-a-Lots
propensity for foreign “stuff”. They like the Japanese and German automobiles. They also like
foreign electronics, among other things that Americans used to manufacture. Figure 28, “U.S.
Gross Public Debt”, shows what the global economy has done for Uncle Sammy - $20 Trillion
and rising fast. Of course, many are just as bad or in worst shape than Uncle Sammy, but the
American “Elites” bought into the liberal socialist agenda of a “New World Order” with the ultimate
goal of lowering Americans citizens to the worldwide lowest common denominator.
Imports/ Exports/ Trade Deficits of the United States in 2014 ($Millions)
Country Exports Imports Trade Deficit
China 123,676 446,754 343,078
European Union 276,142 418,754 142,059
Germany 49,363 123,260 73,897
Japan 66,827 134,004 67,117
Mexico 240,249 294,074 53,825
Canada 312,421 347,798 35,377
Saudi Arabia 18,705 47,041 28,336
Ireland 7,806 33,956 26,150
Italy 16,968 42,115 25,147
South Korea 44,471 69,518 25,047
India 21,608 45,244 23,636
Malaysia 13,068 30,420 17,352
France 31,301 46,874 15,573
Thailand 11,810 27,123 15,313
Taiwan 26,670 40,581 13,911
Switzerland 22,176 31,191 9,015
Israel 15,083 22,962 7,879
United Kingdom 53,823 54,392 569
FUTURE TRENDS – THE BABY BOOMER MIRAGE IS
FADING FAST
Page 2 of 42
U.S. Balance of Trade in 2015 ($Billions)
Product Imports Exports
Difference
+/-
Electronic equipment $332.9 $169.8 -$163.1
Machines, engines, pumps $329.3 $205.8 -$123.5
Vehicles $283.8 $127.1 -$146.7
Fuel $201.2 $106.1 -$95.1
Pharmaceuticals $86.1 $47.3 -$38.8
Medical, technical equipment $78.3 $83.4 +$5.1
Furniture, lighting, signs $61.2 $11.5 -$49.7
Gems, precious metals $60.2 $58.7 -$1.5
Organic chemicals $52.1 $38.8 -$13.3
Plastics $50.2 $60.3 +$10.1
Aircraft/Spacecraft $35.3 $131.1 +$95.8
Total of all trade $2.309 Trillion $1.51 Trillion -$799
FUTURE TRENDS – THE BABY BOOMER MIRAGE IS
FADING FAST
Page 3 of 42
The main thing the U.S. “working class” lost sight of as they got on the liberal bandwagon for the
global economy and elected U.S. Presidents who accommodated the agenda is that their higher
paying manufacturing jobs were disappearing right and left. What was “filling in the income gaps”
was a combination of low paying service jobs in combination with the welfare state and the
promise of Federal cradle to grave care of the masses in exchange for freedom.
Obama promised change. Figure 29, “U.S. Labor Participation Rate”, and Figure 28, U.S. Gross
Public Debt”, show the kind of change that results from his promises, and more “after taste” is still
on the way. How you like it Joe and Mary? Well the “Last of Mohicans” didn’t like it. The
arithmetic majority of demoralized dependents still want it. However, now we have a
businessman for President, and not a paid-for politician/rainmaker. The businessman knows that
manufacturing is what built the post-world war II dominance.
If Uncle Sammy is to achieve any semblance of future greatness, manufacturing is what must
return to Suburbialand. Nevertheless, the damage caused by the last President and his inept
Congress is irreparable. Trump will try to repair the damage and just the effort, even if he doesn’t
bring America back to Post WII glory, may save what’s worth saving – freedom to succeed or fail
without the divine right of the King hanging over you. The divine right of the bureaucracy is just as
bad. Freedom and the possibilities (not the guarantees) it brings was the American dream since
post Declaration of Independence, and it was the American way until FDR decided to save the
poor working class. Thereafter, the slow buildup of the welfare state began and so did the
increasing dependent class.
Post WWII Uncle Sammy could afford a little socialism. Heck, we didn’t have any competition.
Figure 32, “U.S. Car Production” and Figure 33, “U.S. Steel Production” shows what happens
when you retire early from the world rat race. Manufacturing jobs started disappearing in the early
1980s. The post WWII buildup transformed into the “Baby Boomer Mirage”. Figure 22, “U.S.
Manufacturing Employees”, clearly shows the transition. The Vietnam War put a tear in Uncle
Sammy’s iron coat. The Arabs new found oil power in the 1970s put another tear in his coat.
Finally, it was “the computer age” care of Bill Gates and his growing “silicon valley” bunch that
became the new economic engine of America – with the help of McDonald’s and Wal-Mart. This
engine only drove the “siliconers” and the Waltons to extraordinary wealth. It didn’t help the
Middle Class.
The new services economy doesn’t work that well, does it Joe and Mary? The way it has worked
since 1979 is the illusion of middle class wealth that was real Post War II was kept alive by
increasing amounts of debt. You see, it was no longer about production; it was about
consumption. It was no longer about saving, it was about spending. And the Gates, and Buffets,
and Waltons took advantage of this trend. It’s the American way, why not?
Foreign countries with their Post WWII rebuilt economies were more than willing to keep Joe and
Mary spending money they didn’t have. Buy it on sale and finance it. We’ll loan you, just keep
FUTURE TRENDS – THE BABY BOOMER MIRAGE IS
FADING FAST
Page 4 of 42
buying. Figure 23, “Gross Federal Debt as Percentage of Gross Domestic Product”, shows that is
exactly what happened. It started in 1979 with the oldest Baby Boomers 36 and the youngest 19
(The Fourth Turning definition of Baby Boomers 1943-1960). That’s about where you Millennials
(1982-2002) are right now.
First it was automobiles and then it was houses that became the Baby Boomer “soup-du-jour”.
Figure 7, “Three-Month Treasury Bill”; Figure 8, “Bank Prime Loan Rate”; Figure 9, “Four-Year
Auto Loan rate”; and Figure 10, “30-Year Mortgage Rate”, show the interest rates were kept low
and lower to keep Joe and Mary indulged and in debt. If it was new, it was part of the Boomer
lifestyle. If it was a few years old, it was thrown in the landfill. In the meantime, Uncle Sammy had
wars to fight. Also, we made all these promises so we needed more bureaucrats. You all have a
good time now while we solve all these problems for you! That’s all you have to say if you are a
politician.
By 2000, the game was over, but George W. was a fun loving Boomer growing up and he learned
from his Dad that secrecy and manipulation were the name of the game. He had a former gold-
bug turned Keynesian by marriage, Alan Greenspan, to keep the mirage in focus, at least until he
was out of the house. So it bubble blowing time. The first bubble, the “housing bubble”, was a
result of the X-Generation trying to duplicate the Baby Boomer Mirage. Too many bad loans and
not enough collateral, X-Generation, so try something else. Figure 34, “U.S. Home Ownership
Rate” shows that bubble burst, and the home ownership rate will continue to decline.
How about oil and gas? By 2006, we were running low on both. The first bubble almost did Uncle
Sammy in. But the powers that be said it was all solved, and now it is time for change, Obama
style. The change was going to complete the transformation to a socialist state. It almost worked.
The catalyst for change and even more mummification of Joe and Mary’s brains was the shale oil
and gas craze. This certainly keeps the Wall Street bunch happy and overpaid. It also keeps the
DOE bureaucracy employed by spinning yarns of a new age.
The catalyst, of course, was even more money and even lower interest rates, almost zero. But
we are going to raise them as the economy heals! Another key was to get an even bigger bunch
of clowns in the Federal Reserve. Figure 1, “M1 Money Supply” and Figure 3, “M2 Money
Supply”, show the attempt to revive the junkie with the last injection of monetary heroin; and
Figure 2, “M1 Velocity of Money”, and Figure 4, “M2 Velocity of Money”, show the result.
From Federal Reserve Bank of St. Louis website:
Money Velocity
The velocity of money is the frequency at which one unit of currency is used to purchase
domestically- produced goods and services within a given time period. In other words, it is the
number of times one dollar is spent to buy goods and services per unit of time. If the velocity of
money is increasing, then more transactions are occurring between individuals in an economy.
FUTURE TRENDS – THE BABY BOOMER MIRAGE IS
FADING FAST
Page 5 of 42
The frequency of currency exchange can be used to determine the velocity of a given component
of the money supply, providing some insight into whether consumers and businesses are saving
or spending their money. There are several components of the money supply: M1, M2, and MZM
(M3 is no longer tracked by the Federal Reserve); these components are arranged on a spectrum
of narrowest to broadest. Consider M1, the narrowest component. M1 is the money supply of
currency in circulation (notes and coins, traveler’s checks [non-bank issuers], demand deposits,
and checkable deposits). A decreasing velocity of M1 might indicate fewer short- term
consumption transactions are taking place. We can think of shorter- term transactions as
consumption we might make on an everyday basis.
The broader M2 component includes M1 in addition to saving deposits, certificates of deposit
(less than $100,000), and money market deposits for individuals. Comparing the velocities of M1
and M2 provides some insight into how quickly the economy is spending and how quickly it is
saving.
MZM (money with zero maturity) is the broadest component and consists of the supply of
financial assets redeemable at par on demand: notes and coins in circulation, traveler’s checks
(non-bank issuers), demand deposits, other checkable deposits, savings deposits, and all money
market funds. The velocity of MZM helps determine how often financial assets are switching
hands within the economy.
You can lead a horse to water, but you can’t make him drink, except for the Oil and Gas
wildcatter. They’ll drink anything you give them as long as you let them drill, drill, drill! However,
don’t expect to get your initial investment back.
The MZM velocity of money, which is the broadest money supply component, shows it was all
over for Uncle Sammy a long time ago. See Figure 6, “MZM Velocity of Money”, which shows the
Post WWII engine stalled a long time ago. This Baby Boomer Mirage ran on pure debt thereafter.
The latest bubble is about go “boom”, not “pop”. This boom will be heard around the world, and it
will end the “Age of Growth” once and for all. Trump is at least going to get the U.S. prepared for
the transition from the “Age of Growth” to the “Age of Survival”, even though he and his followers
think the U.S. will return to glory days.
A look at the serious nature of this latest bubble is in order to understand the possible aftermath.
The gas for blowing up the bubble was provided by more debt, a lot more debt and low interest
for that debt. It’s the Baby Boomers going away present for future generations.
Figure 13, “U.S. Public Debt”, shows the increase since 2008. Figure 14, “Gross Domestic
Product”, increased, but not like in the past. What did increase bigtime was debt as a percentage
of GDP. Figure 16, “Federal Debt Held By Federal Reserve Banks As A Percentage Of Gross
Domestic Product; Figure 18, “Federal Debt Held By The Public As A Percentage Of Gross
Domestic Product”; Figure 20, “Federal Debt Held By Foreign And International Investors As A
FUTURE TRENDS – THE BABY BOOMER MIRAGE IS
FADING FAST
Page 6 of 42
Percentage Of Gross Domestic Product”, show that all the large holders of debt increased their
share of the U.S. economy. Figure 21 shows that the Federal Reserve has blown the last bubble.
When it blows up, the shale oil-gas industry goes with it.
Figure 30, “U.S. Employed Persons”, shows the period 2008 to 2016 increased employment, but
Figure 31, “U.S” Manufacturing Payrolls” shows manufacturing jobs were about the same as
2007. The jobs created were low paying, part-time service jobs, if you even believe the
unemployment data. That’s not what “Made America Great” during the Post WWII period.
Figure 11, “Wilshire 5000 Index”. Shows what else is going down the drain. Whether it is the
DOW, Nasdaq, S&P500, or the more inclusive Wilshire 5000, they are all way over valued. When
they go, the money that is driving this oil-gas craze goes also. Then “Making America Great
Again” is going to have to take on a more realistic tone.
However, Trump needs to continue the following to “Save America”:
• Significantly reduce the bureaucracy. (20% reduction is not enough.)
• Leave the United Nations (This organization is nothing but another Uncle Sam money
drain and a platform for Globalists)
• Start chipping away at the welfare system (We can’t afford it. Domestic jobs must be
created concurrently.)
• Raise the retirement age. (Even the old people who can walk and talk will have to work.)
• Reestablish a real border against illegal immigration. (People will need to work again at
whatever is available.)
• Demolish business inhibiting legislation. (If ever innovation was needed, it will be after the
crisis begins.)
• Stop subsidizing losers. (It will survive if it is the lowest cost alternative.)
• Open up exploration of oil and gas (But don’t subsidize it any way. Increased price will
reduce demand naturally.)
• Lower taxes across the board. (That coordinates with demolishing the bureaucracy.)
• Renegotiate the debt with foreign holders. (If not, than default on the debt. The future is
going to be about a lower standard of living for Joe and Mary anyway.)
The U.S. is going to have to be self-sufficient in the future. Whatever is still the U.S. will have to
produce what it consumes, and no more than that. I have said the following in one of my posts
before the election:
At least Trump tells the partial truth. We can't save Europe, we can't save Japan, we can't save
South Korea, and we shouldn't even try to save Saudi Arabia. We will be lucky to save
ourselves.
To save ourselves, we need to start manufacturing our own “stuff”. Five countries benefit from
our “conspicuous consumption” habit. From “Countries That Purchase the Most U.S. Imports”
by Karen Waksman, Updated September 08, 2016:
FUTURE TRENDS – THE BABY BOOMER MIRAGE IS
FADING FAST
Page 7 of 42
Top 5 Countries That Import U.S. Products
The following is a list of the top 5 countries importing U.S. products and services on an annual
basis. According to the most recent data available from the U.S. Census Bureau and other U.S.
government sources, the following countries make the largest amount of purchases. Considering
the geography, no one should be shocked that Canada is the number one importer of U.S.
goods. However, the vast array of the types of products being shipped to these countries does
surprise many of those not familiar with US foreign trade trends.
1. Canada
Even with the global automotive industry in decline, the top U.S. product imported by Canada is
usually automotive-related, including accessories and parts.
Machinery and electronic equipment usually come next, while oil and plastics, medical and
technical equipment and air crafts follow after. In 2015, Canada imported $280 billion dollars’
worth of US goods. That amount is equivalent to 18.6% of the United States' overall exports.
2. Mexico
With all the media attention U.S. trade with China receives, it may come as a surprise that
Mexico still imports more U.S. goods and services than the far more populous country of China.
In 2015, Mexico imported $236.4 billion worth of US goods, the most being in machinery,
electronic equipment, and like Canada, automotive-related goods.
3. China
China comes a distant third in importing of US goods compared to Canada and Mexico. China’s
number one import is usually air crafts and computer accessories, parts, and peripherals. Part of
this is related to the computer assembly industry, but also includes sales to Chinese retailers and
end-users. In 2015, the import of US products amounted to $116.2 billion or 7.7% of the United
States' overall exports.
4. Japan
Typically, the primary import of American goods to Japan is civilian aircraft(s). However, medical
and technical equipment also equal to about the same amount in the types of products exported
to Japan from the US. Machinery and electronic equipment follow suit, with $62.5 billion or 4.2%
of the US' overall exports in 2015.
5. United Kingdom
With the U.S. travel market facing tough times, the aviation industry turned to the international
market.
FUTURE TRENDS – THE BABY BOOMER MIRAGE IS
FADING FAST
Page 8 of 42
Like Japan, the U.K.’s primary import from “across the pond” was civilian aircraft. Following this
were chemicals and primary resources (such as metal for manufacturing), then electronic
equipment and then pharmaceuticals. In 2015, America's exports to the UK amounted to $56.4
billion or 3.8% of the United States' overall exports.
The only country we need to significantly trade with is Canada. Why? To put it bluntly, we need
their heavy oil to run the refineries as long as they last. Hopefully, Americans will wake up soon
and start decreasing their driving mileage and increasing their fuel economy. The only way to do
that is to eventually drive much smaller American made automobiles and trucks with a larger
contingent of electrics. However, electrics are not the answer to maintaining any semblance of
the past. Natural gas consumption will play an increasing role in electric power production so
expect the price of electricity to increase everywhere significantly and the availability to decrease.
What about China? Forget China. They have a bigger economic bubble than the U.S., and their
debt situation is far worse. They made an effort to become the new world power, but it’s too little,
too late for them. Figure 23, “West Texas Intermediate Crude Oil Price”, shows that the price of
oil has made two trips above the $100 mark. Both times caused severe slowdowns in the world
economic pace.
The last attempt at holding the crude oil price above $100, which lasted for a couple of years,
finally killed the China boom. Figure 26, “Global Price Index For All Commodities”, shows how the
price for all commodities followed the price of oil up twice and now down twice in the last 10
years. China’s building bust, as shown in Figure 27, “Global Price of Iron Ore”, has significantly
slowed the industrial buildup that China hopes will move the U.S. off the world monetary throne.
China has more severe problems than the U.S. The overbuilt infrastructure is unaffordable to the
populace. The state controlled economy is so loaded with debt that there is no way expansion
can continue for long. If the Chinese should in some way get their motor running again, it will be
once again killed by rising oil and gas prices and lower world demand for everything. Their
internal economy can’t keep their motor running.
Just stay out of China’s way because we are on the same planet. We need to concentrate on
solving our own problems and protecting our own borders, which will be a formidable, expensive
task. Once all these U.S. natural gas consumers come on line, the price of natural gas will be
headed back above the $10 per MMBtu mark that was exceeded twice in the last 11 years. See
Figure 24, “Henry Hub Natural Gas Price”.
The Age of Growth is ending and the Age of Survival is beginning. Adapt or die!
FUTURE TRENDS – THE BABY BOOMER MIRAGE IS
FADING FAST
Page 9 of 42
FIGURE 1
M1 MONEY SUPPLY
THE FATAL
INJECTION OF
MONETARY HEROIN
FUTURE TRENDS – THE BABY BOOMER MIRAGE IS
FADING FAST
Page 10 of 42
FIGURE 2
M1 VELOCITY OF MONEY
THE FATAL
INJECTION OF
MONETARY HEROIN
DIDN’T GIVE THE
JUNKIE A NEW
FUTURE TRENDS – THE BABY BOOMER MIRAGE IS
FADING FAST
Page 11 of 42
FIGURE 3
M2 MONEY SUPPLY
THE FATAL
INJECTION OF
MONETARY HEROIN
FUTURE TRENDS – THE BABY BOOMER MIRAGE IS
FADING FAST
Page 12 of 42
FIGURE 4
M2 VELOCITY OF MONEY
THE FATAL
INJECTION OF
MONETARY HEROIN
DIDN’T GIVE THE
JUNKIE A NEW HIGH
FUTURE TRENDS – THE BABY BOOMER MIRAGE IS
FADING FAST
Page 13 of 42
FIGURE 5
MZM MONEY SUPPLY
FUTURE TRENDS – THE BABY BOOMER MIRAGE IS
FADING FAST
Page 14 of 42
FIGURE 6
MZM VELOCITY OF MONEY
THE ENGINE
STALLED A LONG
TIME AGO
FUTURE TRENDS – THE BABY BOOMER MIRAGE IS
FADING FAST
Page 15 of 42
FIGURE 7
THREE-MONTH TREASURY BILL
THE FATAL
INJECTION OF
MONETARY HEROIN
Baby Boomer
Mirage
FUTURE TRENDS – THE BABY BOOMER MIRAGE IS
FADING FAST
Page 16 of 42
FIGURE 8
BANK PRIME LOAN RATE
FUTURE TRENDS – THE BABY BOOMER MIRAGE IS
FADING FAST
Page 17 of 42
FIGURE 9
4-YEAR AUTO LOAN RATE
FUTURE TRENDS – THE BABY BOOMER MIRAGE IS
FADING FAST
Page 18 of 42
FIGURE 10
30-YEAR FIXED RATE MORTGAGE
FUTURE TRENDS – THE BABY BOOMER MIRAGE IS
FADING FAST
Page 19 of 42
FIGURE 11
WILSHIRE 5000 INDEX
THE FATAL INJECTION OF
MONETARY HEROIN
DIDN’T GIVE THE JUNKIE A
NEW HIGH, BUT IT HELPED
THE WALL STREET WILD
BUNCH
FUTURE TRENDS – THE BABY BOOMER MIRAGE IS
FADING FAST
Page 20 of 42
FIGURE 12
TOTAL U.S. POPULATION
START PRACTICING
BIRTH CONTROL SOON,
AND YOU MIGHT MAKE IT
TO 2060
FUTURE TRENDS – THE BABY BOOMER MIRAGE IS
FADING FAST
Page 21 of 42
FIGURE 13
TOTAL PUBLIC DEBT
FUTURE TRENDS – THE BABY BOOMER MIRAGE IS
FADING FAST
Page 22 of 42
FIGURE 14
GROSS DOMESTIC PRODUCT
FUTURE TRENDS – THE BABY BOOMER MIRAGE IS
FADING FAST
Page 23 of 42
FIGURE 15
FEDERAL DEBT HELD BY FEDERAL RESERVE BANKS
FUTURE TRENDS – THE BABY BOOMER MIRAGE IS
FADING FAST
Page 24 of 42
FIGURE 16
FEDERAL DEBT HELD BY FEDERAL RESERVE BANKS AS A PERCENTAGE OF GROSS
DOMESTIC PRODUCT
FUTURE TRENDS – THE BABY BOOMER MIRAGE IS
FADING FAST
Page 25 of 42
FIGURE 17
FEDERAL DEBT HELD BY THE PUBLIC
FUTURE TRENDS – THE BABY BOOMER MIRAGE IS
FADING FAST
Page 26 of 42
FIGURE 18
FEDERAL DEBT HELD BY THE PUBLIC AS A PERCENTAGE OF GROSS DOMESTIC
PRODUCT
FUTURE TRENDS – THE BABY BOOMER MIRAGE IS
FADING FAST
Page 27 of 42
FIGURE 19
FEDERAL DEBT HELD BY FOREIGN AND INTERNATIONAL INVESTORS
FUTURE TRENDS – THE BABY BOOMER MIRAGE IS
FADING FAST
Page 28 of 42
FIGURE 20
FEDERAL DEBT HELD BY FOREIGN AND INTERNATIONAL INVESTORS AS A
PERCENTAGE OF GROSS DOMESTIC PRODUCT
FUTURE TRENDS – THE BABY BOOMER MIRAGE IS
FADING FAST
Page 29 of 42
FIGURE 21
GROSS FEDERAL DEBT AS PERCENTAGE OF GROSS DOMESTIC PRODUCT
(In 1979 Baby Boomers are age 36 to 19 Years Old)
Baby Boomer
Mirage
Post WWII
ERA
The
Last
Bubble
FUTURE TRENDS – THE BABY BOOMER MIRAGE IS
FADING FAST
Page 30 of 42
FIGURE 22
U.S. MANUFACTURING EMPLOYEES
(Bill Gates Starts Microsoft in 1975)
Baby Boomer
Mirage
Post WWII
ERA
FUTURE TRENDS – THE BABY BOOMER MIRAGE IS
FADING FAST
Page 31 of 42
FIGURE 23
WEST TEXAS INTERMEDIATE CRUDE OIL PRICE
(Two Trips Above $100 a Barrel Have Caused Economic Slowdowns)
World Economic
Destruction
Range
FUTURE TRENDS – THE BABY BOOMER MIRAGE IS
FADING FAST
Page 32 of 42
FIGURE 24
HENRY HUB NATURAL GAS PRICE
(Prior to the Shale Gas Craze, Price Made Two Trips Above $10 Per MMBtu)
U.S. Economy
Non-Performing
Range
FUTURE TRENDS – THE BABY BOOMER MIRAGE IS
FADING FAST
Page 33 of 42
FIGURE 25
U.S. AVERAGE REGULAR GASOLINE PRICE
FUTURE TRENDS – THE BABY BOOMER MIRAGE IS
FADING FAST
Page 34 of 42
FIGURE 26
GLOBAL PRICE INDEX FOR ALL COMMODITIES
FUTURE TRENDS – THE BABY BOOMER MIRAGE IS
FADING FAST
Page 35 of 42
FIGURE 27
GLOBAL PRICE OF IRON ORE
China
Boom
China
Bust
FUTURE TRENDS – THE BABY BOOMER MIRAGE IS
FADING FAST
Page 36 of 42
FIGURE 28
U.S. GROSS PUBLIC DEBT
MODEL OF HOW THE FEDERAL
RESERVE, NEO-CONS, CRONY
CAPITALISM, AND THE
WELFARE STATE CAN
COOPERATE
FUTURE TRENDS – THE BABY BOOMER MIRAGE IS
FADING FAST
Page 37 of 42
FIGURE 29
U.S. LABOR FORCE PARTICIPATION RATE
FUTURE TRENDS – THE BABY BOOMER MIRAGE IS
FADING FAST
Page 38 of 42
FIGURE 30
U.S. EMPLOYED PERSONS
FUTURE TRENDS – THE BABY BOOMER MIRAGE IS
FADING FAST
Page 39 of 42
FIGURE 31
U.S. MANUFACTURING PAYROLLS
FUTURE TRENDS – THE BABY BOOMER MIRAGE IS
FADING FAST
Page 40 of 42
FIGURE 32
U.S. CAR PRODUCTION
FUTURE TRENDS – THE BABY BOOMER MIRAGE IS
FADING FAST
Page 41 of 42
FIGURE 33
U.S. STEEL PRODUCTION
FUTURE TRENDS – THE BABY BOOMER MIRAGE IS
FADING FAST
Page 42 of 42
FIGURE 34
U.S. HOME OWNERSHIP RATE

More Related Content

What's hot

Genesis Of Global Financial Crises
Genesis Of Global Financial CrisesGenesis Of Global Financial Crises
Genesis Of Global Financial CrisesArif Anis Malik FRSA
 
BrandShelter - July 2011 Update
BrandShelter - July 2011 UpdateBrandShelter - July 2011 Update
BrandShelter - July 2011 UpdateLeo Burnett
 
The Great Depression Of 2008 And The Decline Of The Usa 3 10
The Great Depression Of 2008 And The Decline Of The Usa 3 10The Great Depression Of 2008 And The Decline Of The Usa 3 10
The Great Depression Of 2008 And The Decline Of The Usa 3 10Sharp Metropolitan Medical Campus
 
WE THE SHEEPLE VS. THE BANKSTERS
WE THE SHEEPLE VS. THE BANKSTERSWE THE SHEEPLE VS. THE BANKSTERS
WE THE SHEEPLE VS. THE BANKSTERSlauren tratar
 
Economics Masters Thesis
Economics Masters ThesisEconomics Masters Thesis
Economics Masters ThesisWilliam Compton
 
Presentation30
Presentation30Presentation30
Presentation30rbbrown
 
The Washington Post's Coverage of the Financial Crisis
The Washington Post's Coverage of the Financial CrisisThe Washington Post's Coverage of the Financial Crisis
The Washington Post's Coverage of the Financial Crisisagrand905
 
Presentation22
Presentation22Presentation22
Presentation22rbbrown
 
Ricardo V Lago Universityof Miami Business Forum 15 01 2009
Ricardo V Lago Universityof Miami  Business Forum  15 01 2009Ricardo V Lago Universityof Miami  Business Forum  15 01 2009
Ricardo V Lago Universityof Miami Business Forum 15 01 2009neiracar
 
We, the Sheeple V. the Banksters
We, the Sheeple V. the BankstersWe, the Sheeple V. the Banksters
We, the Sheeple V. the Banksterslauren tratar
 
RICS Americas Property World Fall 2009
RICS Americas Property World Fall 2009RICS Americas Property World Fall 2009
RICS Americas Property World Fall 2009RICS Americas
 

What's hot (18)

Fin crisis mggw2
Fin crisis mggw2Fin crisis mggw2
Fin crisis mggw2
 
Genesis Of Global Financial Crises
Genesis Of Global Financial CrisesGenesis Of Global Financial Crises
Genesis Of Global Financial Crises
 
BrandShelter - July 2011 Update
BrandShelter - July 2011 UpdateBrandShelter - July 2011 Update
BrandShelter - July 2011 Update
 
The Great Depression Of 2008 And The Decline Of The Usa 3 10
The Great Depression Of 2008 And The Decline Of The Usa 3 10The Great Depression Of 2008 And The Decline Of The Usa 3 10
The Great Depression Of 2008 And The Decline Of The Usa 3 10
 
WE THE SHEEPLE VS. THE BANKSTERS
WE THE SHEEPLE VS. THE BANKSTERSWE THE SHEEPLE VS. THE BANKSTERS
WE THE SHEEPLE VS. THE BANKSTERS
 
Recession
RecessionRecession
Recession
 
Economics Masters Thesis
Economics Masters ThesisEconomics Masters Thesis
Economics Masters Thesis
 
Presentation30
Presentation30Presentation30
Presentation30
 
WP3 LINKEDIN
WP3 LINKEDINWP3 LINKEDIN
WP3 LINKEDIN
 
The Washington Post's Coverage of the Financial Crisis
The Washington Post's Coverage of the Financial CrisisThe Washington Post's Coverage of the Financial Crisis
The Washington Post's Coverage of the Financial Crisis
 
Presentation22
Presentation22Presentation22
Presentation22
 
Wright report2 2012
Wright report2 2012Wright report2 2012
Wright report2 2012
 
Economics & politics rev
Economics & politics revEconomics & politics rev
Economics & politics rev
 
Ricardo V Lago Universityof Miami Business Forum 15 01 2009
Ricardo V Lago Universityof Miami  Business Forum  15 01 2009Ricardo V Lago Universityof Miami  Business Forum  15 01 2009
Ricardo V Lago Universityof Miami Business Forum 15 01 2009
 
Best American CEOs
Best American CEOsBest American CEOs
Best American CEOs
 
We, the Sheeple V. the Banksters
We, the Sheeple V. the BankstersWe, the Sheeple V. the Banksters
We, the Sheeple V. the Banksters
 
RICS Americas Property World Fall 2009
RICS Americas Property World Fall 2009RICS Americas Property World Fall 2009
RICS Americas Property World Fall 2009
 
Article 2
Article 2Article 2
Article 2
 

Similar to The Baby Boomer Mirage is Fading Fast

Bitcoin - Hard money you can't fuck with - Why bitcoin will be the next globa...
Bitcoin - Hard money you can't fuck with - Why bitcoin will be the next globa...Bitcoin - Hard money you can't fuck with - Why bitcoin will be the next globa...
Bitcoin - Hard money you can't fuck with - Why bitcoin will be the next globa...Beta Eve - Crypto Trader
 
The Great Depression was a major monetary droop in the 1930s. Numer.docx
The Great Depression was a major monetary droop in the 1930s. Numer.docxThe Great Depression was a major monetary droop in the 1930s. Numer.docx
The Great Depression was a major monetary droop in the 1930s. Numer.docxrtodd33
 
Causes Of The New Deal
Causes Of The New DealCauses Of The New Deal
Causes Of The New DealLisa Olive
 
Causes of the Great Depression
Causes of the Great DepressionCauses of the Great Depression
Causes of the Great Depressioni Classroom
 

Similar to The Baby Boomer Mirage is Fading Fast (8)

Causes Of The Great Depression Essay
Causes Of The Great Depression EssayCauses Of The Great Depression Essay
Causes Of The Great Depression Essay
 
Essay On Great Depression
Essay On Great DepressionEssay On Great Depression
Essay On Great Depression
 
Bitcoin - Hard money you can't fuck with - Why bitcoin will be the next globa...
Bitcoin - Hard money you can't fuck with - Why bitcoin will be the next globa...Bitcoin - Hard money you can't fuck with - Why bitcoin will be the next globa...
Bitcoin - Hard money you can't fuck with - Why bitcoin will be the next globa...
 
The Great Depression was a major monetary droop in the 1930s. Numer.docx
The Great Depression was a major monetary droop in the 1930s. Numer.docxThe Great Depression was a major monetary droop in the 1930s. Numer.docx
The Great Depression was a major monetary droop in the 1930s. Numer.docx
 
Causes Of The New Deal
Causes Of The New DealCauses Of The New Deal
Causes Of The New Deal
 
Causes of the Great Depression
Causes of the Great DepressionCauses of the Great Depression
Causes of the Great Depression
 
Chapter 17
Chapter 17Chapter 17
Chapter 17
 
Essay About Great Depression
Essay About Great DepressionEssay About Great Depression
Essay About Great Depression
 

More from Bruce LaCour

The Petrochemical Industry Can No Longer Guarantee Permanent Employment
The Petrochemical Industry Can No Longer Guarantee Permanent EmploymentThe Petrochemical Industry Can No Longer Guarantee Permanent Employment
The Petrochemical Industry Can No Longer Guarantee Permanent EmploymentBruce LaCour
 
Future Trends - Air Conditioning with Thermal Energy Storage - Commercial and...
Future Trends - Air Conditioning with Thermal Energy Storage - Commercial and...Future Trends - Air Conditioning with Thermal Energy Storage - Commercial and...
Future Trends - Air Conditioning with Thermal Energy Storage - Commercial and...Bruce LaCour
 
Future Trends - Recycling - Demolished Construction Materials
Future Trends  - Recycling - Demolished Construction MaterialsFuture Trends  - Recycling - Demolished Construction Materials
Future Trends - Recycling - Demolished Construction MaterialsBruce LaCour
 
Future Trends - Recycling - Electrical Wire
Future Trends - Recycling - Electrical WireFuture Trends - Recycling - Electrical Wire
Future Trends - Recycling - Electrical WireBruce LaCour
 
Future Trends - Recycling - Glass
Future Trends - Recycling - GlassFuture Trends - Recycling - Glass
Future Trends - Recycling - GlassBruce LaCour
 
Future Trends - Recycling - Batteries
Future Trends - Recycling - BatteriesFuture Trends - Recycling - Batteries
Future Trends - Recycling - BatteriesBruce LaCour
 
Future Trends - Recycling - Electronics
Future Trends - Recycling - ElectronicsFuture Trends - Recycling - Electronics
Future Trends - Recycling - ElectronicsBruce LaCour
 
Future Trends - Recycling - Metals - Part III
Future Trends - Recycling - Metals - Part IIIFuture Trends - Recycling - Metals - Part III
Future Trends - Recycling - Metals - Part IIIBruce LaCour
 
Future Trends - Recycling - Metals - Part II
Future Trends -  Recycling - Metals - Part IIFuture Trends -  Recycling - Metals - Part II
Future Trends - Recycling - Metals - Part IIBruce LaCour
 
Future Trends - Recycling - Metals - Part I
Future Trends -  Recycling - Metals - Part IFuture Trends -  Recycling - Metals - Part I
Future Trends - Recycling - Metals - Part IBruce LaCour
 
Future Trends - Recycling - Vehicles and Tires
Future Trends -  Recycling - Vehicles and TiresFuture Trends -  Recycling - Vehicles and Tires
Future Trends - Recycling - Vehicles and TiresBruce LaCour
 
Future Trends - Recycling - Material Recycling Facilities
Future Trends -  Recycling - Material Recycling FacilitiesFuture Trends -  Recycling - Material Recycling Facilities
Future Trends - Recycling - Material Recycling FacilitiesBruce LaCour
 
Future Trends - Recycling - Waste oils
Future Trends  -  Recycling - Waste oilsFuture Trends  -  Recycling - Waste oils
Future Trends - Recycling - Waste oilsBruce LaCour
 
Future Trends - Recycling - Refrigerants
Future Trends -  Recycling - RefrigerantsFuture Trends -  Recycling - Refrigerants
Future Trends - Recycling - RefrigerantsBruce LaCour
 
Future Trends - Zero Waste
Future Trends -  Zero WasteFuture Trends -  Zero Waste
Future Trends - Zero WasteBruce LaCour
 
US Petrochemical Industry Future - Integrating Design Operation and Maintenance
US Petrochemical Industry Future -  Integrating Design Operation and MaintenanceUS Petrochemical Industry Future -  Integrating Design Operation and Maintenance
US Petrochemical Industry Future - Integrating Design Operation and MaintenanceBruce LaCour
 
US Petrochemical Industry Future - Flexible Labor
US Petrochemical Industry Future -  Flexible LaborUS Petrochemical Industry Future -  Flexible Labor
US Petrochemical Industry Future - Flexible LaborBruce LaCour
 
US Petrochemical Industry Future - Downstream
US Petrochemical Industry Future -  DownstreamUS Petrochemical Industry Future -  Downstream
US Petrochemical Industry Future - DownstreamBruce LaCour
 
US Petrochemical Industry Future - Upstream - Natural Gas - Logic Versus Fait...
US Petrochemical Industry Future - Upstream - Natural Gas - Logic Versus Fait...US Petrochemical Industry Future - Upstream - Natural Gas - Logic Versus Fait...
US Petrochemical Industry Future - Upstream - Natural Gas - Logic Versus Fait...Bruce LaCour
 
US Petrochemical Industry Future - Upstream - Natural Gas - Logic Verus Fait...
US Petrochemical Industry Future -  Upstream - Natural Gas - Logic Verus Fait...US Petrochemical Industry Future -  Upstream - Natural Gas - Logic Verus Fait...
US Petrochemical Industry Future - Upstream - Natural Gas - Logic Verus Fait...Bruce LaCour
 

More from Bruce LaCour (20)

The Petrochemical Industry Can No Longer Guarantee Permanent Employment
The Petrochemical Industry Can No Longer Guarantee Permanent EmploymentThe Petrochemical Industry Can No Longer Guarantee Permanent Employment
The Petrochemical Industry Can No Longer Guarantee Permanent Employment
 
Future Trends - Air Conditioning with Thermal Energy Storage - Commercial and...
Future Trends - Air Conditioning with Thermal Energy Storage - Commercial and...Future Trends - Air Conditioning with Thermal Energy Storage - Commercial and...
Future Trends - Air Conditioning with Thermal Energy Storage - Commercial and...
 
Future Trends - Recycling - Demolished Construction Materials
Future Trends  - Recycling - Demolished Construction MaterialsFuture Trends  - Recycling - Demolished Construction Materials
Future Trends - Recycling - Demolished Construction Materials
 
Future Trends - Recycling - Electrical Wire
Future Trends - Recycling - Electrical WireFuture Trends - Recycling - Electrical Wire
Future Trends - Recycling - Electrical Wire
 
Future Trends - Recycling - Glass
Future Trends - Recycling - GlassFuture Trends - Recycling - Glass
Future Trends - Recycling - Glass
 
Future Trends - Recycling - Batteries
Future Trends - Recycling - BatteriesFuture Trends - Recycling - Batteries
Future Trends - Recycling - Batteries
 
Future Trends - Recycling - Electronics
Future Trends - Recycling - ElectronicsFuture Trends - Recycling - Electronics
Future Trends - Recycling - Electronics
 
Future Trends - Recycling - Metals - Part III
Future Trends - Recycling - Metals - Part IIIFuture Trends - Recycling - Metals - Part III
Future Trends - Recycling - Metals - Part III
 
Future Trends - Recycling - Metals - Part II
Future Trends -  Recycling - Metals - Part IIFuture Trends -  Recycling - Metals - Part II
Future Trends - Recycling - Metals - Part II
 
Future Trends - Recycling - Metals - Part I
Future Trends -  Recycling - Metals - Part IFuture Trends -  Recycling - Metals - Part I
Future Trends - Recycling - Metals - Part I
 
Future Trends - Recycling - Vehicles and Tires
Future Trends -  Recycling - Vehicles and TiresFuture Trends -  Recycling - Vehicles and Tires
Future Trends - Recycling - Vehicles and Tires
 
Future Trends - Recycling - Material Recycling Facilities
Future Trends -  Recycling - Material Recycling FacilitiesFuture Trends -  Recycling - Material Recycling Facilities
Future Trends - Recycling - Material Recycling Facilities
 
Future Trends - Recycling - Waste oils
Future Trends  -  Recycling - Waste oilsFuture Trends  -  Recycling - Waste oils
Future Trends - Recycling - Waste oils
 
Future Trends - Recycling - Refrigerants
Future Trends -  Recycling - RefrigerantsFuture Trends -  Recycling - Refrigerants
Future Trends - Recycling - Refrigerants
 
Future Trends - Zero Waste
Future Trends -  Zero WasteFuture Trends -  Zero Waste
Future Trends - Zero Waste
 
US Petrochemical Industry Future - Integrating Design Operation and Maintenance
US Petrochemical Industry Future -  Integrating Design Operation and MaintenanceUS Petrochemical Industry Future -  Integrating Design Operation and Maintenance
US Petrochemical Industry Future - Integrating Design Operation and Maintenance
 
US Petrochemical Industry Future - Flexible Labor
US Petrochemical Industry Future -  Flexible LaborUS Petrochemical Industry Future -  Flexible Labor
US Petrochemical Industry Future - Flexible Labor
 
US Petrochemical Industry Future - Downstream
US Petrochemical Industry Future -  DownstreamUS Petrochemical Industry Future -  Downstream
US Petrochemical Industry Future - Downstream
 
US Petrochemical Industry Future - Upstream - Natural Gas - Logic Versus Fait...
US Petrochemical Industry Future - Upstream - Natural Gas - Logic Versus Fait...US Petrochemical Industry Future - Upstream - Natural Gas - Logic Versus Fait...
US Petrochemical Industry Future - Upstream - Natural Gas - Logic Versus Fait...
 
US Petrochemical Industry Future - Upstream - Natural Gas - Logic Verus Fait...
US Petrochemical Industry Future -  Upstream - Natural Gas - Logic Verus Fait...US Petrochemical Industry Future -  Upstream - Natural Gas - Logic Verus Fait...
US Petrochemical Industry Future - Upstream - Natural Gas - Logic Verus Fait...
 

Recently uploaded

8447779800, Low rate Call girls in New Ashok Nagar Delhi NCR
8447779800, Low rate Call girls in New Ashok Nagar Delhi NCR8447779800, Low rate Call girls in New Ashok Nagar Delhi NCR
8447779800, Low rate Call girls in New Ashok Nagar Delhi NCRashishs7044
 
Future Of Sample Report 2024 | Redacted Version
Future Of Sample Report 2024 | Redacted VersionFuture Of Sample Report 2024 | Redacted Version
Future Of Sample Report 2024 | Redacted VersionMintel Group
 
Contemporary Economic Issues Facing the Filipino Entrepreneur (1).pptx
Contemporary Economic Issues Facing the Filipino Entrepreneur (1).pptxContemporary Economic Issues Facing the Filipino Entrepreneur (1).pptx
Contemporary Economic Issues Facing the Filipino Entrepreneur (1).pptxMarkAnthonyAurellano
 
8447779800, Low rate Call girls in Shivaji Enclave Delhi NCR
8447779800, Low rate Call girls in Shivaji Enclave Delhi NCR8447779800, Low rate Call girls in Shivaji Enclave Delhi NCR
8447779800, Low rate Call girls in Shivaji Enclave Delhi NCRashishs7044
 
The CMO Survey - Highlights and Insights Report - Spring 2024
The CMO Survey - Highlights and Insights Report - Spring 2024The CMO Survey - Highlights and Insights Report - Spring 2024
The CMO Survey - Highlights and Insights Report - Spring 2024christinemoorman
 
Marketplace and Quality Assurance Presentation - Vincent Chirchir
Marketplace and Quality Assurance Presentation - Vincent ChirchirMarketplace and Quality Assurance Presentation - Vincent Chirchir
Marketplace and Quality Assurance Presentation - Vincent Chirchirictsugar
 
Ten Organizational Design Models to align structure and operations to busines...
Ten Organizational Design Models to align structure and operations to busines...Ten Organizational Design Models to align structure and operations to busines...
Ten Organizational Design Models to align structure and operations to busines...Seta Wicaksana
 
8447779800, Low rate Call girls in Tughlakabad Delhi NCR
8447779800, Low rate Call girls in Tughlakabad Delhi NCR8447779800, Low rate Call girls in Tughlakabad Delhi NCR
8447779800, Low rate Call girls in Tughlakabad Delhi NCRashishs7044
 
Lowrate Call Girls In Sector 18 Noida ❤️8860477959 Escorts 100% Genuine Servi...
Lowrate Call Girls In Sector 18 Noida ❤️8860477959 Escorts 100% Genuine Servi...Lowrate Call Girls In Sector 18 Noida ❤️8860477959 Escorts 100% Genuine Servi...
Lowrate Call Girls In Sector 18 Noida ❤️8860477959 Escorts 100% Genuine Servi...lizamodels9
 
Intro to BCG's Carbon Emissions Benchmark_vF.pdf
Intro to BCG's Carbon Emissions Benchmark_vF.pdfIntro to BCG's Carbon Emissions Benchmark_vF.pdf
Intro to BCG's Carbon Emissions Benchmark_vF.pdfpollardmorgan
 
Buy gmail accounts.pdf Buy Old Gmail Accounts
Buy gmail accounts.pdf Buy Old Gmail AccountsBuy gmail accounts.pdf Buy Old Gmail Accounts
Buy gmail accounts.pdf Buy Old Gmail AccountsBuy Verified Accounts
 
/:Call Girls In Indirapuram Ghaziabad ➥9990211544 Independent Best Escorts In...
/:Call Girls In Indirapuram Ghaziabad ➥9990211544 Independent Best Escorts In.../:Call Girls In Indirapuram Ghaziabad ➥9990211544 Independent Best Escorts In...
/:Call Girls In Indirapuram Ghaziabad ➥9990211544 Independent Best Escorts In...lizamodels9
 
Market Sizes Sample Report - 2024 Edition
Market Sizes Sample Report - 2024 EditionMarket Sizes Sample Report - 2024 Edition
Market Sizes Sample Report - 2024 EditionMintel Group
 
Digital Transformation in the PLM domain - distrib.pdf
Digital Transformation in the PLM domain - distrib.pdfDigital Transformation in the PLM domain - distrib.pdf
Digital Transformation in the PLM domain - distrib.pdfJos Voskuil
 
Call Girls In Connaught Place Delhi ❤️88604**77959_Russian 100% Genuine Escor...
Call Girls In Connaught Place Delhi ❤️88604**77959_Russian 100% Genuine Escor...Call Girls In Connaught Place Delhi ❤️88604**77959_Russian 100% Genuine Escor...
Call Girls In Connaught Place Delhi ❤️88604**77959_Russian 100% Genuine Escor...lizamodels9
 
Call Girls in DELHI Cantt, ( Call Me )-8377877756-Female Escort- In Delhi / Ncr
Call Girls in DELHI Cantt, ( Call Me )-8377877756-Female Escort- In Delhi / NcrCall Girls in DELHI Cantt, ( Call Me )-8377877756-Female Escort- In Delhi / Ncr
Call Girls in DELHI Cantt, ( Call Me )-8377877756-Female Escort- In Delhi / Ncrdollysharma2066
 
FULL ENJOY Call girls in Paharganj Delhi | 8377087607
FULL ENJOY Call girls in Paharganj Delhi | 8377087607FULL ENJOY Call girls in Paharganj Delhi | 8377087607
FULL ENJOY Call girls in Paharganj Delhi | 8377087607dollysharma2066
 
Kenya’s Coconut Value Chain by Gatsby Africa
Kenya’s Coconut Value Chain by Gatsby AfricaKenya’s Coconut Value Chain by Gatsby Africa
Kenya’s Coconut Value Chain by Gatsby Africaictsugar
 
8447779800, Low rate Call girls in Saket Delhi NCR
8447779800, Low rate Call girls in Saket Delhi NCR8447779800, Low rate Call girls in Saket Delhi NCR
8447779800, Low rate Call girls in Saket Delhi NCRashishs7044
 
8447779800, Low rate Call girls in Kotla Mubarakpur Delhi NCR
8447779800, Low rate Call girls in Kotla Mubarakpur Delhi NCR8447779800, Low rate Call girls in Kotla Mubarakpur Delhi NCR
8447779800, Low rate Call girls in Kotla Mubarakpur Delhi NCRashishs7044
 

Recently uploaded (20)

8447779800, Low rate Call girls in New Ashok Nagar Delhi NCR
8447779800, Low rate Call girls in New Ashok Nagar Delhi NCR8447779800, Low rate Call girls in New Ashok Nagar Delhi NCR
8447779800, Low rate Call girls in New Ashok Nagar Delhi NCR
 
Future Of Sample Report 2024 | Redacted Version
Future Of Sample Report 2024 | Redacted VersionFuture Of Sample Report 2024 | Redacted Version
Future Of Sample Report 2024 | Redacted Version
 
Contemporary Economic Issues Facing the Filipino Entrepreneur (1).pptx
Contemporary Economic Issues Facing the Filipino Entrepreneur (1).pptxContemporary Economic Issues Facing the Filipino Entrepreneur (1).pptx
Contemporary Economic Issues Facing the Filipino Entrepreneur (1).pptx
 
8447779800, Low rate Call girls in Shivaji Enclave Delhi NCR
8447779800, Low rate Call girls in Shivaji Enclave Delhi NCR8447779800, Low rate Call girls in Shivaji Enclave Delhi NCR
8447779800, Low rate Call girls in Shivaji Enclave Delhi NCR
 
The CMO Survey - Highlights and Insights Report - Spring 2024
The CMO Survey - Highlights and Insights Report - Spring 2024The CMO Survey - Highlights and Insights Report - Spring 2024
The CMO Survey - Highlights and Insights Report - Spring 2024
 
Marketplace and Quality Assurance Presentation - Vincent Chirchir
Marketplace and Quality Assurance Presentation - Vincent ChirchirMarketplace and Quality Assurance Presentation - Vincent Chirchir
Marketplace and Quality Assurance Presentation - Vincent Chirchir
 
Ten Organizational Design Models to align structure and operations to busines...
Ten Organizational Design Models to align structure and operations to busines...Ten Organizational Design Models to align structure and operations to busines...
Ten Organizational Design Models to align structure and operations to busines...
 
8447779800, Low rate Call girls in Tughlakabad Delhi NCR
8447779800, Low rate Call girls in Tughlakabad Delhi NCR8447779800, Low rate Call girls in Tughlakabad Delhi NCR
8447779800, Low rate Call girls in Tughlakabad Delhi NCR
 
Lowrate Call Girls In Sector 18 Noida ❤️8860477959 Escorts 100% Genuine Servi...
Lowrate Call Girls In Sector 18 Noida ❤️8860477959 Escorts 100% Genuine Servi...Lowrate Call Girls In Sector 18 Noida ❤️8860477959 Escorts 100% Genuine Servi...
Lowrate Call Girls In Sector 18 Noida ❤️8860477959 Escorts 100% Genuine Servi...
 
Intro to BCG's Carbon Emissions Benchmark_vF.pdf
Intro to BCG's Carbon Emissions Benchmark_vF.pdfIntro to BCG's Carbon Emissions Benchmark_vF.pdf
Intro to BCG's Carbon Emissions Benchmark_vF.pdf
 
Buy gmail accounts.pdf Buy Old Gmail Accounts
Buy gmail accounts.pdf Buy Old Gmail AccountsBuy gmail accounts.pdf Buy Old Gmail Accounts
Buy gmail accounts.pdf Buy Old Gmail Accounts
 
/:Call Girls In Indirapuram Ghaziabad ➥9990211544 Independent Best Escorts In...
/:Call Girls In Indirapuram Ghaziabad ➥9990211544 Independent Best Escorts In.../:Call Girls In Indirapuram Ghaziabad ➥9990211544 Independent Best Escorts In...
/:Call Girls In Indirapuram Ghaziabad ➥9990211544 Independent Best Escorts In...
 
Market Sizes Sample Report - 2024 Edition
Market Sizes Sample Report - 2024 EditionMarket Sizes Sample Report - 2024 Edition
Market Sizes Sample Report - 2024 Edition
 
Digital Transformation in the PLM domain - distrib.pdf
Digital Transformation in the PLM domain - distrib.pdfDigital Transformation in the PLM domain - distrib.pdf
Digital Transformation in the PLM domain - distrib.pdf
 
Call Girls In Connaught Place Delhi ❤️88604**77959_Russian 100% Genuine Escor...
Call Girls In Connaught Place Delhi ❤️88604**77959_Russian 100% Genuine Escor...Call Girls In Connaught Place Delhi ❤️88604**77959_Russian 100% Genuine Escor...
Call Girls In Connaught Place Delhi ❤️88604**77959_Russian 100% Genuine Escor...
 
Call Girls in DELHI Cantt, ( Call Me )-8377877756-Female Escort- In Delhi / Ncr
Call Girls in DELHI Cantt, ( Call Me )-8377877756-Female Escort- In Delhi / NcrCall Girls in DELHI Cantt, ( Call Me )-8377877756-Female Escort- In Delhi / Ncr
Call Girls in DELHI Cantt, ( Call Me )-8377877756-Female Escort- In Delhi / Ncr
 
FULL ENJOY Call girls in Paharganj Delhi | 8377087607
FULL ENJOY Call girls in Paharganj Delhi | 8377087607FULL ENJOY Call girls in Paharganj Delhi | 8377087607
FULL ENJOY Call girls in Paharganj Delhi | 8377087607
 
Kenya’s Coconut Value Chain by Gatsby Africa
Kenya’s Coconut Value Chain by Gatsby AfricaKenya’s Coconut Value Chain by Gatsby Africa
Kenya’s Coconut Value Chain by Gatsby Africa
 
8447779800, Low rate Call girls in Saket Delhi NCR
8447779800, Low rate Call girls in Saket Delhi NCR8447779800, Low rate Call girls in Saket Delhi NCR
8447779800, Low rate Call girls in Saket Delhi NCR
 
8447779800, Low rate Call girls in Kotla Mubarakpur Delhi NCR
8447779800, Low rate Call girls in Kotla Mubarakpur Delhi NCR8447779800, Low rate Call girls in Kotla Mubarakpur Delhi NCR
8447779800, Low rate Call girls in Kotla Mubarakpur Delhi NCR
 

The Baby Boomer Mirage is Fading Fast

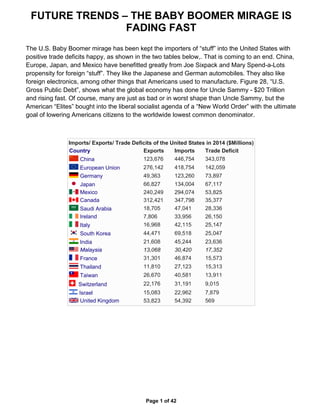
  • 1. FUTURE TRENDS – THE BABY BOOMER MIRAGE IS FADING FAST Page 1 of 42 The U.S. Baby Boomer mirage has been kept the importers of “stuff” into the United States with positive trade deficits happy, as shown in the two tables below,. That is coming to an end. China, Europe, Japan, and Mexico have benefitted greatly from Joe Sixpack and Mary Spend-a-Lots propensity for foreign “stuff”. They like the Japanese and German automobiles. They also like foreign electronics, among other things that Americans used to manufacture. Figure 28, “U.S. Gross Public Debt”, shows what the global economy has done for Uncle Sammy - $20 Trillion and rising fast. Of course, many are just as bad or in worst shape than Uncle Sammy, but the American “Elites” bought into the liberal socialist agenda of a “New World Order” with the ultimate goal of lowering Americans citizens to the worldwide lowest common denominator. Imports/ Exports/ Trade Deficits of the United States in 2014 ($Millions) Country Exports Imports Trade Deficit China 123,676 446,754 343,078 European Union 276,142 418,754 142,059 Germany 49,363 123,260 73,897 Japan 66,827 134,004 67,117 Mexico 240,249 294,074 53,825 Canada 312,421 347,798 35,377 Saudi Arabia 18,705 47,041 28,336 Ireland 7,806 33,956 26,150 Italy 16,968 42,115 25,147 South Korea 44,471 69,518 25,047 India 21,608 45,244 23,636 Malaysia 13,068 30,420 17,352 France 31,301 46,874 15,573 Thailand 11,810 27,123 15,313 Taiwan 26,670 40,581 13,911 Switzerland 22,176 31,191 9,015 Israel 15,083 22,962 7,879 United Kingdom 53,823 54,392 569
  • 2. FUTURE TRENDS – THE BABY BOOMER MIRAGE IS FADING FAST Page 2 of 42 U.S. Balance of Trade in 2015 ($Billions) Product Imports Exports Difference +/- Electronic equipment $332.9 $169.8 -$163.1 Machines, engines, pumps $329.3 $205.8 -$123.5 Vehicles $283.8 $127.1 -$146.7 Fuel $201.2 $106.1 -$95.1 Pharmaceuticals $86.1 $47.3 -$38.8 Medical, technical equipment $78.3 $83.4 +$5.1 Furniture, lighting, signs $61.2 $11.5 -$49.7 Gems, precious metals $60.2 $58.7 -$1.5 Organic chemicals $52.1 $38.8 -$13.3 Plastics $50.2 $60.3 +$10.1 Aircraft/Spacecraft $35.3 $131.1 +$95.8 Total of all trade $2.309 Trillion $1.51 Trillion -$799
  • 3. FUTURE TRENDS – THE BABY BOOMER MIRAGE IS FADING FAST Page 3 of 42 The main thing the U.S. “working class” lost sight of as they got on the liberal bandwagon for the global economy and elected U.S. Presidents who accommodated the agenda is that their higher paying manufacturing jobs were disappearing right and left. What was “filling in the income gaps” was a combination of low paying service jobs in combination with the welfare state and the promise of Federal cradle to grave care of the masses in exchange for freedom. Obama promised change. Figure 29, “U.S. Labor Participation Rate”, and Figure 28, U.S. Gross Public Debt”, show the kind of change that results from his promises, and more “after taste” is still on the way. How you like it Joe and Mary? Well the “Last of Mohicans” didn’t like it. The arithmetic majority of demoralized dependents still want it. However, now we have a businessman for President, and not a paid-for politician/rainmaker. The businessman knows that manufacturing is what built the post-world war II dominance. If Uncle Sammy is to achieve any semblance of future greatness, manufacturing is what must return to Suburbialand. Nevertheless, the damage caused by the last President and his inept Congress is irreparable. Trump will try to repair the damage and just the effort, even if he doesn’t bring America back to Post WII glory, may save what’s worth saving – freedom to succeed or fail without the divine right of the King hanging over you. The divine right of the bureaucracy is just as bad. Freedom and the possibilities (not the guarantees) it brings was the American dream since post Declaration of Independence, and it was the American way until FDR decided to save the poor working class. Thereafter, the slow buildup of the welfare state began and so did the increasing dependent class. Post WWII Uncle Sammy could afford a little socialism. Heck, we didn’t have any competition. Figure 32, “U.S. Car Production” and Figure 33, “U.S. Steel Production” shows what happens when you retire early from the world rat race. Manufacturing jobs started disappearing in the early 1980s. The post WWII buildup transformed into the “Baby Boomer Mirage”. Figure 22, “U.S. Manufacturing Employees”, clearly shows the transition. The Vietnam War put a tear in Uncle Sammy’s iron coat. The Arabs new found oil power in the 1970s put another tear in his coat. Finally, it was “the computer age” care of Bill Gates and his growing “silicon valley” bunch that became the new economic engine of America – with the help of McDonald’s and Wal-Mart. This engine only drove the “siliconers” and the Waltons to extraordinary wealth. It didn’t help the Middle Class. The new services economy doesn’t work that well, does it Joe and Mary? The way it has worked since 1979 is the illusion of middle class wealth that was real Post War II was kept alive by increasing amounts of debt. You see, it was no longer about production; it was about consumption. It was no longer about saving, it was about spending. And the Gates, and Buffets, and Waltons took advantage of this trend. It’s the American way, why not? Foreign countries with their Post WWII rebuilt economies were more than willing to keep Joe and Mary spending money they didn’t have. Buy it on sale and finance it. We’ll loan you, just keep
  • 4. FUTURE TRENDS – THE BABY BOOMER MIRAGE IS FADING FAST Page 4 of 42 buying. Figure 23, “Gross Federal Debt as Percentage of Gross Domestic Product”, shows that is exactly what happened. It started in 1979 with the oldest Baby Boomers 36 and the youngest 19 (The Fourth Turning definition of Baby Boomers 1943-1960). That’s about where you Millennials (1982-2002) are right now. First it was automobiles and then it was houses that became the Baby Boomer “soup-du-jour”. Figure 7, “Three-Month Treasury Bill”; Figure 8, “Bank Prime Loan Rate”; Figure 9, “Four-Year Auto Loan rate”; and Figure 10, “30-Year Mortgage Rate”, show the interest rates were kept low and lower to keep Joe and Mary indulged and in debt. If it was new, it was part of the Boomer lifestyle. If it was a few years old, it was thrown in the landfill. In the meantime, Uncle Sammy had wars to fight. Also, we made all these promises so we needed more bureaucrats. You all have a good time now while we solve all these problems for you! That’s all you have to say if you are a politician. By 2000, the game was over, but George W. was a fun loving Boomer growing up and he learned from his Dad that secrecy and manipulation were the name of the game. He had a former gold- bug turned Keynesian by marriage, Alan Greenspan, to keep the mirage in focus, at least until he was out of the house. So it bubble blowing time. The first bubble, the “housing bubble”, was a result of the X-Generation trying to duplicate the Baby Boomer Mirage. Too many bad loans and not enough collateral, X-Generation, so try something else. Figure 34, “U.S. Home Ownership Rate” shows that bubble burst, and the home ownership rate will continue to decline. How about oil and gas? By 2006, we were running low on both. The first bubble almost did Uncle Sammy in. But the powers that be said it was all solved, and now it is time for change, Obama style. The change was going to complete the transformation to a socialist state. It almost worked. The catalyst for change and even more mummification of Joe and Mary’s brains was the shale oil and gas craze. This certainly keeps the Wall Street bunch happy and overpaid. It also keeps the DOE bureaucracy employed by spinning yarns of a new age. The catalyst, of course, was even more money and even lower interest rates, almost zero. But we are going to raise them as the economy heals! Another key was to get an even bigger bunch of clowns in the Federal Reserve. Figure 1, “M1 Money Supply” and Figure 3, “M2 Money Supply”, show the attempt to revive the junkie with the last injection of monetary heroin; and Figure 2, “M1 Velocity of Money”, and Figure 4, “M2 Velocity of Money”, show the result. From Federal Reserve Bank of St. Louis website: Money Velocity The velocity of money is the frequency at which one unit of currency is used to purchase domestically- produced goods and services within a given time period. In other words, it is the number of times one dollar is spent to buy goods and services per unit of time. If the velocity of money is increasing, then more transactions are occurring between individuals in an economy.
  • 5. FUTURE TRENDS – THE BABY BOOMER MIRAGE IS FADING FAST Page 5 of 42 The frequency of currency exchange can be used to determine the velocity of a given component of the money supply, providing some insight into whether consumers and businesses are saving or spending their money. There are several components of the money supply: M1, M2, and MZM (M3 is no longer tracked by the Federal Reserve); these components are arranged on a spectrum of narrowest to broadest. Consider M1, the narrowest component. M1 is the money supply of currency in circulation (notes and coins, traveler’s checks [non-bank issuers], demand deposits, and checkable deposits). A decreasing velocity of M1 might indicate fewer short- term consumption transactions are taking place. We can think of shorter- term transactions as consumption we might make on an everyday basis. The broader M2 component includes M1 in addition to saving deposits, certificates of deposit (less than $100,000), and money market deposits for individuals. Comparing the velocities of M1 and M2 provides some insight into how quickly the economy is spending and how quickly it is saving. MZM (money with zero maturity) is the broadest component and consists of the supply of financial assets redeemable at par on demand: notes and coins in circulation, traveler’s checks (non-bank issuers), demand deposits, other checkable deposits, savings deposits, and all money market funds. The velocity of MZM helps determine how often financial assets are switching hands within the economy. You can lead a horse to water, but you can’t make him drink, except for the Oil and Gas wildcatter. They’ll drink anything you give them as long as you let them drill, drill, drill! However, don’t expect to get your initial investment back. The MZM velocity of money, which is the broadest money supply component, shows it was all over for Uncle Sammy a long time ago. See Figure 6, “MZM Velocity of Money”, which shows the Post WWII engine stalled a long time ago. This Baby Boomer Mirage ran on pure debt thereafter. The latest bubble is about go “boom”, not “pop”. This boom will be heard around the world, and it will end the “Age of Growth” once and for all. Trump is at least going to get the U.S. prepared for the transition from the “Age of Growth” to the “Age of Survival”, even though he and his followers think the U.S. will return to glory days. A look at the serious nature of this latest bubble is in order to understand the possible aftermath. The gas for blowing up the bubble was provided by more debt, a lot more debt and low interest for that debt. It’s the Baby Boomers going away present for future generations. Figure 13, “U.S. Public Debt”, shows the increase since 2008. Figure 14, “Gross Domestic Product”, increased, but not like in the past. What did increase bigtime was debt as a percentage of GDP. Figure 16, “Federal Debt Held By Federal Reserve Banks As A Percentage Of Gross Domestic Product; Figure 18, “Federal Debt Held By The Public As A Percentage Of Gross Domestic Product”; Figure 20, “Federal Debt Held By Foreign And International Investors As A
  • 6. FUTURE TRENDS – THE BABY BOOMER MIRAGE IS FADING FAST Page 6 of 42 Percentage Of Gross Domestic Product”, show that all the large holders of debt increased their share of the U.S. economy. Figure 21 shows that the Federal Reserve has blown the last bubble. When it blows up, the shale oil-gas industry goes with it. Figure 30, “U.S. Employed Persons”, shows the period 2008 to 2016 increased employment, but Figure 31, “U.S” Manufacturing Payrolls” shows manufacturing jobs were about the same as 2007. The jobs created were low paying, part-time service jobs, if you even believe the unemployment data. That’s not what “Made America Great” during the Post WWII period. Figure 11, “Wilshire 5000 Index”. Shows what else is going down the drain. Whether it is the DOW, Nasdaq, S&P500, or the more inclusive Wilshire 5000, they are all way over valued. When they go, the money that is driving this oil-gas craze goes also. Then “Making America Great Again” is going to have to take on a more realistic tone. However, Trump needs to continue the following to “Save America”: • Significantly reduce the bureaucracy. (20% reduction is not enough.) • Leave the United Nations (This organization is nothing but another Uncle Sam money drain and a platform for Globalists) • Start chipping away at the welfare system (We can’t afford it. Domestic jobs must be created concurrently.) • Raise the retirement age. (Even the old people who can walk and talk will have to work.) • Reestablish a real border against illegal immigration. (People will need to work again at whatever is available.) • Demolish business inhibiting legislation. (If ever innovation was needed, it will be after the crisis begins.) • Stop subsidizing losers. (It will survive if it is the lowest cost alternative.) • Open up exploration of oil and gas (But don’t subsidize it any way. Increased price will reduce demand naturally.) • Lower taxes across the board. (That coordinates with demolishing the bureaucracy.) • Renegotiate the debt with foreign holders. (If not, than default on the debt. The future is going to be about a lower standard of living for Joe and Mary anyway.) The U.S. is going to have to be self-sufficient in the future. Whatever is still the U.S. will have to produce what it consumes, and no more than that. I have said the following in one of my posts before the election: At least Trump tells the partial truth. We can't save Europe, we can't save Japan, we can't save South Korea, and we shouldn't even try to save Saudi Arabia. We will be lucky to save ourselves. To save ourselves, we need to start manufacturing our own “stuff”. Five countries benefit from our “conspicuous consumption” habit. From “Countries That Purchase the Most U.S. Imports” by Karen Waksman, Updated September 08, 2016:
  • 7. FUTURE TRENDS – THE BABY BOOMER MIRAGE IS FADING FAST Page 7 of 42 Top 5 Countries That Import U.S. Products The following is a list of the top 5 countries importing U.S. products and services on an annual basis. According to the most recent data available from the U.S. Census Bureau and other U.S. government sources, the following countries make the largest amount of purchases. Considering the geography, no one should be shocked that Canada is the number one importer of U.S. goods. However, the vast array of the types of products being shipped to these countries does surprise many of those not familiar with US foreign trade trends. 1. Canada Even with the global automotive industry in decline, the top U.S. product imported by Canada is usually automotive-related, including accessories and parts. Machinery and electronic equipment usually come next, while oil and plastics, medical and technical equipment and air crafts follow after. In 2015, Canada imported $280 billion dollars’ worth of US goods. That amount is equivalent to 18.6% of the United States' overall exports. 2. Mexico With all the media attention U.S. trade with China receives, it may come as a surprise that Mexico still imports more U.S. goods and services than the far more populous country of China. In 2015, Mexico imported $236.4 billion worth of US goods, the most being in machinery, electronic equipment, and like Canada, automotive-related goods. 3. China China comes a distant third in importing of US goods compared to Canada and Mexico. China’s number one import is usually air crafts and computer accessories, parts, and peripherals. Part of this is related to the computer assembly industry, but also includes sales to Chinese retailers and end-users. In 2015, the import of US products amounted to $116.2 billion or 7.7% of the United States' overall exports. 4. Japan Typically, the primary import of American goods to Japan is civilian aircraft(s). However, medical and technical equipment also equal to about the same amount in the types of products exported to Japan from the US. Machinery and electronic equipment follow suit, with $62.5 billion or 4.2% of the US' overall exports in 2015. 5. United Kingdom With the U.S. travel market facing tough times, the aviation industry turned to the international market.
  • 8. FUTURE TRENDS – THE BABY BOOMER MIRAGE IS FADING FAST Page 8 of 42 Like Japan, the U.K.’s primary import from “across the pond” was civilian aircraft. Following this were chemicals and primary resources (such as metal for manufacturing), then electronic equipment and then pharmaceuticals. In 2015, America's exports to the UK amounted to $56.4 billion or 3.8% of the United States' overall exports. The only country we need to significantly trade with is Canada. Why? To put it bluntly, we need their heavy oil to run the refineries as long as they last. Hopefully, Americans will wake up soon and start decreasing their driving mileage and increasing their fuel economy. The only way to do that is to eventually drive much smaller American made automobiles and trucks with a larger contingent of electrics. However, electrics are not the answer to maintaining any semblance of the past. Natural gas consumption will play an increasing role in electric power production so expect the price of electricity to increase everywhere significantly and the availability to decrease. What about China? Forget China. They have a bigger economic bubble than the U.S., and their debt situation is far worse. They made an effort to become the new world power, but it’s too little, too late for them. Figure 23, “West Texas Intermediate Crude Oil Price”, shows that the price of oil has made two trips above the $100 mark. Both times caused severe slowdowns in the world economic pace. The last attempt at holding the crude oil price above $100, which lasted for a couple of years, finally killed the China boom. Figure 26, “Global Price Index For All Commodities”, shows how the price for all commodities followed the price of oil up twice and now down twice in the last 10 years. China’s building bust, as shown in Figure 27, “Global Price of Iron Ore”, has significantly slowed the industrial buildup that China hopes will move the U.S. off the world monetary throne. China has more severe problems than the U.S. The overbuilt infrastructure is unaffordable to the populace. The state controlled economy is so loaded with debt that there is no way expansion can continue for long. If the Chinese should in some way get their motor running again, it will be once again killed by rising oil and gas prices and lower world demand for everything. Their internal economy can’t keep their motor running. Just stay out of China’s way because we are on the same planet. We need to concentrate on solving our own problems and protecting our own borders, which will be a formidable, expensive task. Once all these U.S. natural gas consumers come on line, the price of natural gas will be headed back above the $10 per MMBtu mark that was exceeded twice in the last 11 years. See Figure 24, “Henry Hub Natural Gas Price”. The Age of Growth is ending and the Age of Survival is beginning. Adapt or die!
  • 9. FUTURE TRENDS – THE BABY BOOMER MIRAGE IS FADING FAST Page 9 of 42 FIGURE 1 M1 MONEY SUPPLY THE FATAL INJECTION OF MONETARY HEROIN
  • 10. FUTURE TRENDS – THE BABY BOOMER MIRAGE IS FADING FAST Page 10 of 42 FIGURE 2 M1 VELOCITY OF MONEY THE FATAL INJECTION OF MONETARY HEROIN DIDN’T GIVE THE JUNKIE A NEW
  • 11. FUTURE TRENDS – THE BABY BOOMER MIRAGE IS FADING FAST Page 11 of 42 FIGURE 3 M2 MONEY SUPPLY THE FATAL INJECTION OF MONETARY HEROIN
  • 12. FUTURE TRENDS – THE BABY BOOMER MIRAGE IS FADING FAST Page 12 of 42 FIGURE 4 M2 VELOCITY OF MONEY THE FATAL INJECTION OF MONETARY HEROIN DIDN’T GIVE THE JUNKIE A NEW HIGH
  • 13. FUTURE TRENDS – THE BABY BOOMER MIRAGE IS FADING FAST Page 13 of 42 FIGURE 5 MZM MONEY SUPPLY
  • 14. FUTURE TRENDS – THE BABY BOOMER MIRAGE IS FADING FAST Page 14 of 42 FIGURE 6 MZM VELOCITY OF MONEY THE ENGINE STALLED A LONG TIME AGO
  • 15. FUTURE TRENDS – THE BABY BOOMER MIRAGE IS FADING FAST Page 15 of 42 FIGURE 7 THREE-MONTH TREASURY BILL THE FATAL INJECTION OF MONETARY HEROIN Baby Boomer Mirage
  • 16. FUTURE TRENDS – THE BABY BOOMER MIRAGE IS FADING FAST Page 16 of 42 FIGURE 8 BANK PRIME LOAN RATE
  • 17. FUTURE TRENDS – THE BABY BOOMER MIRAGE IS FADING FAST Page 17 of 42 FIGURE 9 4-YEAR AUTO LOAN RATE
  • 18. FUTURE TRENDS – THE BABY BOOMER MIRAGE IS FADING FAST Page 18 of 42 FIGURE 10 30-YEAR FIXED RATE MORTGAGE
  • 19. FUTURE TRENDS – THE BABY BOOMER MIRAGE IS FADING FAST Page 19 of 42 FIGURE 11 WILSHIRE 5000 INDEX THE FATAL INJECTION OF MONETARY HEROIN DIDN’T GIVE THE JUNKIE A NEW HIGH, BUT IT HELPED THE WALL STREET WILD BUNCH
  • 20. FUTURE TRENDS – THE BABY BOOMER MIRAGE IS FADING FAST Page 20 of 42 FIGURE 12 TOTAL U.S. POPULATION START PRACTICING BIRTH CONTROL SOON, AND YOU MIGHT MAKE IT TO 2060
  • 21. FUTURE TRENDS – THE BABY BOOMER MIRAGE IS FADING FAST Page 21 of 42 FIGURE 13 TOTAL PUBLIC DEBT
  • 22. FUTURE TRENDS – THE BABY BOOMER MIRAGE IS FADING FAST Page 22 of 42 FIGURE 14 GROSS DOMESTIC PRODUCT
  • 23. FUTURE TRENDS – THE BABY BOOMER MIRAGE IS FADING FAST Page 23 of 42 FIGURE 15 FEDERAL DEBT HELD BY FEDERAL RESERVE BANKS
  • 24. FUTURE TRENDS – THE BABY BOOMER MIRAGE IS FADING FAST Page 24 of 42 FIGURE 16 FEDERAL DEBT HELD BY FEDERAL RESERVE BANKS AS A PERCENTAGE OF GROSS DOMESTIC PRODUCT
  • 25. FUTURE TRENDS – THE BABY BOOMER MIRAGE IS FADING FAST Page 25 of 42 FIGURE 17 FEDERAL DEBT HELD BY THE PUBLIC
  • 26. FUTURE TRENDS – THE BABY BOOMER MIRAGE IS FADING FAST Page 26 of 42 FIGURE 18 FEDERAL DEBT HELD BY THE PUBLIC AS A PERCENTAGE OF GROSS DOMESTIC PRODUCT
  • 27. FUTURE TRENDS – THE BABY BOOMER MIRAGE IS FADING FAST Page 27 of 42 FIGURE 19 FEDERAL DEBT HELD BY FOREIGN AND INTERNATIONAL INVESTORS
  • 28. FUTURE TRENDS – THE BABY BOOMER MIRAGE IS FADING FAST Page 28 of 42 FIGURE 20 FEDERAL DEBT HELD BY FOREIGN AND INTERNATIONAL INVESTORS AS A PERCENTAGE OF GROSS DOMESTIC PRODUCT
  • 29. FUTURE TRENDS – THE BABY BOOMER MIRAGE IS FADING FAST Page 29 of 42 FIGURE 21 GROSS FEDERAL DEBT AS PERCENTAGE OF GROSS DOMESTIC PRODUCT (In 1979 Baby Boomers are age 36 to 19 Years Old) Baby Boomer Mirage Post WWII ERA The Last Bubble
  • 30. FUTURE TRENDS – THE BABY BOOMER MIRAGE IS FADING FAST Page 30 of 42 FIGURE 22 U.S. MANUFACTURING EMPLOYEES (Bill Gates Starts Microsoft in 1975) Baby Boomer Mirage Post WWII ERA
  • 31. FUTURE TRENDS – THE BABY BOOMER MIRAGE IS FADING FAST Page 31 of 42 FIGURE 23 WEST TEXAS INTERMEDIATE CRUDE OIL PRICE (Two Trips Above $100 a Barrel Have Caused Economic Slowdowns) World Economic Destruction Range
  • 32. FUTURE TRENDS – THE BABY BOOMER MIRAGE IS FADING FAST Page 32 of 42 FIGURE 24 HENRY HUB NATURAL GAS PRICE (Prior to the Shale Gas Craze, Price Made Two Trips Above $10 Per MMBtu) U.S. Economy Non-Performing Range
  • 33. FUTURE TRENDS – THE BABY BOOMER MIRAGE IS FADING FAST Page 33 of 42 FIGURE 25 U.S. AVERAGE REGULAR GASOLINE PRICE
  • 34. FUTURE TRENDS – THE BABY BOOMER MIRAGE IS FADING FAST Page 34 of 42 FIGURE 26 GLOBAL PRICE INDEX FOR ALL COMMODITIES
  • 35. FUTURE TRENDS – THE BABY BOOMER MIRAGE IS FADING FAST Page 35 of 42 FIGURE 27 GLOBAL PRICE OF IRON ORE China Boom China Bust
  • 36. FUTURE TRENDS – THE BABY BOOMER MIRAGE IS FADING FAST Page 36 of 42 FIGURE 28 U.S. GROSS PUBLIC DEBT MODEL OF HOW THE FEDERAL RESERVE, NEO-CONS, CRONY CAPITALISM, AND THE WELFARE STATE CAN COOPERATE
  • 37. FUTURE TRENDS – THE BABY BOOMER MIRAGE IS FADING FAST Page 37 of 42 FIGURE 29 U.S. LABOR FORCE PARTICIPATION RATE
  • 38. FUTURE TRENDS – THE BABY BOOMER MIRAGE IS FADING FAST Page 38 of 42 FIGURE 30 U.S. EMPLOYED PERSONS
  • 39. FUTURE TRENDS – THE BABY BOOMER MIRAGE IS FADING FAST Page 39 of 42 FIGURE 31 U.S. MANUFACTURING PAYROLLS
  • 40. FUTURE TRENDS – THE BABY BOOMER MIRAGE IS FADING FAST Page 40 of 42 FIGURE 32 U.S. CAR PRODUCTION
  • 41. FUTURE TRENDS – THE BABY BOOMER MIRAGE IS FADING FAST Page 41 of 42 FIGURE 33 U.S. STEEL PRODUCTION
  • 42. FUTURE TRENDS – THE BABY BOOMER MIRAGE IS FADING FAST Page 42 of 42 FIGURE 34 U.S. HOME OWNERSHIP RATE