
Recommended
Recommended
More Related Content
What's hot
What's hot (20)
Viewers also liked
Similar to St. Louis Office Insight Q1 2015
Similar to St. Louis Office Insight Q1 2015 (20)
More from Blaise Tomazic
More from Blaise Tomazic (20)
Recently uploaded
Recently uploaded (20)
St. Louis Office Insight Q1 2015
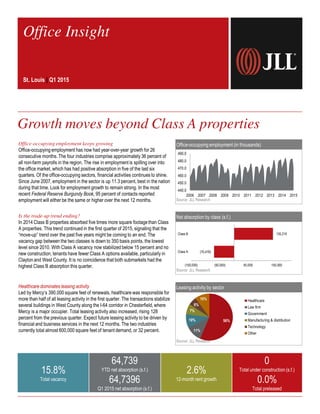
- 1. Office-occupying employment keeps growing Office-occupying employment has now had year-over-year growth for 26 consecutive months. The four industries comprise approximately 36 percent of all non-farm payrolls in the region. The rise in employment is spilling over into the office market, which has had positive absorption in five of the last six quarters. Of the office-occupying sectors, financial activities continues to shine. Since June 2007, employment in the sector is up 11.3 percent, best in the nation during that time. Look for employment growth to remain strong. In the most recent Federal Reserve Burgundy Book, 95 percent of contacts reported employment will either be the same or higher over the next 12 months. Office-occupying employment (in thousands) Source: JLL Research Is the trade-up trend ending? In 2014 Class B properties absorbed five times more square footagethan Class A properties. This trend continued in the first quarter of 2015, signaling that the “move-up” trend over the past five years might be coming to an end. The vacancy gap between the two classes is down to 350 basis points, the lowest level since 2010. With Class A vacancy now stabilized below 15 percent and no new construction, tenants have fewer Class A options available, particularly in Clayton and West County. It is no coincidence that both submarkets had the highest Class B absorption this quarter. Net absorption by class (s.f.) Source: JLL Research Healthcare dominates leasing activity Led by Mercy’s 390,000 square feet of renewals, healthcare was responsible for more than half of all leasing activity in the first quarter. The transactions stabilize several buildings in West County along the I-64 corridor in Chesterfield, where Mercy is a major occupier. Total leasing activity also increased, rising 128 percent from the previous quarter. Expect future leasing activity to be driven by financial and business services in the next 12 months. The two industries currently total almost 600,000 square feet of tenant demand, or 32 percent. Leasing activity by sector Source: JLL Research 15.8% Total vacancy 64,739 YTD net absorption (s.f.) 64,7396 Q1 2015 net absorption (s.f.) 2.6% 12-month rent growth 0 Total under construction (s.f.) 0.0% Total preleased Office Insight St. Louis | Q1 2015 (70,476) 135,215 (150,000) (50,000) 50,000 150,000 Class A Class B Growth moves beyond Class A properties 440.0 450.0 460.0 470.0 480.0 490.0 2006 2007 2008 2009 2010 2011 2012 2013 2014 2015 56% 11% 10% 7% 6% 10% Healthcare Law firm Government Manufacturing & distribution Technology Other
- 2. Current conditions – market and submarket Historical leasing activity Source: JLL Research Source: JLL Research Total net absorption (s.f.) Source: JLL Research Total vacancy rate Source: JLL Research Direct average asking rent ($ p.s.f.) Source: JLL Research 1,069,443 335,882 314,112 -500,593 29,921 -96,131 108,313 293,792 481,327 64,739 -1,000,000 -500,000 0 500,000 1,000,000 1,500,000 2006 2007 2008 2009 2010 2011 2012 2013 2014 2015 $19.26 $19.84 $19.69 $19.73 $19.77 $19.72 $19.59 $19.80 $19.40 $19.84 $18.80 $19.00 $19.20 $19.40 $19.60 $19.80 $20.00 2006 2007 2008 2009 2010 2011 2012 2013 2014 2015 12.8% 12.6% 12.1% 14.9% 15.8% 17.9% 17.9% 17.1% 15.8% 15.8% 10.0% 12.0% 14.0% 16.0% 18.0% 20.0% 2006 2007 2008 2009 2010 2011 2012 2013 2014 2015 St. Louis Landlordleverage Tenantleverage Peaking market Falling market Bottoming market Rising market Non-CBD CBD 1,240,633 1,949,408 2,420,016 3,714,770 2,987,078 737,389 0 1,000,000 2,000,000 3,000,000 4,000,000 2010 2011 2012 2013 2014 2015 ©2015 Jones Lang LaSalle IP, Inc. All rights reserved.For more information, contact: Blaise Tomazic | +1 314 261 7377 | blaise.tomazic@am.jll.com