
Recommended
Recommended
More Related Content
Similar to JLL Pittsburgh Office Insight - Q1 2015
Similar to JLL Pittsburgh Office Insight - Q1 2015 (20)
More from JLL_Midwest_Great_Lakes_Research
More from JLL_Midwest_Great_Lakes_Research (20)
Recently uploaded
Recently uploaded (20)
JLL Pittsburgh Office Insight - Q1 2015
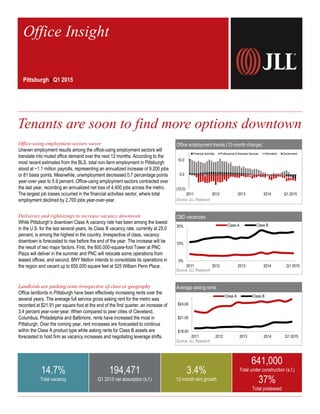
- 1. Office-using employment sectors waver Uneven employment results among the office-using employment sectors will translate into muted office demand over the next 12 months. According to the most recent estimates from the BLS, total non-farm employment in Pittsburgh stood at ~1.1 million payrolls, representing an annualized increase of 9,200 jobs or 81 basis points. Meanwhile, unemployment decreased 0.7 percentage points year-over-year to 5.9 percent. Office-using employment sectors contracted over the last year, recording an annualized net loss of 4,400 jobs across the metro. The largest job losses occurred in the financial activities sector, where total employment declined by 2,700 jobs year-over-year. Office employment trends (12-month change) Source: JLL Research Deliveries and rightsizings to increase vacancy downtown While Pittsburgh’s downtown Class A vacancy rate has been among the lowest in the U.S. for the last several years, its Class B vacancy rate, currently at 25.0 percent, is among the highest in the country. Irrespective of class, vacancy downtown is forecasted to rise before the end of the year. The increase will be the result of two major factors. First, the 800,000-square-foot Tower at PNC Plaza will deliver in the summer and PNC will relocate some operations from leased offices, and second, BNY Mellon intends to consolidate its operations in the region and vacant up to 650,000 square feet at 525 William Penn Place. CBD vacancies Source: JLL Research Landlords are pushing rents irrespective of class or geography Office landlords in Pittsburgh have been effectively increasing rents over the several years. The average full service gross asking rent for the metro was recorded at $21.91 per square foot at the end of the first quarter, an increase of 3.4 percent year-over-year. When compared to peer cities of Cleveland, Columbus, Philadelphia and Baltimore, rents have increased the most in Pittsburgh. Over the coming year, rent increases are forecasted to continue within the Class A product type while asking rents for Class B assets are forecasted to hold firm as vacancy increases and negotiating leverage shifts. Average asking rents Source: JLL Research 14.7% Total vacancy 194,471 Q1 2015 net absorption (s.f.) 3.4% 12-month rent growth 641,000 Total under construction (s.f.) 37% Total preleased Office Insight Pittsburgh | Q1 2015 Tenants are soon to find more options downtown (10.0) 0.0 10.0 2011 2012 2013 2014 Q1 2015 Financial Activities Professional & Business Services Information Government 0% 15% 30% 2011 2012 2013 2014 Q1 2015 Class A Class B $18.00 $21.00 $24.00 2011 2012 2013 2014 Q1 2015 Class A Class B
- 2. Current conditions – market and submarket Historical leasing activity Source: JLL Research Source: JLL Research Total net absorption (s.f.) Source: JLL Research Total vacancy rate Source: JLL Research Direct average asking rent ($ p.s.f.) Source: JLL Research 1,248,476 639,801 1,169,811 1,061,737 925,765 772,970 -151,142 457,951 194,471 -500,000 0 500,000 1,000,000 1,500,000 2007 2008 2009 2010 2011 2012 2013 2014 Q1 2015 $20.57 $20.84 $20.46 $20.72 $20.65 $20.81 $20.97 $21.59 $21.91 $20.00 $21.00 $22.00 2007 2008 2009 2010 2011 2012 2013 2014 Q1 2015 15.7% 15.9% 16.5% 16.1% 14.1% 14.5% 14.8% 14.9% 14.7% 13.0% 15.0% 17.0% 2007 2008 2009 2010 2011 2012 2013 2014 Q1 2015 Suburbs Landlordleverage Tenantleverage Peaking market Falling market Bottoming market Rising market CBD 3,900,000 4,200,000 3,700,000 4,500,000 500,000 0 1,500,000 3,000,000 4,500,000 2011 2012 2013 2014 Q1 2015 ©2015 Jones Lang LaSalle IP, Inc. All rights reserved.For more information, contact: Andrew Batson | +1 412 208 1400 | Andrew.Batson@am.jll.com Robert Kramp | +1 312 228 2470| Robert.Kramp@am.jll.com Pittsburgh