
Recommended
Recommended
More Related Content
What's hot
What's hot (20)
Viewers also liked
Similar to Chicago jll employment update september 2015
Similar to Chicago jll employment update september 2015 (20)
More from JLL_Midwest_Great_Lakes_Research
More from JLL_Midwest_Great_Lakes_Research (20)
Recently uploaded
Recently uploaded (20)
Chicago jll employment update september 2015
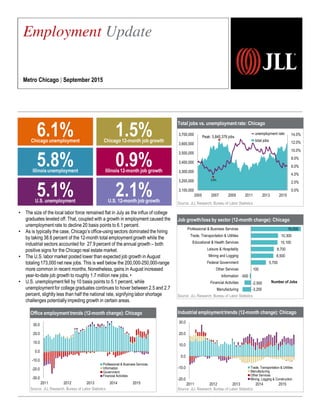
- 1. Total jobs vs. unemployment rate: Chicago Source: JLL Research, Bureau of Labor Statistics Job growth/loss by sector (12-month change): Chicago Source: JLL Research, Bureau of Labor Statistics Industrial employment trends (12-month change): Chicago Source: JLL Research, Bureau of Labor Statistics • The size of the local labor force remained flat in July as the influx of college graduates leveled off. That, coupled with a growth in employment caused the unemployment rate to decline 20 basis points to 6.1 percent. • As is typically the case, Chicago’s office-using sectors dominated the hiring by taking 38.6 percent of the 12-month total employment growth while the industrial sectors accounted for 27.9 percent of the annual growth – both positive signs for the Chicago real estate market. • The U.S. labor market posted lower than expected job growth in August totaling 173,000 net new jobs. This is well below the 200,000-250,000-range more common in recent months. Nonetheless, gains in August increased year-to-date job growth to roughly 1.7 million new jobs. • • U.S. unemployment fell by 10 basis points to 5.1 percent, while unemployment for college graduates continues to hover between 2.5 and 2.7 percent, slightly less than half the national rate, signifying labor shortage challenges potentiallyimpeding growth in certain areas. Employment Update Metro Chicago | September 2015 5.1%U.S. unemployment 2.1%U.S. 12-month job growth 6.1%Chicago unemployment 1.5%Chicago 12-month job growth 5.8%Illinoisunemployment 0.9%Illinois12-month job growth 0.0% 2.0% 4.0% 6.0% 8.0% 10.0% 12.0% 14.0% 3,100,000 3,200,000 3,300,000 3,400,000 3,500,000 3,600,000 3,700,000 2005 2007 2009 2011 2013 2015 Peak: 3,840,379 jobs 3.9% unemployment rate total jobs -3,200 -2,500 -500 100 5,700 8,500 8,700 10,100 10,300 19,000 Manufacturing Financial Activities Information Other Services Federal Government Mining and Logging Leisure & Hospitality Educational & Health Services Trade, Transportation & Utilities Professional & Business Services Number of Jobs Office employment trends (12-month change): Chicago Source: JLL Research, Bureau of Labor Statistics -30.0 -20.0 -10.0 0.0 10.0 20.0 30.0 2011 2012 2013 2014 2015 Professional & Business Services Information Government Financial Activities -20.0 -10.0 0.0 10.0 20.0 30.0 2011 2012 2013 2014 2015 Trade, Transportation & Utilities Manufacturing Other Services Mining, Logging & Construction
- 2. Industry employment stratification Chicago Source: JLL Research, Bureau of Labor Statistics ©2015 Jones Lang LaSalle IP, Inc. All rights reserved. Employment statistics Chicago July 2013 July 2014 July 2015 Total Non-farm Employment 3,549,300 1.8% 3,599,300 1.4% 3,655,500 1.6% Unemployment Rate 10.4% 7.4% 6.1% Chicago supersectors July 2013 July 2014 July 2015 Mining, Logging & Construction 118,500 4.2% 124,800 5.3% 133,300 6.8% Manufacturing 281,500 -2.1% 280,000 -0.5% 276,800 -1.1% Trade, Transportation, & Utilities 709,000 1.5% 719,100 1.4% 729,400 1.4% Information 71,500 0.0% 72,000 0.7% 71,500 -0.7% Financial Activities 250,700 0.4% 251,600 0.4% 249,100 -1.0% Professional & Business Services 651,800 4.7% 670,800 2.9% 689,800 2.8% Educational & Health Services 542,000 1.6% 553,400 2.1% 563,500 1.8% Leisure & Hospitality 348,200 3.1% 351,700 1.0% 360,400 2.5% Other Services 159,700 1.5% 162,100 1.5% 162,200 0.1% Government 416,400 0.2% 413,800 -0.6% 419,500 1.4% 20% 19% 15% 11% 10% 8% 7% 4% 4% 2% Trade, transportation and Utilities Professional and Business Services Educational and Health Services Government Leisure and Hospitality Manufacturing Financial Activities Other Services Mining, Logging and construction Information For more information, please contact: Christian Beaudoin │ christian.beaudoin@am.jll.com Chicago Office Joe Klosterman │ joe.klosterman@am.jll.com& Amy Binstein │ amy.binstein@am.jll.com Chicago Industrial Chad Buch │ chad.buch@am.jll.com & Paul Marsh │ paul.marsh@am.jll.com