
Recommended
Recommended
More Related Content
What's hot
What's hot (20)
Similar to Cincinnati Office Insight - Q1 2015
Similar to Cincinnati Office Insight - Q1 2015 (20)
More from JLL_Midwest_Great_Lakes_Research
More from JLL_Midwest_Great_Lakes_Research (20)
Recently uploaded
Recently uploaded (20)
Cincinnati Office Insight - Q1 2015
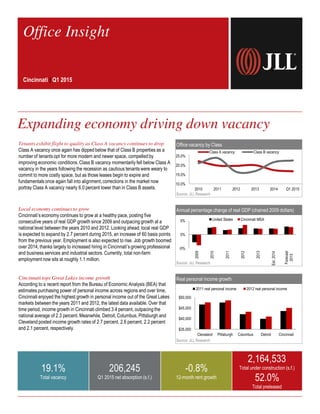
- 1. Tenants exhibit flight to quality as Class A vacancy continues to drop Class A vacancy once again has dipped below that of Class B properties as a number of tenants opt for more modern and newer space, compelled by improving economic conditions. Class B vacancy momentarily fell below Class A vacancy in the years following the recession as cautious tenants were weary to commit to more costly space, but as those leases begin to expire and fundamentals once again fall into alignment, corrections in the market now portray Class A vacancy nearly 6.0 percent lower than in Class B assets. Office vacancy by Class Source: JLL Research Local economy continues to grow Cincinnati’s economy continues to grow at a healthy pace, posting five consecutive years of real GDP growth since 2009 and outpacing growth at a national level between the years 2010 and 2012. Looking ahead, local real GDP is expected to expand by 2.7 percent during 2015, an increase of 60 basis points from the previous year. Employment is also expected to rise. Job growth boomed over 2014, thanks largely to increased hiring in Cincinnati’s growing professional and business services and industrial sectors. Currently, total non-farm employment now sits at roughly 1.1 million. Annual percentage change of real GDP (chained 2009 dollars) Source: JLL Research Cincinnati tops Great Lakes income growth According to a recent report from the Bureau of Economic Analysis (BEA) that estimates purchasing power of personal income across regions and over time, Cincinnati enjoyed the highest growth in personal income out of the Great Lakes markets between the years 2011 and 2012, the latest data available. Over that time period, income growth in Cincinnati climbed 3.4 percent, outpacing the national average of 2.3 percent. Meanwhile, Detroit, Columbus, Pittsburgh and Cleveland posted income growth rates of 2.7 percent, 2.6 percent, 2.2 percent and 2.1 percent, respectively. Real personal income growth Source: JLL Research 19.1% Total vacancy 206,245 Q1 2015 net absorption (s.f.) -0.8% 12-month rent growth 2,164,533 Total under construction (s.f.) 52.0% Total preleased Office Insight Cincinnati | Q1 2015 Expanding economy driving down vacancy -5% 0% 5% 2009 2010 2011 2012 2013 Est.2014 Forecast 2015 United States Cincinnati MSA $35,000 $40,000 $45,000 $50,000 Cleveland Pittsburgh Columbus Detroit Cincinnati 2011 real personal income 2012 real personal income 10.0% 15.0% 20.0% 25.0% 2010 2011 2012 2013 2014 Q1 2015 Class A vacancy Class B vacancy
- 2. Current conditions – market and submarket Historical leasing activity Source: JLL Research Source: JLL Research Total net absorption (s.f.) Source: JLL Research Total vacancy rate Source: JLL Research Direct average asking rent ($ p.s.f.) Source: JLL Research -464,648 79,469 143,641 290,120 562,970 206,245 -600,000 -400,000 -200,000 0 200,000 400,000 600,000 800,000 2010 2011 2012 2013 2014 Q1 2015 $17.39 $17.94 $18.41 $19.68 $19.15 $18.88 $16.00 $17.00 $18.00 $19.00 $20.00 2010 2011 2012 2013 2014 Q1 2015 22.7% 22.6% 22.5% 21.3% 19.8% 19.1% 17.0% 18.0% 19.0% 20.0% 21.0% 22.0% 23.0% 2010 2011 2012 2013 2014 Q1 2015 Cincinnati Landlordleverage Tenantleverage Peaking market Falling market Bottoming market Rising market Suburban Urban 2,700,000 1,700,000 1,800,000 2,200,000 300,000 0 500,000 1,000,000 1,500,000 2,000,000 2,500,000 3,000,000 2011 2012 2013 2014 Q1 2015 ©2015 Jones Lang LaSalle IP, Inc. All rights reserved.For more information, contact: Cody Brooks | +1 513 297 2509 | Cody.Brooks@am.jll.com