SlideShare a Scribd company logo
1 of 138
Download to read offline
Retrospective Theses and Dissertations
Iowa State University Capstones, Theses and
Dissertations
1997
Teaching strategies, their use and effectiveness as
perceived by teachers of agriculture: A national
study
Yun Ho Shinn
Iowa State University
Follow this and additional works at: https://lib.dr.iastate.edu/rtd
Part of the Agricultural Education Commons, Other Education Commons, and the Secondary
Education and Teaching Commons
This Dissertation is brought to you for free and open access by the Iowa State University Capstones, Theses and Dissertations at Iowa State University
Digital Repository. It has been accepted for inclusion in Retrospective Theses and Dissertations by an authorized administrator of Iowa State University
Digital Repository. For more information, please contact digirep@iastate.edu.
Recommended Citation
Shinn, Yun Ho, "Teaching strategies, their use and effectiveness as perceived by teachers of agriculture: A national study" (1997).
Retrospective Theses and Dissertations. 12244.
https://lib.dr.iastate.edu/rtd/12244
INFORMATION TO USERS
This manuscript has been reproduced from the microfilm master. UMI
films the text directly from the original or copy submitted. Thus, some
thesis and dissertation copies are in typewriter &ce, while others may be
from anytype of computer printer.
The qualify of this reproduction is dependent upon the quality of the
copy submitted. Broken or indistinct print, colored or poor quality
illustrations and photographs, print bleedthrough, substandard margins,
and improperaligmnent can adversely affect reproduction.
In the unlikely event that the author did not send UMI a complete
manuscript and there are missing pages, these wiU be noted. Also, if
unauthorized copyright material had to be removed, a note will mdicate
the deletion.
Oversize materials (e.g., maps, drawings, charts) are reproduced by
sectioning the original, beginning at the upper left-hand comer and
continuing from left to right in equal sections with small overlaps. Each
original is also photographed in one exposure and is included in reduced
form at the back of the book.
Photographs included in the original manuscript have been reproduced
xerographically in this copy. ICgher quality 6"x 9"black and white
photographic prints are available for any photographs or illustrations
appearing in this copy for an additional charge. Contact UMI directly to
order.
UMIA Bell & Howell Information Company
300 North Zed) Road, Ann Aibor NO 48106-1346 USA
313/761-4700 800/521-0600
Teaching strategies, their use and effectiveness as perceived by teachers
of agriculture: A national study
by
Yun Ho Shinn
A dissertation submitted to the graduatefaculty
in partial fulfillment of the requirements for the degree of
DOCTOR OF PHILOSOPHY
Major Agricultural Education (Agricultural Extension Education)
Major Professor: Robert A. Martin
Iowa State University
Ames, Iowa
1997
Copyright © Yun Ho Shinn, 1997. All rights reserved.
DMI Number: 9737757
Copyright 1997 by
Shinn, Yun-Ho
All rights reserved.
UMI Microform 9737757
Copyright 1997, by UMI Company. All rights reserved.
This microform edition is protected against wiauthorized
copying under Title 17, United States Code.
UMI300 North Zeeb Road
Ann Artror, MI 48103
ii
Graduate College
Iowa State University
This is to certify that the Doctoral dissertation of
Yun Ho Shinn
has met the dissertation requirements of Iowa State University
Major Professor
For the Major Program
or the Graduate College
Signature was redacted for privacy.
iii
DEDICATION
This study is dedicated to my family Father, In Sik Shinn, and
Mother, Soon Ja Lee,
who first gave me roots and then wings;
my three brothers and three sisters;
my wife, Ji Suk Kim, who just sacrificed
herself to support me to complete this study.
Thank GOD, who guides my life and teaches me what is
the truth and what I should dofor the people and for the Agriculture.
iv
TABLE OF CONTENTS
LISTOFHGURES
LIST OFTABLES
ABSTRACT
CHAPTER L INTRODUCTION
Background
Statement of the Problem
Purpose and Objectives of the Study
Need for the Study
Implications and Educational Significance
Operational Definitions
CHAPTER n.REVIEW OF LITERATURE
Teaching-Learning Principles
Teaching Methods, Techniques and Tools
Teaching Effectiveness
Teacher-Student Factors
Models for Teaching Strategy
Summary
Research Questions
CHAPTER m. METHODS AND PROCEDURES
Research Design
Population and Sampling
Instrumentation
Data Collection
Coding and Analysis of Data
Limitations to the Smdy
Assumptions
CHAPTER IV. FINDINGS
Reliability Tests
Demographic Information of the Respondents
Perceptions of the Respondents Regarding Teaching and Learning Principles
Analysis of variance for the teaching-learning principles
Perceptions of the Respondents Regarding the Use and Effectiveness
of Selected Teaching Methods and Tools
Perceptions of Secondary Agriculmral Education Teachers Regarding
Effectiveness of Selected Teaching Methods and Tools
vi
vii
X
1
1
6
8
9
9
11
13
13
16
19
22
23
26
27
29
29
30
31
35
36
38
38
39
40
41
47
50
54
64
V
Selected Comments and Opinions from the Respondents 72
CHAPTER V. DISCUSSION 77
Demographic Information 78
Perceptions Regarding theSelected Teaching and Learning Principles 79
Perceptions of the Extent of Use of the Selected TeachingStrategies 80
Perceptions of the Effectiveness of the Selected TeachingMethods and Tools 82
A Model to Guide Selection of Teaching and Learning Strategies 83
CHAPTER VI. SUMMARY, CONCLUSIONS, AND RECOMMENDATIONS 87
Summary 87
Conclusions 92
Recommendations 95
Recommendations for Further Research 96
Implications and Educational Significance of the Study 97
APPENDIX A. HUMAN SUBJECT REVIEW COMMITTEE APPROVALFORM 98
APPEXDIXB. FIRST DRAFT QUESTIONNAIRE WITH
A PILOT TEST COVER LETTER 102
APPENDIX C SURVEY INSTRUMENT 110
APPENDIX D. FOLLOW-UP LETTER 117
BIBLIOGRAPHY 119
ACKNOWLEDGMENTS 123
vi
UST OF FIGURES
Figure 1. How instructional elements vary depending on the type of knowledge. 26
Figure 2. Distribution of respondents by years of teaching experiences (n = 386). 42
Figure 3. Distribution of respondents by gender (n = 386). 42
Figure 4. Distribution of respondents by highest educational level attained. 43
Figure 5. Distribution of respondents by group of age. 44
Figure 6. Distribution of respondents by days of teaching contract per year. 44
Figure 7. Distribution of respondents by number of courses taken related
to teaching and learning. 45
Figure 8. Distribution of respondents by school location. 46
Figure 9. Distribution of respondents by school size. 46
Figure 10. A model for selectingof teaching/learning strategies in
secondary agricultural education programs 84
vii
LIST OF TABLES
Table 1. Distribution of respondents in the states and percentages of questionnaires
remmed and analyzed (n = 386)
Table 2. Coefficient values for three parts of the instrument.
Table 3. Means and standard deviations of perceptions held by the respondents
regarding selected teaching-learning principles in secondary agricultural
education programs (n = 386).
Table4. Analysis of variance of means/standard deviations regarding perceptions
of teaching-learning principles when grouped by teaching experience (n=386).
Table 5. Gender differences in the perceptions held by the respondents regarding
teaching and leaming principles in secondary agricultural education
programs (n=386).
Table 6. Analysis of variance of means/standard deviations regarding selected teaching-
leaming principles as perceived by teachers when grouped by level of
education (n=386).
Table 7. Analysis of variance of means/standard deviations regarding perceptions
based on age groups regarding selected teaching-learning principles (n=386).
Table 8. Analysis of variance of means/standard deviations based on respondents
perceptions of teaching-leaming principles when grouped by length
of contract (n=386)
Table 9. Analysis of variance of means/standard deviations based on respondents
perceptions of teaching/learning principles when grouped by number of
courses taken focused on teaching/learning (n=386).
Table 10. Analysis of variance of means/standard deviations based on respondents
perceptions of teaching/learning principles when grouped by school
location (n=386).
Table 11. Analysis of variance of means/standard deviations regarding respondents
perceptions of teaching/learning principles when grouped by school
size (n=386).
Table 12. Means and standard deviations of ratings of respondents regarding
the use and effectiveness of selected teaching methods and tools (n=386).
32
41
48
50
51
51
52
52
53
53
54
56
viii
Table 13. Analysis of variance of means/standard deviations based on respondents'
perceptions regarding the extent to which selected methods and tools are
used when respondents are grouped by teaching experience (n=386).
Table 14. Means and standard deviations based on ratings of male and female
respondents' perceived use of selected teaching methods and tools (n=386).
Table 15. Analysis of variance of means/standard deviations based on respondents
perceptions regarding the extent to which selected methods and tools are
used when respondents are grouped by level of education (n=386).
Table 16. Analysis of variance of means/standard deviations based on respondents
perceptions regarding extent use of selected teaching methods and tools
when respondents are grouped by age (n=386).
Table 17. Analysis of variance of means/standard deviations based on respondents
perceptions regarding the extent to which selected methods and tools are
used when respondents are grouped by length of contracts (n=386).
Table 18. Analysis of variance of means/standard deviations based on respondents'
perceptions regarding theextent to which selected methods and tools are
used when respondents are grouped by the number of courses taken
focused on teaching and learning (n=386).
Table 19. Analysis of variance of means/standard deviations based on respondents
perceptions regarding the extent to which selected methods and tools are
used when respondents are grouped by school locations (n=386).
Table 20. Analysis of variance of means/standard deviations based on respondents'
perceptions regarding the extent to which selected methods and tools are
used when respondents are grouped by school size (n=386).
Table 21. Analysis of variance of means/standard deviations based on respondents'
perceptions regarding the effectiveness of selected teaching methods and
tools when respondents are grouped by years of teaching experience (n=386).
Table 22. Means, standard deviations and t values of female and male respondents
perceptions regarding effectiveness of selected teaching methods and
tools (n=386).
Table 23. Analysis of variance of means/standard deviations based on respondents
perceptions regarding the effectiveness of selected teaching methods and
tools when respondents are grouped by age (n=386).
57
59
60
60
61
63
64
65
66
67
68
ix
Table 24. Analysis of variance of means/standard deviations based on respondents
perceptions regarding the effectiveness of selected teaching methods and
tools when respondents are grouped by length of teaching contract (n=386).
Table 25. Analysis of variance of means/standard deviations based on respondents
perceptions regarding the effectivenessof selected teaching methods and
tools when respondents are grouped by the number of courses taken on
teaching and learning (n=386).
Table 26. Analysis of variance of means/standard deviations based on respondents
perceptions regarding the effectiveness of selected teaching methods and
tools when respondents are grouped by school location (n=386).
Table 27. Analysis of variance of means/standard deviations based on respondents
perceptions regarding the effectiveness of selected teaching methods and
tools when respondents are grouped by school size (n=386).
X
ABSTRACT
The primary purpose of this study was to identify perceptions of agricultural
education teachers in the United States of America regarding selected principles of teaching
and learning, the current use of selected instructional methods and tools and their
effectiveness. A secondary purpose was to determine the relationship between the selected
variables and to develop a model forguiding successful use of selected teaching and learning
strategies in secondary agricultural education programs.
Teachers responding to the questionnaire rated most of the principles of
teaching/learning fairly high on the scale. The highest rated principles were "individual
differences exist among students," "Importance of feedback for student learning,"
"Importance of teaching strategy," and "Using a variety of evaluation procedures." The
lowest rated principles were "a student's grades should be based on what the student has
learned," and "the student's learning style is related to the teacher's teaching style," and
"directed learning is more effective than undirected learning."
The methods and tools used most by teachers included demonstrations, discussions,
laboratories, projects, contests, using real objects and supervised experience.
The most effective teaching methods and tools included using laboratories,
demonstrations, contests, using real objects, discussion and supervised experience. Teacher
characteristics influencing the use of selected to perceive of the selected teaching methods
included the number of courses taken focusing on teaching and learning, length of teaching
contract, school location, school size, academic background and gender. The number of
xi
courses taken focusing on teaching and learning most influence on the perceived
effectiveness of selected teaching methods and tools.
A model was developed for selecting appropriate teaching methods and tools in
secondary agricultural education programs. There were several important components
identified in the model. These components included the type of subject matter, resources
available in the school and community, instructional units, skills, facts, concepts, processes,
and principles, analysis of the student-teacher activities for the units and using selected
teaching-learning principles.
I
CHAPTER L INTRODUCTION
Background
Recognizing individual differences of the learners is a basic concept
when teachers prepare to teach... It isa fiindamental assumption of
strategic teaching and learning that what we choose to teach in the
classroom should be an interaction of what we know about the variables
of instruction, learning, achievement, and contextual factors. This
assumption has driven our quest as individuals and groups to develop an
instructional framework... (Jones, 1987: p. v)
Rosenshine and Frust (1973) reported that students leam best when the following
characteristics are present: (1) variability in teaching methods and materials, (2) interest, (3)
clarity, (4) task-oriented behavior, (5) teacher use of structuring comments, (6) student
opportunity to leam the material, (7) multiple levels of questions, and (8) enthusiasm.
Yelon (1996, p. 3) promoted the ten powerful instructional principles that he believed
excellent teachers apply which are: meaningfiilness, prerequisites, open communication,
organized essential ideas, learning aids, novelty, modeling, active appropriate practice,
pleasant conditions and consequences, and consistency. Monk and Dillion (1995) suggested
in the planning and managing for teaching science that the aimsof activities are to help
teachers to develop the following:
(1) knowledge of the elements of planning and classroom management;
(2) skills and strategiesfor organizing and managing activities in lessons;
(3) skills and strategies in planning and managingcontinuity between lessons;
(4) experience in developing and planning a scheme of work. (p. 53)
Furthermore the learner's power to think and solve problems should be a component
of a well designed instructional strategy and its effectiveness. The teaching-learning process
2
in secondary education is basically a problem solving activity. According to Dyer and
Osborne (1995), the learner's problemsolving ability can be accelerated with the use of
appropriate instructional approaches. Agricultural education programs provide a curriculum
aimed at helping individuals gain knowledge and skills in agriculture.
Moore (1994) studied the historical teaching me±odologies in agricultural education
and found three major teaching approaches in agriculture: formal steps, project approach, and
problem solving approach. These approaches were used from the late 1800s to 1980s.
Newcomb et al. (1986) and Tyler (1969) concluded that the teaching strategy must base
learning on inquiry, investigation, and critical study in situations in which genuine purposes,
needs, and wants are experienced. For this reason, the role of teachers and their teaching
strategies are never ending topics in all educational settings (Martin et al., 1986; Miller et al.,
1984).
Recently there has been much concern expressed about quality teaching in educational
institutions, while industries in the rapidly changing society have been concerned about the
well educated person. These concems have led to the issue of teaching strategies and their
effectiveness in secondary agriculture education (Kahler, 1995; Martin, 1995; Moore, 1994;
Rollins, 1989). As agriculmral educators it is our responsibility to ensure adequate teaching
and learning as necessary to meet the changing needs of the industry and the values of society
(Melion, 1995, p. 5). According to Carkhuff (1981), teaching is the opportunity to help
others to live their lives fully, which means we help to give to our learners' lives through
their physical, emotional, intellectual and social growth. Anderson (1994) concluded that
student outcomes may heavily depend on the teacher's instructional planning, teaching
3
method selection, and having a variety of learning activities. The Committeeon Agricultural
Education (1988) suggested that the teaching strategy becomes the most critical element to
educate students in learning activities. Kahler (1995) addressed this issue when he stated:
I discovered that it is adifferent world in the agriculture classroom than when
I taught agriculture. I found that many of the students were not interested in
what I was teaching them. I had to deal with several confrontations wherein
students refused to perform tasks that Iasked them to do. Some of my students
just sat passively while I taught and waited for the bell so they could leave.
Several of the students were visibly troubled and it was apparent that they
were in deep thought about what was bothering them. It became clear to me
rather quickly that I was not reaching them and that I did not have enough
techniques in my professional methods bag to pump up their interest in what I
was teaching, (p. 2)
Students come from different backgrounds and have varied experiences and abilities.
Good teaching is not only dependent on teaching strategies or their effectiveness but It also
depends on individual needs and adequacy of the content. Dyer and Osborne (1995) in their
study entitied "Effects of Teaching Approach on Achievement of Agricultural Education
Students with Varying LearningStyles" proposed that "the selection of an appropriate
teaching approach is one of the most important processes to have teaching success and
student achievement" (p. 260).Joyce and Weil (1986, in Dyer and Osborne 1995), further
stated that "students react differently to different teaching methods, and that the selection of
the proper method is critical to the learning style of those being served by the instruction" (p.
260). There is an assumption that students learn with different styles, at different speeds,
different levels of prior knowledge and different environments when the subject matter is
given by way of a variety of teaching strategies.
4
Phipps and Osbome (1988, p. 146) stressed that the basic factors of good teaching are
democratic behavior by teachers, use of the primarilyconcerned knowledge and skills,
readiness of a teacher and thestudent, learning by doingof agricultural problems, motivation
to leam more about a given topic, well organized structure, feedback as a basis for continued
improvement in performance, and discovery teaching and learning. Nwokoukwu (1979)
reported that effective teaching is crucial to problem-solving activity in teaching and learning,
dissemination of factual knowledge, teacher performance and ultimately to the survival of the
society. Manatt et al. (1984)found the variables of effective teaching behaviors are
productive teaching techniques, organized structured classroom management, positive
interpersonal relations, and professional responsibilities. Newcomb et al. (1986, p. 6) stated
that "instruction in agriculture varies depending on the level at which instruction is provided
and the persons for whom the instruction is offered." A recent study entitled "Teacher
perceptions of agricultural teaching practices and methods for youth and adults in Iowa"
(Kassem, 1992) concluded that the most important thing in teaching agriculture is the need
for the agriculture teacher to use effective methods and preparation for teaching.
Teaching effectiveness has been described in several ways among educational
researchers. Bar (1968, p. 23) described effectiveness in two ways. One way to describe
effectiveness is in terms of the personal prerequisites to the teaching and learning
environment. The other way is to describe effectiveness in terms of professional competency.
Moreover, experience, positive attitudes toward teaching, jobsatisfaction, etc., have resulted
in teaching effectiveness (Kassem, 1992; Weeks, 1989; Miller et al., 1984; Nwokoukwu,
1979). Drizou (1990) stressed that the most important performance of present teachers is the
5
instructional use of computers. Weeks (1988) noted that the ability to be able to use multi­
media including the computeris urgently required by agricultural educators. Nwokoukwu
(1979) stated the comprehensive teacher competencies are"verbal communication,"
"knowledge of subject matter," "interaction with students and student motivation in the
classroom situation," tocreate an environment which will develop the "students' ability,"
"salable skills," and provide them with "necessary information" which will enable smdents to
solve their present and future life problems (pp. 54-56). The ability to communicate
effectively with students in a way so as to understand the purpose and objectives of the lesson
is one of the main responsibilities of secondary agricultural education teachers. Using the
correct teaching method helps any student learn or master knowledge and skills (Odubiyi,
1988). The role of the teacher in strategic teaching builds upon previous definitions of the
teacher as manager and instructional leader (Jones et al., 1987).
There are as many different kinds of teaching as there are teachers. Many studies
have revealed that teaching activities are usually represented by teachers' teaching attitudes
and their preferences regarding teaching methods. Carkhuff (1981) stated that "some
teachers emphasize the use of question and answer techniques, others use a lot of
programmed instruction. Still others utilize the lecture method in the agri-science classroom
and using overhead projectors a great deal (p. 90)." In a very real sense, each teacher uses a
different teaching method. Weston and Cranton (1986) concluded that programmed
instruction is most effective at lower levels of learning, and independent projects are
appropriate at higher levels of learning, and these methods are flexible to the differences in
learners. Odubiyi (1988, p. 11) summarized the experiential learning methods study by
6
Weston and Cranton (1986) as comprising field/clinical experience, laboratory experience,
role playing, simulationsand drill. These methods requirecareful planning and precision at
the secondary level.
Agriculmre is becoming more business-oriented, specialized, highly technical and
internationalized. These changes require a more applied, more efficient and a developmental
approach to teaching and learning. New audio-visual materials and programmed software,
for example, havechanged teachers' teaching strategies and the learning environment in the
classroom. Therefore, forcing students to solvedifferent problems using various methods
and procedures creates an environment in which decision making and analytical thinking are
critical components of the teaching and learning process.
Statement of the I^oblem
Without good classroom management, motivation and discipline skills, teachers
cannot effectively implement their lesson plans. For teachers to be effective in today's
society, they must know how to apply modem technology to improve instruction (Henson,
1988). It is important to note that the literature states that students leam and achieve when
competent teachers use well organized instructional strategies, a variety of methods and tools,
and use them effectively. Martin (1995) stated that "Agriculmral Education is the scientific
study and appropriate application of the principles and methods of teaching and learning as
they pertain to the Food, Fiber & Natural Resource system" (p. 2). Kahler (1995, p. 2)
posited a question which asked if agricultural teachers really teach students with usefiil
methods, based on their needs and the appropriate content for the future? Moore (1994)
7
concluded and recommended in the study entitled 'Teaching Methodologies in Agricultural
Education: A Historical Analysis" that:
Since agri-science is beingemphasized today perhaps we should
reexamine experimentation asa teaching method and place more
emphasis on the techniques and procedures involved in experimentation.
This approach coupled with the profession's current use of problem
solving could lead to the advancement of agriculture teaching... In
view of the emerging "information highway" concept, it would be
appropriate to explore more fully on-line information sources and
computers in the context of teaching methods. More different teaching
methods may be needed in the future because schools are moving to
90 minute periods in a semesterized instructional program. In order
to maintain student interest, a combination of teaching methods may
need to be in a single class period. It would be desirable to reexamine
all of the various teaching techniques... (p. 234)
Agricultural industries and other services require new skills in order to cope with
rapid technological changes. These new skills can be provided especially by using a variety
of teaching strategies and effectiveness in secondary vocational agricultural education. There
has been much concern expressed about quality teaching in education, while industries in the
rapidly changing society have concerns about the well educated person. These concerns have
led to a focus on teaching strategies and their effectiveness in the secondary agriculture
program (Kahler, 1995; Martin, 1995; Moore, 1994; Rollins, 1989). The central problem of
this study was to identify the teaching strategies used by teachers of agriculture, and
determine effectiveness in secondary agriculture programs in the United States of America.
In previous studies the demographic characteristics of agriculture teachers were significantly
related to their teaching process. It was determined that these factors require further analysis.
8
Purpose and Objectives of the Study
The primary pmpose of this study was to identify perceptions of agriculmral
education teachers in the United States of America regarding selected principles of teaching
and learning, the current useof selected instructional methods and tools and their
effectiveness. A secondary purpose was to determine the relationship between the selected
variables and to develop a model forguiding successful use of selected teaching-learning
strategies in the secondary agricultural education program. The following six objectives
were addressed:
1. To identify the selected demographic characteristics of agricultural teachers in
secondary agriculmral education programs in the United States.
2. To identify agriculture teachers' perceptions regarding the principles of teaching
and learning in secondary agricultural education programs.
3. To determine the extent of use of selected teaching methods and tools by teachers of
agriculture in secondary agriculture education programs.
4. To evaluate effectiveness of selected teaching methods and tools by
secondary agriculmral education teachers.
5. To determine the relationship between the selected demographic characteristics
of teachers and the perceived principles of teaching-learning, their use and
effectiveness in agricultural education programs.
6. To develop a model to guide selection of appropriate teaching-learning strategies in
secondary agriculture education programs.
9
Need for the Study
There has been much attention given to the use of selected teaching strategies.
However, there has been no known national study in agricultural education which has
focused on teaching strategies and tools and their use and effectiveness as perceived by
agricultural teachers.
The manner in which teachers introduce information and go about the lesson is an
important area of inquiry which could lead to the improvement of secondary agricultural
education. A study about the use of educational principles and procedures in agriculmral
teaching is needed to understand current practice. The effectiveness of teaching methods and
tools represents an area of importance in secondary agricultural education.
Furthermore, a model forselecting teachingstrategies has not been developed in secondary
agriculmral education.
Therefore this study was concerned with an examination of teacher perceptions of
selected teaching-learning principles, teaching methods and tools that are used and their
effectiveness in order to draw conclusions regarding the teaching-learning process and
selecting appropriate teachingstrategies.
Implications and Educational Significance
The significance of this study is related to the present and future of agricultural
education and to understanding and improving the use of the principles of teaching-learning,
methods and tools and their effectiveness. To improve the quality of teaching and learning
that accommodates the needs and preferences of agricultural learners it is necessary to study
the educational delivery system (Moore, 1995; Dyeret al., 1995; Kassem, 1992). Some
10
authors (Moore, 1995; Kahler, 1995) have suggested that instruction in secondary agricultural
education has been inadequately delivered or did not meet educational needs. Delivering
subject matter with appropriate application is one of the most essential activities for teachers
(Henson, 1988). A systematicstudy of teaching strategies, and their effectiveness was
needed in secondary agriculture education.
The Vocational Act of 1917 provided the basis for the development of agricultural
education as a unique discipline signifying the perfect union between agriculture and
education. Over the years, this unique discipline has evolvedfrom encompassing not just the
simple acquisition of technical knowledge, but also the application and evaluation of the
scientific principles and methods governing the development of agricultural manpower
through well organized teaching processes (Martin, 1995).
The results from this study should offer the reconunendations and influences to
improve the quality of teaching in agricultural education programs at the secondary school
level. This study may enable teachers of secondary agricultural education to learn insight on
how to do a better job teaching theirclasses in order to enhance the achievement of their
educational goals and objectives. Educational administrators, planners, and decision-makers
in secondary schools should find the information generated useful in gaining better insights
into the current instructional strategies and how to modify them for greater effectiveness of
the teaching-learning process. The recommendations offered by the smdy should go a long
way in helping teachers use appropriate instructional techniques to improve student
performance and leaming skills.
II
Operational Definitions
The following terms were defined to help fimie the study.
Teaching strategy - a complex educational behavior of a teacherin using methods,
techniques, tools, discipline and communications in order to achieve goals and /or
objectives.
Methods - procedures, styles or ways in which a teacher has selected to facilitate the
teaching-learning process (Weeks, 1988).
Teaching tools - equipment used in facilitating the teaching-leaming process (Creswell,
1990).
Technique - a teaching method, skill, style, procedure which a teacher has selected to
facilitate the teaching/learning process (Ware, 1989).
Perception - a judgment or interpretive ability based on knowledge and insight gained
through a teacher's senses, an observation or awareness of some condition,
event or concept.
Effectiveness - producing the desired result of teaching-leaming through the use of selected
methods, techniques and tools.
Principles of teaching-learning - tenets used by educators to facilitate the learning process
(Creswell, 1990).
Use - utilizing and/or applying an appropriate process/tool to achieve adesired result.
Agricultural education teacher - a person who provides planned subject matter and learning
experiences to develop knowledge and skills necessary for taking care of plants,
animals, machines, information and domestic and international marketing of
12
agricultural products and to provide practice in making managerial decisions in the
agriculture industry, and to nurture leadership anddemocratic citizenship.
Secondary agriculture education program - subject matter planned for agriculture sciences to
teach seventh to twelfth grade students.
Secondary agriculture environment- an overall set of conditions in existence surrounding the
junior high and senior high school agricultural teaching-learning process.
Vocational agricultural education - education designed to prepare individuals for gainful
employment as semi-skilled or skilled workers or professionals for the agriculture
industry.
Teaching-learning process - the art of planning, organizing and facilitating the delivery and
acquisition of knowledge and skill which leads to the change of behavior, attitudes
and abilities of those involved.
13
CHAPTER n. REVIEW OF LITERATURE
The purpose of this study was to identify perceptions of agricultural education
teachers in the United States of America regarding selected principles of teaching and
learning, the current useselected instructional methods and tools and their effectiveness, and
to develop a model for guiding the selection of teaching-learning strategies in agriculmral
education.
The review of relevant literature to provide a theoretical basis and rationale for this
study was organized under the following subheadings: 1) Teaching-Learning Principles, 2)
Teaching Methods, Techniques and Tools, 3)Teaching Effectiveness, 4) Teacher-Student
Factors in Teaching and Learning, 4) Models for TeachingStrategy, 5) Summary of Review
of the Literature, and 6) Research Questions
Teaching-Learning Principles
Knowledge and understanding of the psychology of learning are basic to
making decisions about and using appropriate instructional strategies and
techniques. Some understanding by the teacher of the conditions that
stimulate learning and how learning takes place is essential if instruction is to
result in a high level of competence achieved ... Teaching is best described as
guiding and directing the learning process such that those who are learners
acquire new knowledge, skills, or attitudes; increase their enthusiasm for
learning; and develop further theirskill as learners (Newcomb et al., 1986, pp.
20-21).
There has been a tremendous attention given to research studies on teaching-learning
principles at the secondary level of instruction. Worsham and Stockton (1986, p. 7) said, "the
most critical issue facing educators today is students' lack of adequate thinking skills for
solving problems and making decisions."
Thirteen principles of teaching and learning which have helped to shed more light on
the process, were stated by Newcombet al. (1986, p. 26-40) as follows: (1) When the subject
matter to be learned possesses meaning, organization, and structure that is clear to students,
learning proceeds more rapidly and is retained longer; (2) Readiness is a prerequisitefor
learning. Subject matter and learningexperiences must be provided that begin where the
learner is; (3) Students must be motivated to learn. Learning activities should be provided
that take into account the wants, needs, interests, and aspirations of students; (4) Students are
motivated through their involvement in setting goals and planning learning activities; (5)
Success is astrong motivating force; (6) Students are motivated when they attempt tasks that
fall in a range of challenge such that success is perceived to be possible but not certain; (7)
When students have knowledge of their learning progress, performance will be superior to
what it would have been without such knowledge; (8) Behaviors that are reinforced
(rewarded) are more likely to be learned; (9) To be most effective, reward (reinforcement)
must follow as immediately as possible the desired behavior and be clearly connected with
that behavior by the student; (10) Directed learning is more effective than undirected
learning. (11) To maximize learning, studentsshould "inquire into" rather than "be
instructed in" the subject matter. Problem-oriented approaches to teaching improve learning;
(12) Students learn what they practice; (13) Supervised practice that is most effective occurs
in a functional educational experience. These principles constitute the foundation for all
phases of the instructional process, the organization and structure of subject matter,
motivation of smdents, appropriate use of reward and reinforcement, and to the selection of
15
Similarly, Tyler (1969, p.65) proposed two general principles to guide teachers in
selecting learning experiences namely(1) for agiven objective to be attained, astudent must
have experiences that give him an opportunity to practice the kind of behavior implied by the
objective. Forexample, if one of the objectives is to develop skill in problem solving, this
cannot be attained unless the learning experiences give thestudent ample opportunity to solve
problems. (2) the learning experiences must besuch that the student obtains satisfactions
from carrying on the kind of behavior implied by the objectives.
In the same vein, Yelon (1996, p. 3) introduced the following ten powerful principles
that excellent teachers should apply to the planning andselection of learning experiences for
learning:
1. Meaninefulness.Motivate students by helping them connect the
topic to be learned to their past, present, and future.
2. Prerequisites. Assess students' level of knowledge and skill
adjust instruction carefully, so students are ready to learn the material
at the next level.
3. Open Communication.Be sure smdents find out what they need to
know so they can focus on what to learn.
4. Oreanized Essential Ideas. Help students focus on and structure the
most important ideas, to be able to leam and recall those ideas.
5. Leamine Aids.Help students use devices to leam quickly and easily.
6. Novelty. Vary the instructional stimuli to keep students' attention.
7. Modeling.Show students how to recall, think, act, and solve problems
so that they are ready to practice.
8. Active Appropriate Practice. Provide practice in recalling, thinking,
performing, and solving problems so that smdents apply and perfect their
learning.
9. Pleasant Conditions and Consequences. Make learning pleasing, so that
students associate comfort with what is learned; and make learning
satisfying, so that smdents keep learning and using what is learned.
10. Consistency.Make objectives, tests, practice, content, and explanation
consistent, so that students will leam what they need and will use what
they have leamed outside of the instructional setting. (Yelon, 1996, p. 3)
16
He advised teachers to gain a basic understanding of these underlying principles and
use them rather than imitate other people's teachingstyle (Yelon, 1996, pp. 3-4).
Teaching Methods, Techniques and Tools
Today's education majors are asking different questions because they
recognize that there are many teaching methods -expository, inquiry,
questioning, discovery, simulation gaming...The old question "Which one
should I use?"has given way to a new one: "Which ones should I use? and for
what purposes?" Education students, who are now exposed to a number of
teaching methods, know that certain methods work best with certain
objectives. (Henson, 1988, p. 89)
Kassem (1992, p. 45) defined teaching techniques as teacher's activities in the class to
involve students in the subject matter, and requires that students participate in learning
activities, share equally with other learners, and react to the learning experience. The teacher
also needs to work with students as a friend, make the learning place more comfortable,
organize his/her lesson plans, and influence students by using different teaching methods.
The teaching goals must be adapted to the needs and interests of learners, while teaching
strategies should be carefully used to improve learning and make the subject matter useful.
According to several studies, these strategies have been found to be significantly related to
smdents' learning achievement.
Learning aids are devices or mechanisms designed to make learning more effective,
efficient, and satisfying, while simplifying and organizing complex content and connecting
new ideas to old ones (Yelon, 1996, p. 131). Furthermore they are built to focus the learners'
attention on what is being taught, ease learning, produce recall, foster transfer, and speed
instruction (p. 132).
17
According to Kahn (1990), educators over thelast decade have shown tremendous
interest and investment in developing new curricula, and reformingexisting curricula, to
promote the development of thinking skills. Dyer and Osborne (1995, p. 260) stated that
students' thinking skills and problem solving abilitiescan be developed by teaching
activities, especially by the selection of an appropriate teaching approach. Henson (1988, p.
9) argued that the teacher's paramount purpose is to help students leam and to give real help.
He suggested three roles for teachers in planning a unit. The first is to "identify some of the
important ideas or concepts that will be developed in the unit and to explain the importance
of this material to the students." The second role is "to givesmdents an opportunity to
include areas within the unit that they think should be studied." Lastly, teachers need to help
in selecting activities necessary for developing an understanding of the unit (Henson, 1988, p.
17).
Newcomb et al. (1986) classified teaching techniques into two groups namely the
group techniques which include discussion, demonstrations, field trips, role playing and
resource people. The individualized techniques include supervised study, experiments and
independent study. Similarly, Henson (1988) calling them "strategies," mentioned others
including lecture, tutoring, inquiry learning, questioning, discovery learning, and simulation
games. Phipps et al. (1988) added teaching facilities, microcomputers and audio-visual aids
to the teaching strategies in secondary agricultural education. Later, Creswell (1990, p. 16)
summarized teaching methodologies into four categories namely instructor-centered,
interactive, individualized, and experimental teaching methods. On the other hand Quina
(1989) conceptualized them as traditional (lecture, recitation, one-on-one sharing, group
18
work, brainstorming, the project method, role playing) and nonverbal methods (the mandala,
transitional objects, other-hand writing, dreams as methods, sensorystimulation, humor as
method, mind maps, visualization), questions as methods (questions and Bloom's Taxonomy,
questions and the teachingof precision, questions as embedded world views), critical
thinking as a method, self-instructional packages, games and puzzles as method, integrative
approaches.
Yelon (1996) strongly advised that teachers vary their teaching techniques in the
classroom when he said.
To gain and keep students' attention, vary your instructional procedures. One
simple thing todo within a lesson is to break up explanations with examples,
demonstrations, practice, and feedback. That's enough variation to keep
anyone alert. Vary your program format across lessons. Sometimes explain the
idea to students;sometimes have leamers discover the concept from examples
you provide; sometimes have students discuss the meaning of a study;
sometimes run a simulation. Have students work individually and in groups.
Use varied techniques within a lecture. Use a series of short lectures followed
by exercises, intersperse short readings or videos in the lecture, and ask
students to briefly discuss a point with a partner or write a reaction to an issue
during a lecture, (p. 154)
He went further, if teachers desire to use an instructional aid as a major teaching tool, they
should focus their students' attention on the aid for most of the lesson. He offered an example
of using an explicit statement of a task's steps as a major teaching tool in describing that task
(p. 138). He argued that using an aid as a major teaching tool is one of the most valuable
techniques in the teaching-learning process. Handouts, transparencies, checklists and
videotapes are good examples of instructional aids, teaching devices or mechanisms
designed to make learning more effective, more efficient,and more satisfying (p. 133).
19
Miller et al. (1996) noted that about 90% of the agricultural education teachers had
computers in their departments but indicated that in teacher training is important to have
more effective utilization of computers in the classroom. Newman et al. (1996) observed that
the World Wide Web (WWW), currently the most exciting, user-friendly, and fastest way to
share information has several merits as an information processing media for teaching and
leaming and provides students with links to related information while improving their
computer abilities. Similarly, Swan (1995)suggested that the effect of high school distance
leaming on students' performance during and after completing relatedcourses would aid in
determining the effectiveness of distance education as an instructional mode to provide a
equal chance of education for learners.
Teaching Effectiveness
Tyler (1969), in his study of different kinds of leaming experiences useful for
attaining various types of objectives made the following observation:
Important changes in human behavior are not produced overnight.
No single leamingexperience has a very profound influence upon
the learner. Changes in ways of thinking, in ftindamental habits, in
major operating concepts, in attitudes, in abiding interests and the
like, develop slowly. It is only after months and years that we are
able to see major educational objectives taking marked concrete
shape. In some respects, educational experiences produce their
effects in the way water dripping upon a stone wears it away. In a
day or a week or a month there is no appreciablechange in the
stone, but over a period of years definite erosion is noted.
Correspondingly, by the cumulating of educational experiences
profound changes are brought about in the learner, (p. 83)
Challenging educators to ask questions such as "What is effective teaching?",
Braskamp et al. (1984, p. 15-16) posited several questions about "How can we define
20
meritous teaching? and Can we measure excellence in teaching?" Questions of this type have
been asked for centuries and they now embody a key issue in the minds of our politicians and
civic leaders as the debate on merit pay for teachers escalates. While admitting that there is
no set of easy answers to these questions, it is noted that research on effective teaching has
primarily focused on teacher characteristics associated with instruction and the relative
effectiveness of the lecture method when compared to alternative modes of instmction.
Quina (1989, p. 3-14) posed a similarquestion, "What is Effective Teaching?" and
tried to provide answers from three different perspectives - teacher definitions of effective
teaching, dictionary definitions of effective teaching, and professional views of effective
teaching. Then he summarized that "the professional interpretation of effective teaching
stresses conscious analysis of cause-and-effect relationships between the behavior of the
teacher and the learner. Ten guiding effective teaching definitions were listed by Quina
(1989, p. 5) through university classes over a period of six years. Quina (1989, p. 5) provided
ten principles to guide effective teaching:
(1) A shared experience between students and the teacher
(2) Imparting information and critical thinking skills to others
(3) Facilitation of the learning process
(4) Practicing the art of analyzing content and distributing the information to others
(5) Guiding students to be critical thinkers and enabling them to evaluate their world
(6) Conveying facts or information through a machine or person
(7) The art of showing, sharing, and exploring aspectsof life
(8) Guidance designed to motivate smdents to use theirfull potential
21
(9) Helping students tofind knowledge within themselves
(10) An art-a performing art
Webster's Dictionary International Version (1986) definition described teaching as
(1) to impart knowledge or skill; give instruction to (2) to provide knowledge of; instruct in
(3) to cause to learn by exampleor experience (4) to advocate; preach.
In the same vein, Kindsvatter et al. (1988, pp. 156-183) offered four principles of
effective teaching based on students' behavior as follows:
(1) time on-task to learn the content
(2) content coverageof the learning task appropriately
(3) performance success of students' completion of their assignments
(4) feedback and praise based on the correcmess, quality and remediation of
students' performance.
He added that the above factors are critical in determining smdent achievement and these
behaviors enable the student to beactively involved with class materials and practice (1988,
p. 156).
Phipps et al. (1988, p. 145) defined "good teaching" or "effective teaching" as "the
direction of the leaming process so that desirable changes of a relatively permanent nature are
brought about within the learner as a result of the instruction." He emphasized that effective
instruction should result in the development of desirable attitudes, interests, ideals,
appreciations, understandings, habits, and abilities, llien he listed eight basic factors of good
teaching as democracy, use, readiness, leaming by doing, motivation, structure, feedback, and
discovery.
22
Odubiyi (1988, p. 48), in her study regarding the level of effectiveness of teaching
methods and tools as perceived by teachers of vocational agriculture in Iowa, generated data
supporting the problem solving approach as the most effective teaching method in secondary
agriculture programs. Demonstration, individualized instruction, lecture-discussion, field
trips, and real-object approaches and tools also ranked highly in the same study while the
following tools and strategies magnetic boards, dramatic skits, opaque projectors, flipcharts,
radio programs, seminars and learningcenters were rarely used or not used at all.
Similarly, another study conducted by Kassem (1992, p. 47) to determine the
effectiveness of teaching methods used in formal education, corroborated Odubiyi's (1988)
findings although both smdies were conducted in the state of Iowa.
Teacher-Student Factors
The relationships between the teaching styles of teachers and the learning styles of
students have been extensively studied by many researchers in the field. Among them,
Henson (1988) pointed out that matching teaching styles with learning styles give a lot of
clues to verifying teaching-learning achievement, and concluded that students who were
matched with their leaming-style preferences had significantly higher reading scores than
their counterparts who were not matched with leaming-style preferences (p. 157). The first
of two approaches suggested by the same author involves matching teachers with students
who have similar personalities while the second involves the selection of teaching methods
that correspond to student leaming styles.
Many studies have revealed that teachers' teaching styles, beliefs, job satisfaction,
age, gender, teaching experiences, incomes, school location, school size and academic
23
background and several other factors affect teaching-learning outcomes. Cox et al. (1996, p.
15) observed that students, irrespectiveof age, gender, socioeconomic status, or intelligence,
leam differently.
Anderson (1994) sUBSsed that student learning achievement may heavily depend on
the teacher's instructional planning, teaching method selection, and on a variety of learning
activities. On the other hand, there is an assumption that students leam with different styles,
speeds, levels of prior knowledge and environments when the subject matter is given by way
of a variety of teaching strategies.
Studies regarding teaching strategies show that teachers' teaching attitudes and their
preferences are critical to deciding their teaching strategies and tools. Carkhuff (1981)
observed that some teachers emphasize the useof question and answer methods while others
use a lot of programmed instruction.
Models for Teaching Strategy
In the past, behaviorists concentrated on the observable behavior produced by
stimulating animals and human subjects under controlled laboratory conditions. This model
remains a powerful tradition and the evidence produced has the merit of all experimental
science models (Shipman, 1985, p. 21). The basic model is stimulus (or input) and response
(or output), followed by the feedback approach in cognitive processing models. However,
modem psychologists and educators have developed more advanced models in interacting,
negotiating, active interpretation of leaming, and refusal to treat learners as passive recipients
because teaching-learning activities arecomplex and comprehensive processes (Shipman,
1985, p. 23-27). Bloom's Taxonomy of Educational Objectives (Bloom et al., 1956) has
24
provided acceptable descriptions of levels of cognitive complexity, from the simple recall
through analysis to evaluation. Shipman (1985, p. 87) introduced the top-down and bottom-
up teaching models comprising a number of stepsincluding the analysis of the task in hand
and breaking it down into parts that can be placed in sequence from simple to complex. This
model has been applied to all levels of academic interaction although Shipman (1985, p. 87)
argued that these linear models are not suitable for some tasks.
According to Ashman et al. (1993, p. 46), classroom instruction involves learning
about tasks and how to perform them, what procedures are necessary for completing those
tasks, and how and when to apply the procedures efficiently. Based on several other models
with due consideration for the complexity of the teaching-leaming process, the Process-Based
Instruction (FBI) model was introduced by Ashman and Conway (1993). As a teaching-
leaming method, FBI includes a number of strategies that focus on teaching students how to
leam and solve problems.
Newcomb et al. (1986)suggested that "thoughtful consideration of the factors
influencing decision making about instruction indicated in a model which reveals two
important ideas" (p. 4). First, it is clear that the five factors, while influencing instructional
strategies and techniques directly, are interrelated and mutually dependent. A second idea
that becomes evident when the five factors influencing decisions about teaching are
considered is that in any particular situation, four of the five factors are relatively fixed (p. 4).
Worsham and Stockton (1986, p.16-19) introduced a model termed "Inclusion
Process," which they believed to be the most useful approach to teaching thinking skills.
Eight steps constitute the model as follows:
25
(1) Analyzing curriculum objectives to determine the categories and levels of thinking
required.
(2) Assessing the learner's cognitive needs with regard to the curriculum objectives.
(3) Developing a list of thinking skills to be taught.
(4) Developing a long-range plan for thesequencing of thinking skills.
(5) Defining each skill.
(6) Listing thesteps involved in applying each skill.
(7) Applying the skill to the curriculum.
(8) Testing forskill application.
This model could be characterized as comprehensive, based on analyzing the curriculum,
focused on student's achievement, based on individual program requirements and the needs
of specific group of learners.
Another model titled "How Instructional Elements Vary Depending on the Type of
BCnowIedge" and proposed by Yelon (1996, p. 279), is depicted in Figure 1. Yelon (1996)
articulated some instmctional elements and teaching principles that teachers can use in
different combinations to create new teaching procedures. In secondary agriculmral
education programs, this model can be applied in terms of accelerating teachers' teaching and
students' leaming effectiveness.
26
Elements
lyES
Skills Facts
of Knowledge
Concepts Principles
I
N
Motivation Why team to do the
skill
Why team to recall
the facts
Why team to identify
examples of concepts
Why leam to predict and explain
new cases using principles
R
0
Objective Do the skill Recall the £u:ts Identify new examples Predict and explain new cases
using principles
U
c
Overview Major skill steps Major headings of
fact outline
Key attributes from
definition
Major variables and
relationship
1
0
N
Review Review snbskills
ideas
Review concepts
and facts
Review concepts in
definition
Review concepts in
definition
1
0
N
Agenda Explanation, demonstratioiu and inactice
C
O
R
E
Explanation
Demonstration
Practice
Feedback and
Tell steps of the skill Tell facts in an Tell definition.
Organized vivid way examples and
and substantiate nonexamples
Show how to do the Show how to recall Show how to identify
skill the facts examples
Do the skill Recall die facts Identify new examples
Use the skill
checklist
Check the fact
outline
Check the attributes
Tell definition, evidence
showing relationship
Show how to predict
and explain new cases
Predict and explain new
cases
Check the variables and
relationship
C
0
N
C
L
U
s
1
o
N
Summary
Integration
Objective
Motivation
Test
Major skill steps
Next skill
Do theskill
Why do the skill
Do the skill
Major headings of Key attributes fhim Variables and relationship
fact outline
Next ideas
Recall the facts
Recall the facts
Recall the facts
definition
Next ideas
Identify new examples
of the concept
Identify new examples
Next ideas
Predict and explain new cases
using principles
Predict and explain new cases
using principles
Predict and explain new cases
Figure 1. How instructional elements vary depending on the type of knowledge
(Yelon, 1996, p. 279).
Suimnary
The review of the literature has provided a background and rationale for studying the
teaching-learning principles, teaching methods, techniques and tools, teaching effectiveness,
teacher-student variables in teaching and learning, and models for teaching strategies. It also
27
provides an understanding of the principles and concepts of teaching and learning, and
instructional strategies and effectiveness in secondary agricultural education.
The literature suggested a variety of teaching-learning principles that provide various
aspects of teaching approaches including teaching methods, techniques and tools. These
strategies are devicesor mechanisms designed to make learning more effective,efficient and
satisfying. The newly introduced teaching tools are the World Wide Web, distance education
and computer applications including software.
The review of literature also revealed that effective teaching strategies are needed in
secondary agriculture education programs. Limited studies have been conducted on this topic
in agricultural at the national level. Teacher-student factors in the teaching-learning
environment have been studied extensively and results have suggested that these factors have
influenced student leaming outcomes.
Models for teaching were noted in the literature review, but no systematic and
detailed model has been developed focused on the process of selecting teaching
strategies/tools in agricultural education.
The issues in this literature review provided the basis for asking several research
questions.
Research Questions
This study has been guided by the following research questions:
1. What are the demographic characteristics of teachers in secondary agricultural
education program in the United States?
2. What perceptions do agricultural education teachers have regarding selected
28
teaching-learning principles?
3. To what extent dosecondary agricultural education teachers use an array of
teaching methods, techniques and tools?
4. What are the perceptions of secondary agricultural teachers about the
effectiveness of selected teaching methods, techniques and tools?
5. Are there any significant differences among teacher perceptions of teaching-
learning principles, teaching methods, techniques and tools when grouped by
related demographic factors?
6. What"model" can be evolved from the study to guide the process of selection of
teaching-leaming strategies for secondary agriculture education programs?
29
CHAPTER m. METHODS AND PROCEDURES
The primary purpose of this study was to determine the perceptions of agricultural
education teachers regarding selected principles of teaching and leaming, identify the
teaching methods, tools and techniques used and determine their perceived effectiveness.
Based on the literature review and the results of the study, a model was developed for guiding
the use of selected teaching-learning strategies in secondary agricultural education.
This chapter presents the research design, population and sampling, instrumentation,
data collection, data analysis procedures utilized, limitations and assumptions for the study.
Research Design
This study utilized a descriptivesurvey design focused on the perceptions of
agricultural education teachers about selected teaching-learning principles, teaching
strategies, and their effectiveness. To answer the objectiveness posited in this study, relevant
data were gathered using a well designed questionnaire which was mailed to a randomly
selected sample of agriculture teachers in the United States of America. The teachers were
teaching agriculmral courses at the ninth to twelfth grade levels in secondary schools. The
study was designed to give information regarding the following characteristics:
1. Demographic information of the teachers
1) years of teaching (1-5, 6-10, 11-15, 16 or more).
2) gender (male, female).
3) final academic degree (high school graduate, bachelors degree, masters
degree and doctoral degree).
30
4) age (20 to 29 years, 30 to 39 years, 40 to 49 years, 50 to 59 years and 60
or more years).
5) days of teaching contract per year (180days or less, 181 to 200 days, 201
to 220 days, 221 to 240days).
6) number of courses taken related teaching and learning.
7) school location (urban, suburban, rural).
8) school size (small, middle, large).
2. Teacher perceptions of selected principles of teaching-learning in secondary
agriculture programs.
3. The methods, techniques and tools used in teaching.
4. Perceived effectiveness of the methods, techniques and tools used in teaching.
5. Development of a model for selecting appropriate teaching-learning strategies in
secondary agriculture education programs.
Population and Sampling
The population for this study consisted of all secondary agricultural instructors in the
United States as listed in the 1996-1997 National Directory of Vocational Agriculture
Teachers. A total of 9,100 teachers made up the population. A sample size of 370 or more
teachers was considered adequate for the study according to "Krejcie and Morgans' Formula-
Table forDetermining SampleSize from a Given Population" (1970). The critical effective
size of the sample was calculated to be 370 or more agriculture teachers in a national study.
The following formula was used to derive the critical effective samplesize for the
population.
31
S = X^NP(1-P)-d^(N- 1) + X^P(1 -P)
S = required samplesize.
X" = the table value of chi-square for 1 degreeof freedom at the desired
confidence level (3.841).
N = the population size (9.100 agriculture teachers in the United States).
P = the population proportion (assumed to be 0.50 since this would provide
the maximum sample size.
d = the degree of accuracy expressed as a proportion (0.05).
In order to have a reliable representative group of teachers, a proportional stratified
random sampling procedure was utilized to insure that specific subgroups in the population
were represented in the sample in proportion to each state's numbers in the population.
Based on the number of agriculmre education teachers in each state, names of respondents
were randomly drawn by using a computer program. The samplesize was based on number
of agricultural education teachers in each state. An over-sample was drawn to minimize non-
response error. The distribution of respondents in the states covered by this study and the
questionnaire retums are shown in Table 1.
Instrumentation
A survey instrument was developed to identify the agricultural education teachers
perceptions of selected principles of teaching and learning, identify teaching methods/tools
and their perceived effectiveness in secondary agricultural education programs. Four types of
instruments were developed to address the study objectives. The instrument (Appendix C)
consisted of five parts: 1) the first part of the questionnaire was designed to determine
teachers' perceptions of selected principles of teaching and learning, 2) the second part was
to identify the extent of use of selected teaching methods, techniques and tools, 3) the third
part was to identify the perceived effectiveness of the methods, techniques and tools used by
32
Table 1. Distribution of respondents in the states and percentage of questionnaires
returned and analyzed (n=386)
State Questionnaires Number Numbers
sent returned analyzed
Alabama 38 15 14
Alaska 2 1 I
Arizona 14 8 8
Arkansas 28 9 6
California 49 23 16
Colorado 15 6 4
Connecticut 9 7 7
Delaware 8 3 2
Florida 43 13 12
Georgia 24 9 8
Hawaii 5 3 2
Idaho 9 5 4
Illinois 33 19 18
Indiana 22 11 10
Iowa 27 8 7
Kansas 17 9 8
Kentucky 18 12 7
Louisiana 24 12 10
Maine 7 4 4
Maryland 7 3 2
Massachusetts 9 5 3
Michigan 16 8 5
Minnesota 23 11 9
Mississippi 16 7 10
Missouri 33 21 20
Montana 8 4 4
Nebraska 17 9 9
Nevada 6 2 2
New Hampshire 6 3 3
New Jersey 8 2 2
New Mexico 11 7 7
New York 27 13 12
North Carolina 28 10 8
North Dakota 15 7 7
Ohio 36 15 13
Oklahoma 33 14 14
Oregon 17 8 8
33
Table 1. (Continued)
State Questionnaires Number Numbers
sent returned analyzed
Pennsylvania 18 8 6
Rhode Island 3 2 2
South Carolina 14 7 6
South Dakota 9 3 3
Tennessee 22 11 11
Texas 85 39 31
Utah 9 2 2
Vermont 4 2 2
Virginia 22 15 10
Washington 19 6 5
West Virginia 11 3 3
Wisconsin 23 14 13
Wyoming 9 6 6
total 956 (100.0%) 444 (46.5%) 386 (40.4%)
the teachers, and 4) the fourth part was to elicit the demographic and personal background
data on the teachers, and lastly 5) the fifth part was structured to gather comments from
teachers. Items on the first, second and third parts were randomly arranged on the
questionnaire to reduce set response error.
A five-point Likert-type scale which is a technique widely accepted for measurements
of perception and effectiveness (Simonson, 1979) was used in the study. The rationale for
the selection of this research instrument was based upon the review of the literature.
Part I of the questionnaire (Appendix C) contained 22 narrative statements about
selected principles of teaching and learning in the secondary agricultural education
environment. In order to identify selected teaching principles and theories, relevant studies,
guide books and related articles from the literamre were examined. Thirty six principles were
developed by researcher. The instrument (Appendix B) was then subjected to a pilot test and
34
panel, after which fourteen of the principles were dropped because they were rated as being
of least importance and had a low reliability. In this part, a scale rangingfrom 1 to 5 was
selected for use in this smdy: a 1 value indicating strongly disagree, 2 for disagree, 3 for
uncertain, 4 foragree, 5for strongly agree.
In the Part H, of the instrument, 53 teaching methods and tools were developed by the
researcher. Fourteen methods/tools were dropped after the pilot-test and review. This
process left a balance of 39 independent items to measure the extent of use of selected
teaching methods, techniques and tools. Two open-ended items were included for teachers if
they had any other methods, techniques and tools that were not listed on the instrument.
In this part, a scale rangingfrom 1 to 5 andselected: 1 indicating not used, 2 for rarely
used, 3 for sometimes used, 4for frequently used, and5 depicting heavily used.
The third part of the questionnaire composed of 39 items drawn parallel with the
second part, was designed to assess the perceived effectiveness of the teaching methods,
techniques and tools. Similarly, a scale ranging from 1 to 5 was employed, 1 indicating not
effective, 2 for of little effectiveness, 3 forsomewhat effective, 4for effective, and 5 for very
effective (Appendix C).
The fourth part of the questionnaire had 8 questions to obtain demographic
information of the respondents in the following general areas: 1) years of teaching, 2)
gender, 3) final academic degree, 4) age, 5) portion of teaching appointment, 6) number of
taken courses related teaching-learning principles, 7) school location, 8) school size.
The fifth part of the questionnaire allowed for comments by the respondents and their
responses are summarized in Chapter IV.
35
The first draft of the instrument was reviewed by a panel of three agricultural
education experts and eleven doctoral graduatestudents in the Department of Agricultural
Education and Studies at Iowa State University. Members of the validation committee
consisted of three professors in agricultural education, one in Curriculum and Instruction and
other one in Psychology and Counseling. All members of the validation committee were
teaching at the university level and eight of them have taught vocational agriculture at
secondary school level.
Data Collectioii
One thousand copies of the instrument was produced and a copy mailed to each of the
956 selected agricultural education teachers listed in the Agricultural Educators Directory of
1996-1997. The questionnaires were mailed on January 23, 1997. Prior to pursuing this
study, permission was obtained from the Graduate School, Iowa State University Human
Subject Review Committee, and the project was approved (Appendix A). A cover letter of
the instmment (Appendix C) explaining the purpose and importance of the study and a copy
of the statement of confidentiality were included in the packet. The participants were asked
to complete the questionnaires and retum them within two weeks. A code number was given
on the first page or last page of each questionnaire for the purposes of identification and
follow-up of non-respondents.
A follow-up letter (Appendix D) was mailed on February 28, 1997, to all participants
who had not yet returned their questionnaires. As of March 8, 1997, 391 or 40.9% of the
questionnaires had been returned.
36
Data collection was closed by March 28, 1997, with 444 (46.5%) questionnaires
received. However, 386 usable questionnaires were selected and analyzed for the study, as
the remaining 58 were judged unusable because of unanswered or partly answered questions
and wrong address labels. The relevant information on respondents in all states covered is
presented in Table 1.
The differences between early and late responses were tested for, using the Analysis
of Variance (ANOVA) statistical tests. There were no significant differences found between
the two groups.
Coding and Analysis of Data
The following step-by-step procedures constituted methods used in coding and
analyzing the gathered data for thestudy.
1) An identification number was assigned to each respondent by state and school to
determine the participant of that state and the school. Each state and school was assigned a
number.
2) The internal consistency of the instrument for this study was measured by using the
Cronbach's a measure of reliability.
3) Data were analyzed by using the Statistical Package for the Social Sciences for the
Personal Computer (SPSSWIN PC). The statistical procedures used for data analysis in this
study included frequencies, analysis of variance, t-test. Statistical procedures and tests were
conducted using the .05a level of significance. The LeastSignificant Differences (LSD) and
Duncan tests were used to test for the amount of differences in demographic characteristics
when a significant difference was found.
4) SPSS Frequencies of means, percentages and standard deviations were used to
identify the following variables:
a. Teacher's perceptions of principles of teaching-learning.
b. The used methods, techniques and tools.
c. Effectiveness of the used methods, techniques and tools.
d. Teacher's demographic characteristics.
5) SPSS ONEWAY ANALYSIS OF VARIANCE was employed to test the
significant differences in the teacher perceptions of teaching and learning principles, teaching
methods, techniques and tools and their effectiveness utilizing the following variables:
a. Years of teaching,
b. Final academic degree,
c. Age
d. Portion of teaching appointment (days of teaching contract per year)
e. Number of taken courses related teaching-learning principle
f. School location,
g. School size
T-tests were employed to determine the differences in teacher perceptions of teaching
and learning principles, and teaching methods, techniques and tools, and their effectiveness
when compared by gender.
38
Limitations to the Study
1. This study employed the useof descriptive research methodology which may not
produce all of the related functions of secondary agriculmral education teachers' perceptions
of teaching-learning principles, the extent of using methods and tools and their effectiveness.
2. The randomly selected agricultural education teachers in the United States may not
be representative of all the possible perceptions of the teaching-learning principles and the
extent to which the methods, techniques and tools are used and judged to be effective.
Assumptions
1. The collected data reflected the actual perceptions of agricultural education
teachers.
2. Teachers who were selected to participate in this study had obvious experience in
applying the methods, techniques and tools in their teaching.
3. Teachers understood the questions as presented to them on the instrument and
gave appropriate and true responses based on their experience and knowledge.
4. Teachers were knowledgeable about the subject matter under consideration in the
study.
39
CHAPTER IV. FINDINGS
The primary purpose of this study was to identify perceptions of agricultural
education teachers in the United States of America regarding the use of a variety of selected
teaching strategies (methods, tools and techniques), theircurrent use of selected instructional
approaches and their effectiveness. A secondary purpose was to determine the relationship
between the selected variables and to develop a modelfor guiding the selection of
appropriate teaching-learning strategies in secondary agriculmral education program. The
following six objectives were addressed: 1) To identify selected demographiccharacteristics
of agricultural teachers in secondary agriculture programs in the United States; 2) To identify
agricultural education teachers' perceptions regarding selected principles of teaching and
learning in secondary agricultural education programs; 3) To determine the extent of use of
selected teaching methods and tools by teachers of agriculture in secondary agriculture
education programs; 4) To evaluate the effectivenessof selected teaching methods and tools
by secondary agricultural education teachers; 5) To determine the relationship between
selected demographic characteristics of teachers and the perceived principles of teaching -
learning, their use and effectiveness in agricultural education programs; 6) To develop a
model to guide selection of successful teaching-learning strategies in secondary agricultural
education programs.
This chapter presents the results and findings of the smdy. The results and findings
were based on data obtained from a mailed survey questionnaire sent to 386 secondary
agricultural education teachers fi-om 50 states of the USA.
40
Chapter IV presents the resultsobtained firom the statistical analysis of the data. This
chapter was divided into sixsections based on the objectivesof the study. These six sections
were: 1. Reliability Tests,
2. Demographic Characteristics of the Respondents,
3. Perceptions of Secondary Agricultural Education Teachers Regarding
Teaching and Learning Principles,
4. Perceptions of Secondary Agricultural Education Teachers Regarding the
Extent of Use of Selected Teaching Methods and Tools,
5. Perceptions of Secondary Agricultural Education Teachers Regarding
Effectiveness of selected Teaching Methods and Tools.
6. Selected Comments and Opinions from the Respondents
Reliability Tests
To examine the level of intemal consistency and stability of the grouped items in the
instrument, Cronbach's a was used to identify the reliability for the 100 items in the
questionnaire, i.e., secondary agricultural education teachers' perceptions of teaching-
leaming principles, the perceptions of the extent of use of the selected teaching methods,
techniques and tools, and the perceptions of effectiveness of the selected teaching methods
and tools. The a coefficient for the entire instrument was .93. The a coefficient for the
perceptions of teaching-learning principles was .79 and the perceptions of extent of use of
the teaching methods and tools was .88 and the perceptions of effectiveness of the teaching
methods and tools was .89. Results of the analysis of the reliability are presented in Table 2.
Acceptable coefficient a- values were indicated to allow statistical analysis. The acceptable
41
Table 2. Coefficient values for three partsof the instrument.
Instrument section Number of items a- value
Perceptions of teaching-learning principles 22 .79
Perceptions of extent of use of the teaching
methods and tools
39 .88
Perceptions of effectiveness of the teaching
methods and tools
39 .89
Overall instrument 100 .93
a value suggested that teachers understood the questions as presented in the instrument and
gave appropriate and true responses based on their experience and knowledge.
Respondents were asked to indicate the number of years of teaching experience. Data
in Figure 2 reveals the respondents' years of teaching experience. Seventy two (18.7%) of
the 386 respondents had 1 year to 5 years of teaching experience; 57 (14.8%) respondents
had between 6 to 10 years of teaching experience; 69 (17.9%) respondents indicated teaching
experience of 11 to 15 years; 60 respondents (15.5%) had between 16 to 20 years of teaching
experience; 128 respondents (33.2%) indicated over 21 years of teaching experience. Two
hundred fifty seven (66.6%) respondents had teaching experience of more than ten years.
Figure 3 shows respondents' gender to be 339 (87.8%) male and 47 (12.2%) female.
The data in Figure 4 presents the distribution of respondents by their highest level of
education attained. Only 3 respondents (.8%) had a high school diploma as their highest
Demographic Information of the Respondents
42
Over 20 yrs
(33.3%)
1 to 5 yrs
(18.7%)16 to 20 yrs
(15.5%)
6 to 10 yrs
11 to 15 yrs (14.8%)
(17.9%) ^
Figure 2. Distribution of respondents by years of teaching experiences (n=386).
Female
(12.2%)
Male
(87.8%)
Figure 3. Distribution of respondents by gender (n=386).
43
Masters
(52.1%)
Bachelors
(44.3%)
High School Graduate
(0.8%)
Doctoral
(2.8%)
Figure 4. Distribution of respondents by highest educational level attained.
degree; 171 respondents (44.3%) had attained bachelors degree; 201(52.1%) respondents had
masters degree, and 11 (2.8%) respondents out of 386 had obtained the doctoral degree.
Figure 5 presents the distribution of respondents by age. Fifty (13.0%) respondents'
ages were in their twenties; 108 (28.0%) respondents were in their thirties, 148 (38.3%) were
in their forties, and 80 (20.7%) respondents indicated ages in their fifties to sixties.
Figure 6shows the distribution of respondents by days teaching contract per year.
Forty five (11.7%) respondents had contracts for 180 days or less days per year; 106 (27.5%)
respondents had contracts for 181 to 200 days per year; 104 (26.9%) respondents indicated
201 to 220 days in their teaching contracts per year, and 131 (33.9%) respondents of the 386
indicated 221 to 240 days in their teaching contracts per year.
The data in Figure 7 present thedistribution of respondents by courses taken related
to teaching and learning. Eight respondents (2.1%) of the 386 had not taken courses related
44
pl20'
18.4%100
13.0%
30 to 3920 to 29 40 to 49 50 to 59 over
(roup of Age
Figure 5. Distribution of respondents by group of age.
below ISO
Figure 6. Distribution of respondents by days of teaching contract per year.
45
34.7%
120
23.6%
100-
10.4%60
2-1%
None 1 to2 3to4 5to6 over 7
Figure 7. Distribution of respondents by number of courses taken related to
teaching and learning.
to teaching and learning; 40 (10.4%) respondents had taken 1 to 2 courses in teaching and
learning; 134 (34.7%) respondents had taken three to four courses in teaching and learning;
91 (23.6%) respondents had taken 5 to 6 courses in teaching and learning courses, and 113
(29.3%) respondents indicated 7 or more courses taken in teaching and learning.
Data in Figure 8 present the distribution of respondents by school location. Forty
(10.4%) respondents indicated that their school location was in an urban area; 76 (19.7%)
respondents indicated their school was located in a suburban area, and 270(69.9%) of the
386 respondents taught in a rural area. The data in Figure 9 shows the distribution of
respondents by school size. One hundred fifty six (40.4%) of the 386 respondents indicated
that their school size was small; 149 (38.6%) respondents indicated their school was middle
size; and 81 (21.0%) indicated large school size.
46
Rural
(69.9%)
Suburban
(19.7%)
Urban
(10.4%)
Figure 8. Distribution of respondents by school location.
Smaller
(40.4%)
Larger
(21.0%)
Middle size
(38.6%)
Figure 9. Distribution of respondents by school location
47
Perceptions of the Respondents Regarding
Teaching and Learning Principles
Table 3 shows that respondents were asked to rate twenty-two perception statements
dealing with selected teaching and learning principles in secondary agricultural education
programs. The scale used was a 1 to 5 to agreement scale with each of the perception
statements. The scale descriptors were: 1= Strongly Disagree, 2 = Disagree, 3 = Uncertain, 4
= Agree, 5 = Strongly Agree. The mean values were placed in descending order from the
highest score to lowest score foreach statement as shown in Table 3.
Fifteen perception statements regarding selected teaching-learning principles had
means ratings above 4.0. The highest mean score was 4.63 (SD =.58) for the statement,
"Agricultural education teachers recognize that individual differences exist among students."
The second highest mean score was 4.46 (SD = .74) for the statement, "Feedback is
important for student learning." The third highest mean score was 4.44 (SD = .74) for the
statement, 'Teaching strategies are of little importance because students learn well any way."
The fourth ranked mean score was 4.41 (SD = .64) for thestatement, "Agricultural education
teachers use a variety of evaluation procedures in agricultural courses." Similarly, the mean
score for the statement"Agricultural education teachers provide career guidance as necessary
in teaching agricultural science" was 4.40 (SD = .60). Other perception statements which had
means ratings above 4.0 were:"Agricultural education teachers set achievable objectives for
lessons" (mean = 4.30), 'Trulyeffective discipline and classroom management are
inseparable terms" (mean = 4.25), "Agricultural education teachers must be patient and
sympathetic toward smdents" (mean = 4.23),"Agricultural education teachers use
individualized instruction to help learners make decisions" (mean = 4.22), "Agricultural
48
education teachers use student-centered approaches when appropriate" (mean = 4.20),
"Agricultural education teachers connect the new element to be learned with something in
previous experiences" (mean = 4.19), "Agricultural education teachers prepare instructional
plans to provide desirable learningexperiences" (mean = 4.17), "Agricultural education
teachers use a specific interest approach to enhance the learner's motivation" (mean = 4.12),
"Agricultural education teachers develop some proficiency with computers" (mean = 4.07),
"Films that contain professional introductions need no further introduction by the teacher"
(mean = 4.05).
Table 3. Means and standard deviations of perceptions held by the respondents regarding
selected teaching-learning principles in secondary agricultural education programs
(n=386).
Principle statement Mean SD
Agricultural education teachers recognize that 4.63 .58
individual differences exist amongstudents
Feedback is important for student learning. 4.46 .63
Teaching strategies are of little importance 4.44* .74
because students learn well any way.
Agricultural education teachers use a variety of 4.41 .64
evaluation procedures in agriculture classes.
Agricultural education teachers provide 4.40 .60
career guidance as necessary in teaching
agricultural science.
A^cultural education teachers set achievable 4.30 .61
objectives for lessons.
Truly effective discipline and classroom 4.25 .90
management are inseparable terms.
Agriculniral education teachers must be 4.23 .77
patient and sympathetic toward students.
Agricultural education teachers use individualized 4.22 .69
instruction to help learners make decisions.
49
Table_3^_^Continue^
Principle statement Mean SD
Agricultural education teachers use 4.20 .62
smdent-centered approaches when appropriate.
Agriculmral education teachers connect 4.19 .62
the new element to be learned with something
in previous experiences.
Agricultural education teachers prepare 4.17 .68
instructional plans to provide desirable
learning experiences.
Agricultural education teachers use 4.12 .68
a specific interest approach to enhance
the learner's motivation.
Agricultural education teachers develop some 4.07 .63
proficiency with computers.
Films that contain professional introductions 4.05* .87
need no further introduction by the teacher.
Using a computer is not necessary 3.97* 1.08
in teaching and leaming agriculture.
Agricultural education teachers clearly explain 3.96 .74
objectives of lessons to their smdents.
Agricultural education teachers use 3.96 .79
on-farm/agribusiness instruction to deal with
individual problems of students when appropriate.
The way a teacher implements a teaching method 3.80 .87
is more important than which method is selected.
Directed leaming is more effectivethan 3.71 .90
undirected leaming.
Agricultural education teachers understand that 3.70 .95
the student's leamingstyle is related to
the teacher's teaching style.
A student's grades should be based on what 3.66 .97
the student has learned.
Scale: 1 = strongly disagree, 2= disagree, 3 = uncertain, 4= agree, 5 = strongly agree
* converted valuesfrom negative statement to positive statement
50
There were seven perception statements with means ranges from 3.66 to 3.97 which indicated
respondents' tendencies toward agreement. The lowest meanscore was 3.66 (SD = .97) for
the statement, "A student's grades should be based on what the student has learned."
Analysis of variance for the teaching-learning principle
A one way analysis of variance test was applied to identify if significant differences
existed in the level of agreement or disagreement with statements regarding selected
principles of teaching-learning when respondents were grouped by selected demographic
characteristics of teaching experience, gender,academic background, age, days in the
teaching contract per year, number of courses taken related to teaching-learning, school
location, and school size. Duncan and LSD test was utilized to detect of the significant
differences between the groups. The level of significance for all tests was set a priori at .05.
Table 4 reveals that the analysisof variance indicated no significant differences
among the respondents when grouped by teaching experience and analyzed with the
perception variables. Therefore it could be concluded that respondents' teaching experiences
had littie influence on their perceptions regarding the selected teaching-learning principles.
Table 4. Analysis of variance of means/standard deviations regarding perceptions of
teaching-learning principles when grouped by teaching experience (n=386).
Teaching experience n Mean SD F-ratio F-prob.
I to 5 years 72 4.10 .37 .28 .88
6 to 10 years 57 4.15 .27
11 to 15 years 69 4.13 .33
16 to 20 years 60 4.11 .30
21 or more years 128 4.14 .33
Scale; 1 = strongly disagree, 2 = disagree, 3 = uncertain,4 = agree, 5 = strongly agree
51
Table 5 shows that there is no significant difference respondents' perceptions when
grouped by gender and analyzed with the perception statements for the teaching-learning
principles. It implies that respondents' gender had little affect on their perceptions regarding
teaching-learning principles.
Table 5.Gender differences in the perceptions held by the respondents regarding
^^^teachin£Midleaniin££rinci£lesjn^econdar^_a^culture^ro^^]^^
Gender n Mean SD t-value df prob.
Male 339 4.12 .33 -1.51 384 .80
Scale: 1 = strongly disagree, 2 = disagree, 3= uncertain, 4= agree, 5 = stronglyagree
The data in Table6 reveals that there is no significant difference at the .05 level among the
respondents when grouped by educational background and analyzed with the principle
statements. There were significant differences between the high school graduate groups and
the doctoral degree group. It is therefore, concluded that respondents' academic background
had little influence their perceptions regarding teaching-learning principles.
Table 7 reveals data that indicates no significant differences among the respondents'
perception about selected teaching/learning principles when grouped by age and analyzed
Table 6. Analysis of variance of means/standard deviations regarding selected teaching-
learning principles as perceived by teachers when grouped by level of education
(n=386).
Level of education n Mean SD F-ratio F-prob.
High school graduate 3 4.30 .15 .55 .64
Bachelors degree 171 4.13 .34
Masters degree 201 4.13 .31
Doctoral 11 4.04 .26
Scale: 1 = strongly disagree, 2= disagree, 3 = uncertain, 4= agree, 5 ==strongly agree
52
Table 7. Analysis of variance of means/standard deviations regarding perceptions based on
^^^^age^Wi£s^®S2E^i££selectedteachin£andleaniin££nnci£les_(n=38^^
Age group n Mean SD F-ratio F-prob.
20 to 29 years old 50 4.08 .39 .41 .80
30 to 39 years old 106 4.14 .30
40 to 49 years old 148 4.14 .32
50 to 59 years old 71 4.12 .31
60 or over yearsold 9 4.12 .33
Scale: 1 = strongly disagree, 2 =disagree, 3 = uncertain, 4 = agree, 5 =strongly agree
with the principle statements. Therefore it can be concluded that respondents' age had little
affect on their perceptions regarding teaching-learning principles.
Data in Table 8 reveals no significant statistical differences among the respondents
ratings of perceptions on teaching-learning principles when grouped by length of teaching
contract. The mean scores were very similar. It implies that respondent's length of contract
had little influence on perceptions regarding selected teaching-learning principles.
Table 8. Analysis of variance of means/standard deviations based on respondents perceptions
^_^____^^__^___ofteadiing^Ie^nin££rinci£lesjwhen_^grouge£bjH£n^^
Days in teaching contract n Mean SD F-ratio F-prob.
180 days orless 45 4jl 39 Ts ^>0
181 to 200 days 106 4.13 .32
201 to 220 days 104 4.14 .33
221 to 240 days 131 4.12 .30
Scale: 1 = strongly disagree, 2 = disagree, 3 = uncertain, 4 = agree, 5 = strongly agree
Table 9 indicates an analysis of data regarding respondents perceptions of the
teaching/learning principles when grouped by the number of courses focused on
teaching/learning taken by the respondents. The mean scores indicate that there were
significant statistical differences between the group 'no taken courses' (mean = 4.04) and the
53
Table 9. Analysis of variance of means/standard deviations based on respondents perceptions
of teaching/learning principles when grouped by number of courses taken focused on
teaching/learning (n=386).
Teaching-learning courses taken n Mean SD F-ratio F-prob,
None 8 4.04 .23 1.23 .05
1 to 2 courses taken 40 4.07 .25
3 to 4courses taken 134 4.10 .36
5 to 6 courses taken 91 4.16 .28
7 or more taken 113 4.17 .34
Scale: 1 = strongly disagree, 2 = disagree, 3 = uncertain, 4 = agree, 5= strongly agree
group '5 to6 courses taken' (mean = 4.16) and '7 or more taken,' (mean = 4.17) and
between the group '1 to 2 courses taken' (mean = 4.07) and '7 or more taken' (mean = 4.17).
It can therefore be concluded that the number of courses taken focused on teaching /learning
by the respondents had influence on their perceptions regarding selected teaching and
learning principles.
Data in Table 10 shows that an analysis of the data indicated no significant statistical
differences regarding perceptions about teaching and learning when respondents were
grouped by their school location. It implies that the respondents' school location had little
influence on their perceptions regarding selected teaching and leaming principles.
Table 10. Analysis of variance of means/standard deviations based respondents perceptions
of teaching/leaming principles when grouped by school location (n=386).
School location n Mean SD F-ratio F-prob.
Urban 40 4.15 .35 .94 .39
Suburban 76 4.17 .36
Rural 270 4J1 ^86
Scale: 1 = strongly disagree, 2 = disagree, 3 = uncertain, 4 = agree, 5= strongly agree
54
Table 11 reveals an analysis of data regarding the perceptionsof teaching and learning
principles when respondents were grouped by their school size. The mean scores indicated
that there were no significantstatistical differences in the respondents' perceptions about
selected principles when compared by school size. It can therefore be concluded that the
respondents' school size had little influence on their perceptions regarding selected teaching
and learning principles.
Table 11. Analysis of variance of means/standard deviations regarding respondents
^_^__^^^erce£tions_ofteaching/leaniin££rinci£lesjvhen^rou£edb^^
School size n Mean SD F-ratio F-prob.
Smaller 156 4.13 .34 .67 .50
Middle 149 4.11 .31
Larger 81 4.16 .32
Scale: 1 = strongly disagree, 2 =disagree, 3 = uncertain, 4 = agree, 5 = strongly agree
Perceptions of the Respondents Regarding the Use and Effectiveness of
Selected Teaching Methods and Tools
Respondents were asked to respond to a list of 39 methods and tools by using a scale
of 1 to 5 toexpress the extent to which they use this methods and tools and the extent to
which these methods and tools were effective. The scale descriptors were: extent of use
scale: 1 = not used, 2 = rarely used, 3 =sometimes used, 4 = frequently used, 5 = heavily
used, and the effectiveness scale: 1 = not effective, 2 = of little effectiveness, 3= somewhat
effective, 4 = effective, 5 = very effective. It was established a priori that mean ratings would
be derived from the descriptors.
Data in Table 12 reveal the means and standard deviations of the respondents'
perceptions regarding the use of selected teaching methods and tools in secondary
55
agricultural education programs. Those methods and tools perceived to be "heavily used"
and/or "frequently used" by respondents were: demonstrations (mean =4.29), discussion
(mean = 4.26), laboratories (mean = 4.25), projects (mean = 4.25), contests (FFA, etc.) (mean
= 4.04), using real objects (4.04), supervised experience(4.01), problem solving approaches
(mean = 3.89), lecture-discussion (mean = 3.89), chalk board (mean = 3.75), exams (mean =
3.75), lecmre (mean = 3.59) and assignments (mean = 3.54). These methods, techniques and
tools were perceived to be "not used" and/or "rarely used" included: distanceeducation
programs (mean = 1.60), learning contracts (mean = 1.87), Internet (mean = 1.87), and case
studies (mean = 2.40).
The standard deviations were usually larger with the following strategies: Internet (SD
= 1.06), overhead projector (SD =1.15), slides (1.01), case studies (2.40), role play (1.05),
computer-assisted instruction (1.06), learning contract (1.01), exhibits (2.94), computer
software (1.06), television (1.06), mentorship (1.17) and cooperative learning (1.07). These
teaching strategies were identified as "not used or rarely used" by the respondents, except for
cooperative learning(mean = 3.27).
Table 12 shows the means and standard deviations ratings of respondents' perceptions
of the effectiveness of selected teaching methods and tools. Those teaching strategies
perceived to be "very effective" and "effective" were: laboratories (mean = 4.40),
demonstrations (mean = 4.39), contests (mean = 4.24), using real objects (mean = 4.24),
discussion (mean = 4.07), supervised experience (mean = 4.01), problem solving approaches
(mean = 4.00), field trips (mean = 3.92), individualized instruction (mean = 3.91), lecture-
discussion (mean = 3.80), simulation (mean = 3.70) and questioning (mean = 3.63). It
Teaching strategies their use and effectiveness as perceived by

More Related Content

What's hot

Araling Panlipunan 4 Curriculum Guide rev.2016
Araling Panlipunan 4 Curriculum Guide rev.2016Araling Panlipunan 4 Curriculum Guide rev.2016
Araling Panlipunan 4 Curriculum Guide rev.2016Chuckry Maunes
 
Lesson plan english 6 -retelling
Lesson plan english 6 -retelling Lesson plan english 6 -retelling
Lesson plan english 6 -retelling Rophelee Saladaga
 
Proposal project LAPS
Proposal project LAPSProposal project LAPS
Proposal project LAPSjoel tayag
 
Tungkulin sa Sarili sa Panahon ng Pagdadalaga o Pagbibinata 5 elva
Tungkulin sa Sarili sa Panahon ng Pagdadalaga o Pagbibinata 5   elvaTungkulin sa Sarili sa Panahon ng Pagdadalaga o Pagbibinata 5   elva
Tungkulin sa Sarili sa Panahon ng Pagdadalaga o Pagbibinata 5 elva1elvamay
 
Lesson Plan in Science by Emilyn Ragasa
Lesson Plan in Science by Emilyn RagasaLesson Plan in Science by Emilyn Ragasa
Lesson Plan in Science by Emilyn RagasaEmilyn Ragasa
 
Lesson exemplar in science 6
Lesson exemplar in science 6Lesson exemplar in science 6
Lesson exemplar in science 6jaylagasca
 
Lesson exemplar in mathematics GRADE V
Lesson exemplar in mathematics GRADE VLesson exemplar in mathematics GRADE V
Lesson exemplar in mathematics GRADE VReon Zedval
 
Food-Processing-Pickling-Fermentation.pdf
Food-Processing-Pickling-Fermentation.pdfFood-Processing-Pickling-Fermentation.pdf
Food-Processing-Pickling-Fermentation.pdfarletmande
 
k to 12 tle grade 9 Lesson plan, structure of the hair
k to 12 tle grade 9 Lesson plan, structure of the hair k to 12 tle grade 9 Lesson plan, structure of the hair
k to 12 tle grade 9 Lesson plan, structure of the hair teacheraki
 
CLMD4A_FoodProcessingG7_8.pdf
CLMD4A_FoodProcessingG7_8.pdfCLMD4A_FoodProcessingG7_8.pdf
CLMD4A_FoodProcessingG7_8.pdfEvangelineLisa1
 
Self-Directed Learning Module in T.L.E. 10 (Agricultural Crops Production)
Self-Directed Learning Module in T.L.E. 10 (Agricultural Crops Production)Self-Directed Learning Module in T.L.E. 10 (Agricultural Crops Production)
Self-Directed Learning Module in T.L.E. 10 (Agricultural Crops Production)RielSalamputan2
 
Lesson Plan by Larce & Segui Recyclable Materials (Final)
Lesson Plan by Larce & Segui Recyclable Materials (Final)Lesson Plan by Larce & Segui Recyclable Materials (Final)
Lesson Plan by Larce & Segui Recyclable Materials (Final)AileenLarce
 
MODULE-1-FOOD-PROCESSING-GRADE-8.pdf
MODULE-1-FOOD-PROCESSING-GRADE-8.pdfMODULE-1-FOOD-PROCESSING-GRADE-8.pdf
MODULE-1-FOOD-PROCESSING-GRADE-8.pdfCarmelAnneUy
 
K to 12 commercial cooking learning module
K to 12 commercial cooking learning moduleK to 12 commercial cooking learning module
K to 12 commercial cooking learning moduleNoel Tan
 
(1) fontana k to 12 updates and grades 7 -10 new-001
(1) fontana  k to 12 updates and  grades 7 -10 new-001(1) fontana  k to 12 updates and  grades 7 -10 new-001
(1) fontana k to 12 updates and grades 7 -10 new-001Argie242424
 

What's hot (20)

Araling Panlipunan 4 Curriculum Guide rev.2016
Araling Panlipunan 4 Curriculum Guide rev.2016Araling Panlipunan 4 Curriculum Guide rev.2016
Araling Panlipunan 4 Curriculum Guide rev.2016
 
Lesson plan english 6 -retelling
Lesson plan english 6 -retelling Lesson plan english 6 -retelling
Lesson plan english 6 -retelling
 
K to 12 aquaculture learning module
K to 12 aquaculture learning moduleK to 12 aquaculture learning module
K to 12 aquaculture learning module
 
Lesson plan hots-regpala
Lesson plan hots-regpalaLesson plan hots-regpala
Lesson plan hots-regpala
 
Proposal project LAPS
Proposal project LAPSProposal project LAPS
Proposal project LAPS
 
Tungkulin sa Sarili sa Panahon ng Pagdadalaga o Pagbibinata 5 elva
Tungkulin sa Sarili sa Panahon ng Pagdadalaga o Pagbibinata 5   elvaTungkulin sa Sarili sa Panahon ng Pagdadalaga o Pagbibinata 5   elva
Tungkulin sa Sarili sa Panahon ng Pagdadalaga o Pagbibinata 5 elva
 
11. epp tle
11. epp tle11. epp tle
11. epp tle
 
IDP SAMPLE.docx
IDP SAMPLE.docxIDP SAMPLE.docx
IDP SAMPLE.docx
 
Lesson Plan in Science by Emilyn Ragasa
Lesson Plan in Science by Emilyn RagasaLesson Plan in Science by Emilyn Ragasa
Lesson Plan in Science by Emilyn Ragasa
 
Lesson exemplar in science 6
Lesson exemplar in science 6Lesson exemplar in science 6
Lesson exemplar in science 6
 
K to 12 TLE Curriculum Guide for Fish Processing
K to 12 TLE Curriculum Guide for Fish ProcessingK to 12 TLE Curriculum Guide for Fish Processing
K to 12 TLE Curriculum Guide for Fish Processing
 
Lesson exemplar in mathematics GRADE V
Lesson exemplar in mathematics GRADE VLesson exemplar in mathematics GRADE V
Lesson exemplar in mathematics GRADE V
 
Food-Processing-Pickling-Fermentation.pdf
Food-Processing-Pickling-Fermentation.pdfFood-Processing-Pickling-Fermentation.pdf
Food-Processing-Pickling-Fermentation.pdf
 
k to 12 tle grade 9 Lesson plan, structure of the hair
k to 12 tle grade 9 Lesson plan, structure of the hair k to 12 tle grade 9 Lesson plan, structure of the hair
k to 12 tle grade 9 Lesson plan, structure of the hair
 
CLMD4A_FoodProcessingG7_8.pdf
CLMD4A_FoodProcessingG7_8.pdfCLMD4A_FoodProcessingG7_8.pdf
CLMD4A_FoodProcessingG7_8.pdf
 
Self-Directed Learning Module in T.L.E. 10 (Agricultural Crops Production)
Self-Directed Learning Module in T.L.E. 10 (Agricultural Crops Production)Self-Directed Learning Module in T.L.E. 10 (Agricultural Crops Production)
Self-Directed Learning Module in T.L.E. 10 (Agricultural Crops Production)
 
Lesson Plan by Larce & Segui Recyclable Materials (Final)
Lesson Plan by Larce & Segui Recyclable Materials (Final)Lesson Plan by Larce & Segui Recyclable Materials (Final)
Lesson Plan by Larce & Segui Recyclable Materials (Final)
 
MODULE-1-FOOD-PROCESSING-GRADE-8.pdf
MODULE-1-FOOD-PROCESSING-GRADE-8.pdfMODULE-1-FOOD-PROCESSING-GRADE-8.pdf
MODULE-1-FOOD-PROCESSING-GRADE-8.pdf
 
K to 12 commercial cooking learning module
K to 12 commercial cooking learning moduleK to 12 commercial cooking learning module
K to 12 commercial cooking learning module
 
(1) fontana k to 12 updates and grades 7 -10 new-001
(1) fontana  k to 12 updates and  grades 7 -10 new-001(1) fontana  k to 12 updates and  grades 7 -10 new-001
(1) fontana k to 12 updates and grades 7 -10 new-001
 

Similar to Teaching strategies their use and effectiveness as perceived by

EDU 710 Lit Rev Outline #2
EDU 710 Lit Rev Outline #2EDU 710 Lit Rev Outline #2
EDU 710 Lit Rev Outline #2Brandy Shelton
 
Faheem, shima mohamed successful use of science process skills nftej v25...
Faheem, shima mohamed successful use of science process skills nftej v25...Faheem, shima mohamed successful use of science process skills nftej v25...
Faheem, shima mohamed successful use of science process skills nftej v25...William Kritsonis
 
A Quasi-Experimental Comparison Of Spreadsheet- And Classroom-Based Statistic...
A Quasi-Experimental Comparison Of Spreadsheet- And Classroom-Based Statistic...A Quasi-Experimental Comparison Of Spreadsheet- And Classroom-Based Statistic...
A Quasi-Experimental Comparison Of Spreadsheet- And Classroom-Based Statistic...Karla Adamson
 
Running head SCIENCE AND HEALTH MINI-LESSON PLAN1SCIENCE AND.docx
Running head SCIENCE AND HEALTH MINI-LESSON PLAN1SCIENCE AND.docxRunning head SCIENCE AND HEALTH MINI-LESSON PLAN1SCIENCE AND.docx
Running head SCIENCE AND HEALTH MINI-LESSON PLAN1SCIENCE AND.docxjeanettehully
 
Sanders shauna annotated_bibliography
Sanders shauna annotated_bibliographySanders shauna annotated_bibliography
Sanders shauna annotated_bibliographyShauna Sanders
 
KLSmithVitaeOct15
KLSmithVitaeOct15KLSmithVitaeOct15
KLSmithVitaeOct15Kasee Smith
 
OECD presentation - An evidence-informed education Empowering schools and pol...
OECD presentation - An evidence-informed education Empowering schools and pol...OECD presentation - An evidence-informed education Empowering schools and pol...
OECD presentation - An evidence-informed education Empowering schools and pol...EduSkills OECD
 
Secondary Analysis Of Qualitative Data
Secondary Analysis Of Qualitative DataSecondary Analysis Of Qualitative Data
Secondary Analysis Of Qualitative DataDeborah Gastineau
 
Vol 15 No 2 - February 2016
Vol 15 No 2 - February 2016Vol 15 No 2 - February 2016
Vol 15 No 2 - February 2016ijlterorg
 
Student perspectives on formative feedback: an exploratory comparative study
Student perspectives on formative feedback: an exploratory comparative studyStudent perspectives on formative feedback: an exploratory comparative study
Student perspectives on formative feedback: an exploratory comparative studymcjssfs2
 
Student Response Systems Presentation Final
Student Response Systems Presentation FinalStudent Response Systems Presentation Final
Student Response Systems Presentation FinalSue Miller
 
GROUP-8-3A1-FINAL-PAPER____.docx
GROUP-8-3A1-FINAL-PAPER____.docxGROUP-8-3A1-FINAL-PAPER____.docx
GROUP-8-3A1-FINAL-PAPER____.docxJohnMarkPentinio
 
Effective teaching in clinical simulation development of the student percepti...
Effective teaching in clinical simulation development of the student percepti...Effective teaching in clinical simulation development of the student percepti...
Effective teaching in clinical simulation development of the student percepti...경인 정
 

Similar to Teaching strategies their use and effectiveness as perceived by (20)

EDU 710 Lit Rev Outline #2
EDU 710 Lit Rev Outline #2EDU 710 Lit Rev Outline #2
EDU 710 Lit Rev Outline #2
 
Faheem, shima mohamed successful use of science process skills nftej v25...
Faheem, shima mohamed successful use of science process skills nftej v25...Faheem, shima mohamed successful use of science process skills nftej v25...
Faheem, shima mohamed successful use of science process skills nftej v25...
 
A Quasi-Experimental Comparison Of Spreadsheet- And Classroom-Based Statistic...
A Quasi-Experimental Comparison Of Spreadsheet- And Classroom-Based Statistic...A Quasi-Experimental Comparison Of Spreadsheet- And Classroom-Based Statistic...
A Quasi-Experimental Comparison Of Spreadsheet- And Classroom-Based Statistic...
 
Running head SCIENCE AND HEALTH MINI-LESSON PLAN1SCIENCE AND.docx
Running head SCIENCE AND HEALTH MINI-LESSON PLAN1SCIENCE AND.docxRunning head SCIENCE AND HEALTH MINI-LESSON PLAN1SCIENCE AND.docx
Running head SCIENCE AND HEALTH MINI-LESSON PLAN1SCIENCE AND.docx
 
Sanders shauna annotated_bibliography
Sanders shauna annotated_bibliographySanders shauna annotated_bibliography
Sanders shauna annotated_bibliography
 
LAMAO ELEM.pptx
LAMAO ELEM.pptxLAMAO ELEM.pptx
LAMAO ELEM.pptx
 
KLSmithVitaeOct15
KLSmithVitaeOct15KLSmithVitaeOct15
KLSmithVitaeOct15
 
OECD presentation - An evidence-informed education Empowering schools and pol...
OECD presentation - An evidence-informed education Empowering schools and pol...OECD presentation - An evidence-informed education Empowering schools and pol...
OECD presentation - An evidence-informed education Empowering schools and pol...
 
Presentation (1)
Presentation (1)Presentation (1)
Presentation (1)
 
Presentation (1)
Presentation (1)Presentation (1)
Presentation (1)
 
Secondary Analysis Of Qualitative Data
Secondary Analysis Of Qualitative DataSecondary Analysis Of Qualitative Data
Secondary Analysis Of Qualitative Data
 
ICESD Conference Paper 26
ICESD Conference Paper 26ICESD Conference Paper 26
ICESD Conference Paper 26
 
Vol 15 No 2 - February 2016
Vol 15 No 2 - February 2016Vol 15 No 2 - February 2016
Vol 15 No 2 - February 2016
 
Student perspectives on formative feedback: an exploratory comparative study
Student perspectives on formative feedback: an exploratory comparative studyStudent perspectives on formative feedback: an exploratory comparative study
Student perspectives on formative feedback: an exploratory comparative study
 
Chapter three
Chapter threeChapter three
Chapter three
 
Chapter three
Chapter threeChapter three
Chapter three
 
Student Response Systems Presentation Final
Student Response Systems Presentation FinalStudent Response Systems Presentation Final
Student Response Systems Presentation Final
 
Jenest poster
Jenest posterJenest poster
Jenest poster
 
GROUP-8-3A1-FINAL-PAPER____.docx
GROUP-8-3A1-FINAL-PAPER____.docxGROUP-8-3A1-FINAL-PAPER____.docx
GROUP-8-3A1-FINAL-PAPER____.docx
 
Effective teaching in clinical simulation development of the student percepti...
Effective teaching in clinical simulation development of the student percepti...Effective teaching in clinical simulation development of the student percepti...
Effective teaching in clinical simulation development of the student percepti...
 

Recently uploaded

Disha NEET Physics Guide for classes 11 and 12.pdf
Disha NEET Physics Guide for classes 11 and 12.pdfDisha NEET Physics Guide for classes 11 and 12.pdf
Disha NEET Physics Guide for classes 11 and 12.pdfchloefrazer622
 
Advanced Views - Calendar View in Odoo 17
Advanced Views - Calendar View in Odoo 17Advanced Views - Calendar View in Odoo 17
Advanced Views - Calendar View in Odoo 17Celine George
 
Unit-IV- Pharma. Marketing Channels.pptx
Unit-IV- Pharma. Marketing Channels.pptxUnit-IV- Pharma. Marketing Channels.pptx
Unit-IV- Pharma. Marketing Channels.pptxVishalSingh1417
 
9548086042 for call girls in Indira Nagar with room service
9548086042  for call girls in Indira Nagar  with room service9548086042  for call girls in Indira Nagar  with room service
9548086042 for call girls in Indira Nagar with room servicediscovermytutordmt
 
Interactive Powerpoint_How to Master effective communication
Interactive Powerpoint_How to Master effective communicationInteractive Powerpoint_How to Master effective communication
Interactive Powerpoint_How to Master effective communicationnomboosow
 
Grant Readiness 101 TechSoup and Remy Consulting
Grant Readiness 101 TechSoup and Remy ConsultingGrant Readiness 101 TechSoup and Remy Consulting
Grant Readiness 101 TechSoup and Remy ConsultingTechSoup
 
The Most Excellent Way | 1 Corinthians 13
The Most Excellent Way | 1 Corinthians 13The Most Excellent Way | 1 Corinthians 13
The Most Excellent Way | 1 Corinthians 13Steve Thomason
 
Russian Escort Service in Delhi 11k Hotel Foreigner Russian Call Girls in Delhi
Russian Escort Service in Delhi 11k Hotel Foreigner Russian Call Girls in DelhiRussian Escort Service in Delhi 11k Hotel Foreigner Russian Call Girls in Delhi
Russian Escort Service in Delhi 11k Hotel Foreigner Russian Call Girls in Delhikauryashika82
 
Student login on Anyboli platform.helpin
Student login on Anyboli platform.helpinStudent login on Anyboli platform.helpin
Student login on Anyboli platform.helpinRaunakKeshri1
 
Ecosystem Interactions Class Discussion Presentation in Blue Green Lined Styl...
Ecosystem Interactions Class Discussion Presentation in Blue Green Lined Styl...Ecosystem Interactions Class Discussion Presentation in Blue Green Lined Styl...
Ecosystem Interactions Class Discussion Presentation in Blue Green Lined Styl...fonyou31
 
IGNOU MSCCFT and PGDCFT Exam Question Pattern: MCFT003 Counselling and Family...
IGNOU MSCCFT and PGDCFT Exam Question Pattern: MCFT003 Counselling and Family...IGNOU MSCCFT and PGDCFT Exam Question Pattern: MCFT003 Counselling and Family...
IGNOU MSCCFT and PGDCFT Exam Question Pattern: MCFT003 Counselling and Family...PsychoTech Services
 
Measures of Central Tendency: Mean, Median and Mode
Measures of Central Tendency: Mean, Median and ModeMeasures of Central Tendency: Mean, Median and Mode
Measures of Central Tendency: Mean, Median and ModeThiyagu K
 
APM Welcome, APM North West Network Conference, Synergies Across Sectors
APM Welcome, APM North West Network Conference, Synergies Across SectorsAPM Welcome, APM North West Network Conference, Synergies Across Sectors
APM Welcome, APM North West Network Conference, Synergies Across SectorsAssociation for Project Management
 
Presentation by Andreas Schleicher Tackling the School Absenteeism Crisis 30 ...
Presentation by Andreas Schleicher Tackling the School Absenteeism Crisis 30 ...Presentation by Andreas Schleicher Tackling the School Absenteeism Crisis 30 ...
Presentation by Andreas Schleicher Tackling the School Absenteeism Crisis 30 ...EduSkills OECD
 
Class 11th Physics NEET formula sheet pdf
Class 11th Physics NEET formula sheet pdfClass 11th Physics NEET formula sheet pdf
Class 11th Physics NEET formula sheet pdfAyushMahapatra5
 
Sanyam Choudhary Chemistry practical.pdf
Sanyam Choudhary Chemistry practical.pdfSanyam Choudhary Chemistry practical.pdf
Sanyam Choudhary Chemistry practical.pdfsanyamsingh5019
 
BAG TECHNIQUE Bag technique-a tool making use of public health bag through wh...
BAG TECHNIQUE Bag technique-a tool making use of public health bag through wh...BAG TECHNIQUE Bag technique-a tool making use of public health bag through wh...
BAG TECHNIQUE Bag technique-a tool making use of public health bag through wh...Sapna Thakur
 
Beyond the EU: DORA and NIS 2 Directive's Global Impact
Beyond the EU: DORA and NIS 2 Directive's Global ImpactBeyond the EU: DORA and NIS 2 Directive's Global Impact
Beyond the EU: DORA and NIS 2 Directive's Global ImpactPECB
 

Recently uploaded (20)

Disha NEET Physics Guide for classes 11 and 12.pdf
Disha NEET Physics Guide for classes 11 and 12.pdfDisha NEET Physics Guide for classes 11 and 12.pdf
Disha NEET Physics Guide for classes 11 and 12.pdf
 
Advanced Views - Calendar View in Odoo 17
Advanced Views - Calendar View in Odoo 17Advanced Views - Calendar View in Odoo 17
Advanced Views - Calendar View in Odoo 17
 
Unit-IV- Pharma. Marketing Channels.pptx
Unit-IV- Pharma. Marketing Channels.pptxUnit-IV- Pharma. Marketing Channels.pptx
Unit-IV- Pharma. Marketing Channels.pptx
 
9548086042 for call girls in Indira Nagar with room service
9548086042  for call girls in Indira Nagar  with room service9548086042  for call girls in Indira Nagar  with room service
9548086042 for call girls in Indira Nagar with room service
 
Interactive Powerpoint_How to Master effective communication
Interactive Powerpoint_How to Master effective communicationInteractive Powerpoint_How to Master effective communication
Interactive Powerpoint_How to Master effective communication
 
Grant Readiness 101 TechSoup and Remy Consulting
Grant Readiness 101 TechSoup and Remy ConsultingGrant Readiness 101 TechSoup and Remy Consulting
Grant Readiness 101 TechSoup and Remy Consulting
 
The Most Excellent Way | 1 Corinthians 13
The Most Excellent Way | 1 Corinthians 13The Most Excellent Way | 1 Corinthians 13
The Most Excellent Way | 1 Corinthians 13
 
Russian Escort Service in Delhi 11k Hotel Foreigner Russian Call Girls in Delhi
Russian Escort Service in Delhi 11k Hotel Foreigner Russian Call Girls in DelhiRussian Escort Service in Delhi 11k Hotel Foreigner Russian Call Girls in Delhi
Russian Escort Service in Delhi 11k Hotel Foreigner Russian Call Girls in Delhi
 
Student login on Anyboli platform.helpin
Student login on Anyboli platform.helpinStudent login on Anyboli platform.helpin
Student login on Anyboli platform.helpin
 
Ecosystem Interactions Class Discussion Presentation in Blue Green Lined Styl...
Ecosystem Interactions Class Discussion Presentation in Blue Green Lined Styl...Ecosystem Interactions Class Discussion Presentation in Blue Green Lined Styl...
Ecosystem Interactions Class Discussion Presentation in Blue Green Lined Styl...
 
IGNOU MSCCFT and PGDCFT Exam Question Pattern: MCFT003 Counselling and Family...
IGNOU MSCCFT and PGDCFT Exam Question Pattern: MCFT003 Counselling and Family...IGNOU MSCCFT and PGDCFT Exam Question Pattern: MCFT003 Counselling and Family...
IGNOU MSCCFT and PGDCFT Exam Question Pattern: MCFT003 Counselling and Family...
 
Advance Mobile Application Development class 07
Advance Mobile Application Development class 07Advance Mobile Application Development class 07
Advance Mobile Application Development class 07
 
Measures of Central Tendency: Mean, Median and Mode
Measures of Central Tendency: Mean, Median and ModeMeasures of Central Tendency: Mean, Median and Mode
Measures of Central Tendency: Mean, Median and Mode
 
INDIA QUIZ 2024 RLAC DELHI UNIVERSITY.pptx
INDIA QUIZ 2024 RLAC DELHI UNIVERSITY.pptxINDIA QUIZ 2024 RLAC DELHI UNIVERSITY.pptx
INDIA QUIZ 2024 RLAC DELHI UNIVERSITY.pptx
 
APM Welcome, APM North West Network Conference, Synergies Across Sectors
APM Welcome, APM North West Network Conference, Synergies Across SectorsAPM Welcome, APM North West Network Conference, Synergies Across Sectors
APM Welcome, APM North West Network Conference, Synergies Across Sectors
 
Presentation by Andreas Schleicher Tackling the School Absenteeism Crisis 30 ...
Presentation by Andreas Schleicher Tackling the School Absenteeism Crisis 30 ...Presentation by Andreas Schleicher Tackling the School Absenteeism Crisis 30 ...
Presentation by Andreas Schleicher Tackling the School Absenteeism Crisis 30 ...
 
Class 11th Physics NEET formula sheet pdf
Class 11th Physics NEET formula sheet pdfClass 11th Physics NEET formula sheet pdf
Class 11th Physics NEET formula sheet pdf
 
Sanyam Choudhary Chemistry practical.pdf
Sanyam Choudhary Chemistry practical.pdfSanyam Choudhary Chemistry practical.pdf
Sanyam Choudhary Chemistry practical.pdf
 
BAG TECHNIQUE Bag technique-a tool making use of public health bag through wh...
BAG TECHNIQUE Bag technique-a tool making use of public health bag through wh...BAG TECHNIQUE Bag technique-a tool making use of public health bag through wh...
BAG TECHNIQUE Bag technique-a tool making use of public health bag through wh...
 
Beyond the EU: DORA and NIS 2 Directive's Global Impact
Beyond the EU: DORA and NIS 2 Directive's Global ImpactBeyond the EU: DORA and NIS 2 Directive's Global Impact
Beyond the EU: DORA and NIS 2 Directive's Global Impact
 

Teaching strategies their use and effectiveness as perceived by

  • 1. Retrospective Theses and Dissertations Iowa State University Capstones, Theses and Dissertations 1997 Teaching strategies, their use and effectiveness as perceived by teachers of agriculture: A national study Yun Ho Shinn Iowa State University Follow this and additional works at: https://lib.dr.iastate.edu/rtd Part of the Agricultural Education Commons, Other Education Commons, and the Secondary Education and Teaching Commons This Dissertation is brought to you for free and open access by the Iowa State University Capstones, Theses and Dissertations at Iowa State University Digital Repository. It has been accepted for inclusion in Retrospective Theses and Dissertations by an authorized administrator of Iowa State University Digital Repository. For more information, please contact digirep@iastate.edu. Recommended Citation Shinn, Yun Ho, "Teaching strategies, their use and effectiveness as perceived by teachers of agriculture: A national study" (1997). Retrospective Theses and Dissertations. 12244. https://lib.dr.iastate.edu/rtd/12244
  • 2. INFORMATION TO USERS This manuscript has been reproduced from the microfilm master. UMI films the text directly from the original or copy submitted. Thus, some thesis and dissertation copies are in typewriter &ce, while others may be from anytype of computer printer. The qualify of this reproduction is dependent upon the quality of the copy submitted. Broken or indistinct print, colored or poor quality illustrations and photographs, print bleedthrough, substandard margins, and improperaligmnent can adversely affect reproduction. In the unlikely event that the author did not send UMI a complete manuscript and there are missing pages, these wiU be noted. Also, if unauthorized copyright material had to be removed, a note will mdicate the deletion. Oversize materials (e.g., maps, drawings, charts) are reproduced by sectioning the original, beginning at the upper left-hand comer and continuing from left to right in equal sections with small overlaps. Each original is also photographed in one exposure and is included in reduced form at the back of the book. Photographs included in the original manuscript have been reproduced xerographically in this copy. ICgher quality 6"x 9"black and white photographic prints are available for any photographs or illustrations appearing in this copy for an additional charge. Contact UMI directly to order. UMIA Bell & Howell Information Company 300 North Zed) Road, Ann Aibor NO 48106-1346 USA 313/761-4700 800/521-0600
  • 3.
  • 4. Teaching strategies, their use and effectiveness as perceived by teachers of agriculture: A national study by Yun Ho Shinn A dissertation submitted to the graduatefaculty in partial fulfillment of the requirements for the degree of DOCTOR OF PHILOSOPHY Major Agricultural Education (Agricultural Extension Education) Major Professor: Robert A. Martin Iowa State University Ames, Iowa 1997 Copyright © Yun Ho Shinn, 1997. All rights reserved.
  • 5. DMI Number: 9737757 Copyright 1997 by Shinn, Yun-Ho All rights reserved. UMI Microform 9737757 Copyright 1997, by UMI Company. All rights reserved. This microform edition is protected against wiauthorized copying under Title 17, United States Code. UMI300 North Zeeb Road Ann Artror, MI 48103
  • 6. ii Graduate College Iowa State University This is to certify that the Doctoral dissertation of Yun Ho Shinn has met the dissertation requirements of Iowa State University Major Professor For the Major Program or the Graduate College Signature was redacted for privacy. Signature was redacted for privacy. Signature was redacted for privacy.
  • 7. iii DEDICATION This study is dedicated to my family Father, In Sik Shinn, and Mother, Soon Ja Lee, who first gave me roots and then wings; my three brothers and three sisters; my wife, Ji Suk Kim, who just sacrificed herself to support me to complete this study. Thank GOD, who guides my life and teaches me what is the truth and what I should dofor the people and for the Agriculture.
  • 8. iv TABLE OF CONTENTS LISTOFHGURES LIST OFTABLES ABSTRACT CHAPTER L INTRODUCTION Background Statement of the Problem Purpose and Objectives of the Study Need for the Study Implications and Educational Significance Operational Definitions CHAPTER n.REVIEW OF LITERATURE Teaching-Learning Principles Teaching Methods, Techniques and Tools Teaching Effectiveness Teacher-Student Factors Models for Teaching Strategy Summary Research Questions CHAPTER m. METHODS AND PROCEDURES Research Design Population and Sampling Instrumentation Data Collection Coding and Analysis of Data Limitations to the Smdy Assumptions CHAPTER IV. FINDINGS Reliability Tests Demographic Information of the Respondents Perceptions of the Respondents Regarding Teaching and Learning Principles Analysis of variance for the teaching-learning principles Perceptions of the Respondents Regarding the Use and Effectiveness of Selected Teaching Methods and Tools Perceptions of Secondary Agriculmral Education Teachers Regarding Effectiveness of Selected Teaching Methods and Tools vi vii X 1 1 6 8 9 9 11 13 13 16 19 22 23 26 27 29 29 30 31 35 36 38 38 39 40 41 47 50 54 64
  • 9. V Selected Comments and Opinions from the Respondents 72 CHAPTER V. DISCUSSION 77 Demographic Information 78 Perceptions Regarding theSelected Teaching and Learning Principles 79 Perceptions of the Extent of Use of the Selected TeachingStrategies 80 Perceptions of the Effectiveness of the Selected TeachingMethods and Tools 82 A Model to Guide Selection of Teaching and Learning Strategies 83 CHAPTER VI. SUMMARY, CONCLUSIONS, AND RECOMMENDATIONS 87 Summary 87 Conclusions 92 Recommendations 95 Recommendations for Further Research 96 Implications and Educational Significance of the Study 97 APPENDIX A. HUMAN SUBJECT REVIEW COMMITTEE APPROVALFORM 98 APPEXDIXB. FIRST DRAFT QUESTIONNAIRE WITH A PILOT TEST COVER LETTER 102 APPENDIX C SURVEY INSTRUMENT 110 APPENDIX D. FOLLOW-UP LETTER 117 BIBLIOGRAPHY 119 ACKNOWLEDGMENTS 123
  • 10. vi UST OF FIGURES Figure 1. How instructional elements vary depending on the type of knowledge. 26 Figure 2. Distribution of respondents by years of teaching experiences (n = 386). 42 Figure 3. Distribution of respondents by gender (n = 386). 42 Figure 4. Distribution of respondents by highest educational level attained. 43 Figure 5. Distribution of respondents by group of age. 44 Figure 6. Distribution of respondents by days of teaching contract per year. 44 Figure 7. Distribution of respondents by number of courses taken related to teaching and learning. 45 Figure 8. Distribution of respondents by school location. 46 Figure 9. Distribution of respondents by school size. 46 Figure 10. A model for selectingof teaching/learning strategies in secondary agricultural education programs 84
  • 11. vii LIST OF TABLES Table 1. Distribution of respondents in the states and percentages of questionnaires remmed and analyzed (n = 386) Table 2. Coefficient values for three parts of the instrument. Table 3. Means and standard deviations of perceptions held by the respondents regarding selected teaching-learning principles in secondary agricultural education programs (n = 386). Table4. Analysis of variance of means/standard deviations regarding perceptions of teaching-learning principles when grouped by teaching experience (n=386). Table 5. Gender differences in the perceptions held by the respondents regarding teaching and leaming principles in secondary agricultural education programs (n=386). Table 6. Analysis of variance of means/standard deviations regarding selected teaching- leaming principles as perceived by teachers when grouped by level of education (n=386). Table 7. Analysis of variance of means/standard deviations regarding perceptions based on age groups regarding selected teaching-learning principles (n=386). Table 8. Analysis of variance of means/standard deviations based on respondents perceptions of teaching-leaming principles when grouped by length of contract (n=386) Table 9. Analysis of variance of means/standard deviations based on respondents perceptions of teaching/learning principles when grouped by number of courses taken focused on teaching/learning (n=386). Table 10. Analysis of variance of means/standard deviations based on respondents perceptions of teaching/learning principles when grouped by school location (n=386). Table 11. Analysis of variance of means/standard deviations regarding respondents perceptions of teaching/learning principles when grouped by school size (n=386). Table 12. Means and standard deviations of ratings of respondents regarding the use and effectiveness of selected teaching methods and tools (n=386). 32 41 48 50 51 51 52 52 53 53 54 56
  • 12. viii Table 13. Analysis of variance of means/standard deviations based on respondents' perceptions regarding the extent to which selected methods and tools are used when respondents are grouped by teaching experience (n=386). Table 14. Means and standard deviations based on ratings of male and female respondents' perceived use of selected teaching methods and tools (n=386). Table 15. Analysis of variance of means/standard deviations based on respondents perceptions regarding the extent to which selected methods and tools are used when respondents are grouped by level of education (n=386). Table 16. Analysis of variance of means/standard deviations based on respondents perceptions regarding extent use of selected teaching methods and tools when respondents are grouped by age (n=386). Table 17. Analysis of variance of means/standard deviations based on respondents perceptions regarding the extent to which selected methods and tools are used when respondents are grouped by length of contracts (n=386). Table 18. Analysis of variance of means/standard deviations based on respondents' perceptions regarding theextent to which selected methods and tools are used when respondents are grouped by the number of courses taken focused on teaching and learning (n=386). Table 19. Analysis of variance of means/standard deviations based on respondents perceptions regarding the extent to which selected methods and tools are used when respondents are grouped by school locations (n=386). Table 20. Analysis of variance of means/standard deviations based on respondents' perceptions regarding the extent to which selected methods and tools are used when respondents are grouped by school size (n=386). Table 21. Analysis of variance of means/standard deviations based on respondents' perceptions regarding the effectiveness of selected teaching methods and tools when respondents are grouped by years of teaching experience (n=386). Table 22. Means, standard deviations and t values of female and male respondents perceptions regarding effectiveness of selected teaching methods and tools (n=386). Table 23. Analysis of variance of means/standard deviations based on respondents perceptions regarding the effectiveness of selected teaching methods and tools when respondents are grouped by age (n=386). 57 59 60 60 61 63 64 65 66 67 68
  • 13. ix Table 24. Analysis of variance of means/standard deviations based on respondents perceptions regarding the effectiveness of selected teaching methods and tools when respondents are grouped by length of teaching contract (n=386). Table 25. Analysis of variance of means/standard deviations based on respondents perceptions regarding the effectivenessof selected teaching methods and tools when respondents are grouped by the number of courses taken on teaching and learning (n=386). Table 26. Analysis of variance of means/standard deviations based on respondents perceptions regarding the effectiveness of selected teaching methods and tools when respondents are grouped by school location (n=386). Table 27. Analysis of variance of means/standard deviations based on respondents perceptions regarding the effectiveness of selected teaching methods and tools when respondents are grouped by school size (n=386).
  • 14. X ABSTRACT The primary purpose of this study was to identify perceptions of agricultural education teachers in the United States of America regarding selected principles of teaching and learning, the current use of selected instructional methods and tools and their effectiveness. A secondary purpose was to determine the relationship between the selected variables and to develop a model forguiding successful use of selected teaching and learning strategies in secondary agricultural education programs. Teachers responding to the questionnaire rated most of the principles of teaching/learning fairly high on the scale. The highest rated principles were "individual differences exist among students," "Importance of feedback for student learning," "Importance of teaching strategy," and "Using a variety of evaluation procedures." The lowest rated principles were "a student's grades should be based on what the student has learned," and "the student's learning style is related to the teacher's teaching style," and "directed learning is more effective than undirected learning." The methods and tools used most by teachers included demonstrations, discussions, laboratories, projects, contests, using real objects and supervised experience. The most effective teaching methods and tools included using laboratories, demonstrations, contests, using real objects, discussion and supervised experience. Teacher characteristics influencing the use of selected to perceive of the selected teaching methods included the number of courses taken focusing on teaching and learning, length of teaching contract, school location, school size, academic background and gender. The number of
  • 15. xi courses taken focusing on teaching and learning most influence on the perceived effectiveness of selected teaching methods and tools. A model was developed for selecting appropriate teaching methods and tools in secondary agricultural education programs. There were several important components identified in the model. These components included the type of subject matter, resources available in the school and community, instructional units, skills, facts, concepts, processes, and principles, analysis of the student-teacher activities for the units and using selected teaching-learning principles.
  • 16. I CHAPTER L INTRODUCTION Background Recognizing individual differences of the learners is a basic concept when teachers prepare to teach... It isa fiindamental assumption of strategic teaching and learning that what we choose to teach in the classroom should be an interaction of what we know about the variables of instruction, learning, achievement, and contextual factors. This assumption has driven our quest as individuals and groups to develop an instructional framework... (Jones, 1987: p. v) Rosenshine and Frust (1973) reported that students leam best when the following characteristics are present: (1) variability in teaching methods and materials, (2) interest, (3) clarity, (4) task-oriented behavior, (5) teacher use of structuring comments, (6) student opportunity to leam the material, (7) multiple levels of questions, and (8) enthusiasm. Yelon (1996, p. 3) promoted the ten powerful instructional principles that he believed excellent teachers apply which are: meaningfiilness, prerequisites, open communication, organized essential ideas, learning aids, novelty, modeling, active appropriate practice, pleasant conditions and consequences, and consistency. Monk and Dillion (1995) suggested in the planning and managing for teaching science that the aimsof activities are to help teachers to develop the following: (1) knowledge of the elements of planning and classroom management; (2) skills and strategiesfor organizing and managing activities in lessons; (3) skills and strategies in planning and managingcontinuity between lessons; (4) experience in developing and planning a scheme of work. (p. 53) Furthermore the learner's power to think and solve problems should be a component of a well designed instructional strategy and its effectiveness. The teaching-learning process
  • 17. 2 in secondary education is basically a problem solving activity. According to Dyer and Osborne (1995), the learner's problemsolving ability can be accelerated with the use of appropriate instructional approaches. Agricultural education programs provide a curriculum aimed at helping individuals gain knowledge and skills in agriculture. Moore (1994) studied the historical teaching me±odologies in agricultural education and found three major teaching approaches in agriculture: formal steps, project approach, and problem solving approach. These approaches were used from the late 1800s to 1980s. Newcomb et al. (1986) and Tyler (1969) concluded that the teaching strategy must base learning on inquiry, investigation, and critical study in situations in which genuine purposes, needs, and wants are experienced. For this reason, the role of teachers and their teaching strategies are never ending topics in all educational settings (Martin et al., 1986; Miller et al., 1984). Recently there has been much concern expressed about quality teaching in educational institutions, while industries in the rapidly changing society have been concerned about the well educated person. These concems have led to the issue of teaching strategies and their effectiveness in secondary agriculture education (Kahler, 1995; Martin, 1995; Moore, 1994; Rollins, 1989). As agriculmral educators it is our responsibility to ensure adequate teaching and learning as necessary to meet the changing needs of the industry and the values of society (Melion, 1995, p. 5). According to Carkhuff (1981), teaching is the opportunity to help others to live their lives fully, which means we help to give to our learners' lives through their physical, emotional, intellectual and social growth. Anderson (1994) concluded that student outcomes may heavily depend on the teacher's instructional planning, teaching
  • 18. 3 method selection, and having a variety of learning activities. The Committeeon Agricultural Education (1988) suggested that the teaching strategy becomes the most critical element to educate students in learning activities. Kahler (1995) addressed this issue when he stated: I discovered that it is adifferent world in the agriculture classroom than when I taught agriculture. I found that many of the students were not interested in what I was teaching them. I had to deal with several confrontations wherein students refused to perform tasks that Iasked them to do. Some of my students just sat passively while I taught and waited for the bell so they could leave. Several of the students were visibly troubled and it was apparent that they were in deep thought about what was bothering them. It became clear to me rather quickly that I was not reaching them and that I did not have enough techniques in my professional methods bag to pump up their interest in what I was teaching, (p. 2) Students come from different backgrounds and have varied experiences and abilities. Good teaching is not only dependent on teaching strategies or their effectiveness but It also depends on individual needs and adequacy of the content. Dyer and Osborne (1995) in their study entitied "Effects of Teaching Approach on Achievement of Agricultural Education Students with Varying LearningStyles" proposed that "the selection of an appropriate teaching approach is one of the most important processes to have teaching success and student achievement" (p. 260).Joyce and Weil (1986, in Dyer and Osborne 1995), further stated that "students react differently to different teaching methods, and that the selection of the proper method is critical to the learning style of those being served by the instruction" (p. 260). There is an assumption that students learn with different styles, at different speeds, different levels of prior knowledge and different environments when the subject matter is given by way of a variety of teaching strategies.
  • 19. 4 Phipps and Osbome (1988, p. 146) stressed that the basic factors of good teaching are democratic behavior by teachers, use of the primarilyconcerned knowledge and skills, readiness of a teacher and thestudent, learning by doingof agricultural problems, motivation to leam more about a given topic, well organized structure, feedback as a basis for continued improvement in performance, and discovery teaching and learning. Nwokoukwu (1979) reported that effective teaching is crucial to problem-solving activity in teaching and learning, dissemination of factual knowledge, teacher performance and ultimately to the survival of the society. Manatt et al. (1984)found the variables of effective teaching behaviors are productive teaching techniques, organized structured classroom management, positive interpersonal relations, and professional responsibilities. Newcomb et al. (1986, p. 6) stated that "instruction in agriculture varies depending on the level at which instruction is provided and the persons for whom the instruction is offered." A recent study entitled "Teacher perceptions of agricultural teaching practices and methods for youth and adults in Iowa" (Kassem, 1992) concluded that the most important thing in teaching agriculture is the need for the agriculture teacher to use effective methods and preparation for teaching. Teaching effectiveness has been described in several ways among educational researchers. Bar (1968, p. 23) described effectiveness in two ways. One way to describe effectiveness is in terms of the personal prerequisites to the teaching and learning environment. The other way is to describe effectiveness in terms of professional competency. Moreover, experience, positive attitudes toward teaching, jobsatisfaction, etc., have resulted in teaching effectiveness (Kassem, 1992; Weeks, 1989; Miller et al., 1984; Nwokoukwu, 1979). Drizou (1990) stressed that the most important performance of present teachers is the
  • 20. 5 instructional use of computers. Weeks (1988) noted that the ability to be able to use multi­ media including the computeris urgently required by agricultural educators. Nwokoukwu (1979) stated the comprehensive teacher competencies are"verbal communication," "knowledge of subject matter," "interaction with students and student motivation in the classroom situation," tocreate an environment which will develop the "students' ability," "salable skills," and provide them with "necessary information" which will enable smdents to solve their present and future life problems (pp. 54-56). The ability to communicate effectively with students in a way so as to understand the purpose and objectives of the lesson is one of the main responsibilities of secondary agricultural education teachers. Using the correct teaching method helps any student learn or master knowledge and skills (Odubiyi, 1988). The role of the teacher in strategic teaching builds upon previous definitions of the teacher as manager and instructional leader (Jones et al., 1987). There are as many different kinds of teaching as there are teachers. Many studies have revealed that teaching activities are usually represented by teachers' teaching attitudes and their preferences regarding teaching methods. Carkhuff (1981) stated that "some teachers emphasize the use of question and answer techniques, others use a lot of programmed instruction. Still others utilize the lecture method in the agri-science classroom and using overhead projectors a great deal (p. 90)." In a very real sense, each teacher uses a different teaching method. Weston and Cranton (1986) concluded that programmed instruction is most effective at lower levels of learning, and independent projects are appropriate at higher levels of learning, and these methods are flexible to the differences in learners. Odubiyi (1988, p. 11) summarized the experiential learning methods study by
  • 21. 6 Weston and Cranton (1986) as comprising field/clinical experience, laboratory experience, role playing, simulationsand drill. These methods requirecareful planning and precision at the secondary level. Agriculmre is becoming more business-oriented, specialized, highly technical and internationalized. These changes require a more applied, more efficient and a developmental approach to teaching and learning. New audio-visual materials and programmed software, for example, havechanged teachers' teaching strategies and the learning environment in the classroom. Therefore, forcing students to solvedifferent problems using various methods and procedures creates an environment in which decision making and analytical thinking are critical components of the teaching and learning process. Statement of the I^oblem Without good classroom management, motivation and discipline skills, teachers cannot effectively implement their lesson plans. For teachers to be effective in today's society, they must know how to apply modem technology to improve instruction (Henson, 1988). It is important to note that the literature states that students leam and achieve when competent teachers use well organized instructional strategies, a variety of methods and tools, and use them effectively. Martin (1995) stated that "Agriculmral Education is the scientific study and appropriate application of the principles and methods of teaching and learning as they pertain to the Food, Fiber & Natural Resource system" (p. 2). Kahler (1995, p. 2) posited a question which asked if agricultural teachers really teach students with usefiil methods, based on their needs and the appropriate content for the future? Moore (1994)
  • 22. 7 concluded and recommended in the study entitled 'Teaching Methodologies in Agricultural Education: A Historical Analysis" that: Since agri-science is beingemphasized today perhaps we should reexamine experimentation asa teaching method and place more emphasis on the techniques and procedures involved in experimentation. This approach coupled with the profession's current use of problem solving could lead to the advancement of agriculture teaching... In view of the emerging "information highway" concept, it would be appropriate to explore more fully on-line information sources and computers in the context of teaching methods. More different teaching methods may be needed in the future because schools are moving to 90 minute periods in a semesterized instructional program. In order to maintain student interest, a combination of teaching methods may need to be in a single class period. It would be desirable to reexamine all of the various teaching techniques... (p. 234) Agricultural industries and other services require new skills in order to cope with rapid technological changes. These new skills can be provided especially by using a variety of teaching strategies and effectiveness in secondary vocational agricultural education. There has been much concern expressed about quality teaching in education, while industries in the rapidly changing society have concerns about the well educated person. These concerns have led to a focus on teaching strategies and their effectiveness in the secondary agriculture program (Kahler, 1995; Martin, 1995; Moore, 1994; Rollins, 1989). The central problem of this study was to identify the teaching strategies used by teachers of agriculture, and determine effectiveness in secondary agriculture programs in the United States of America. In previous studies the demographic characteristics of agriculture teachers were significantly related to their teaching process. It was determined that these factors require further analysis.
  • 23. 8 Purpose and Objectives of the Study The primary pmpose of this study was to identify perceptions of agriculmral education teachers in the United States of America regarding selected principles of teaching and learning, the current useof selected instructional methods and tools and their effectiveness. A secondary purpose was to determine the relationship between the selected variables and to develop a model forguiding successful use of selected teaching-learning strategies in the secondary agricultural education program. The following six objectives were addressed: 1. To identify the selected demographic characteristics of agricultural teachers in secondary agriculmral education programs in the United States. 2. To identify agriculture teachers' perceptions regarding the principles of teaching and learning in secondary agricultural education programs. 3. To determine the extent of use of selected teaching methods and tools by teachers of agriculture in secondary agriculture education programs. 4. To evaluate effectiveness of selected teaching methods and tools by secondary agriculmral education teachers. 5. To determine the relationship between the selected demographic characteristics of teachers and the perceived principles of teaching-learning, their use and effectiveness in agricultural education programs. 6. To develop a model to guide selection of appropriate teaching-learning strategies in secondary agriculture education programs.
  • 24. 9 Need for the Study There has been much attention given to the use of selected teaching strategies. However, there has been no known national study in agricultural education which has focused on teaching strategies and tools and their use and effectiveness as perceived by agricultural teachers. The manner in which teachers introduce information and go about the lesson is an important area of inquiry which could lead to the improvement of secondary agricultural education. A study about the use of educational principles and procedures in agriculmral teaching is needed to understand current practice. The effectiveness of teaching methods and tools represents an area of importance in secondary agricultural education. Furthermore, a model forselecting teachingstrategies has not been developed in secondary agriculmral education. Therefore this study was concerned with an examination of teacher perceptions of selected teaching-learning principles, teaching methods and tools that are used and their effectiveness in order to draw conclusions regarding the teaching-learning process and selecting appropriate teachingstrategies. Implications and Educational Significance The significance of this study is related to the present and future of agricultural education and to understanding and improving the use of the principles of teaching-learning, methods and tools and their effectiveness. To improve the quality of teaching and learning that accommodates the needs and preferences of agricultural learners it is necessary to study the educational delivery system (Moore, 1995; Dyeret al., 1995; Kassem, 1992). Some
  • 25. 10 authors (Moore, 1995; Kahler, 1995) have suggested that instruction in secondary agricultural education has been inadequately delivered or did not meet educational needs. Delivering subject matter with appropriate application is one of the most essential activities for teachers (Henson, 1988). A systematicstudy of teaching strategies, and their effectiveness was needed in secondary agriculture education. The Vocational Act of 1917 provided the basis for the development of agricultural education as a unique discipline signifying the perfect union between agriculture and education. Over the years, this unique discipline has evolvedfrom encompassing not just the simple acquisition of technical knowledge, but also the application and evaluation of the scientific principles and methods governing the development of agricultural manpower through well organized teaching processes (Martin, 1995). The results from this study should offer the reconunendations and influences to improve the quality of teaching in agricultural education programs at the secondary school level. This study may enable teachers of secondary agricultural education to learn insight on how to do a better job teaching theirclasses in order to enhance the achievement of their educational goals and objectives. Educational administrators, planners, and decision-makers in secondary schools should find the information generated useful in gaining better insights into the current instructional strategies and how to modify them for greater effectiveness of the teaching-learning process. The recommendations offered by the smdy should go a long way in helping teachers use appropriate instructional techniques to improve student performance and leaming skills.
  • 26. II Operational Definitions The following terms were defined to help fimie the study. Teaching strategy - a complex educational behavior of a teacherin using methods, techniques, tools, discipline and communications in order to achieve goals and /or objectives. Methods - procedures, styles or ways in which a teacher has selected to facilitate the teaching-learning process (Weeks, 1988). Teaching tools - equipment used in facilitating the teaching-leaming process (Creswell, 1990). Technique - a teaching method, skill, style, procedure which a teacher has selected to facilitate the teaching/learning process (Ware, 1989). Perception - a judgment or interpretive ability based on knowledge and insight gained through a teacher's senses, an observation or awareness of some condition, event or concept. Effectiveness - producing the desired result of teaching-leaming through the use of selected methods, techniques and tools. Principles of teaching-learning - tenets used by educators to facilitate the learning process (Creswell, 1990). Use - utilizing and/or applying an appropriate process/tool to achieve adesired result. Agricultural education teacher - a person who provides planned subject matter and learning experiences to develop knowledge and skills necessary for taking care of plants, animals, machines, information and domestic and international marketing of
  • 27. 12 agricultural products and to provide practice in making managerial decisions in the agriculture industry, and to nurture leadership anddemocratic citizenship. Secondary agriculture education program - subject matter planned for agriculture sciences to teach seventh to twelfth grade students. Secondary agriculture environment- an overall set of conditions in existence surrounding the junior high and senior high school agricultural teaching-learning process. Vocational agricultural education - education designed to prepare individuals for gainful employment as semi-skilled or skilled workers or professionals for the agriculture industry. Teaching-learning process - the art of planning, organizing and facilitating the delivery and acquisition of knowledge and skill which leads to the change of behavior, attitudes and abilities of those involved.
  • 28. 13 CHAPTER n. REVIEW OF LITERATURE The purpose of this study was to identify perceptions of agricultural education teachers in the United States of America regarding selected principles of teaching and learning, the current useselected instructional methods and tools and their effectiveness, and to develop a model for guiding the selection of teaching-learning strategies in agriculmral education. The review of relevant literature to provide a theoretical basis and rationale for this study was organized under the following subheadings: 1) Teaching-Learning Principles, 2) Teaching Methods, Techniques and Tools, 3)Teaching Effectiveness, 4) Teacher-Student Factors in Teaching and Learning, 4) Models for TeachingStrategy, 5) Summary of Review of the Literature, and 6) Research Questions Teaching-Learning Principles Knowledge and understanding of the psychology of learning are basic to making decisions about and using appropriate instructional strategies and techniques. Some understanding by the teacher of the conditions that stimulate learning and how learning takes place is essential if instruction is to result in a high level of competence achieved ... Teaching is best described as guiding and directing the learning process such that those who are learners acquire new knowledge, skills, or attitudes; increase their enthusiasm for learning; and develop further theirskill as learners (Newcomb et al., 1986, pp. 20-21). There has been a tremendous attention given to research studies on teaching-learning principles at the secondary level of instruction. Worsham and Stockton (1986, p. 7) said, "the most critical issue facing educators today is students' lack of adequate thinking skills for solving problems and making decisions."
  • 29. Thirteen principles of teaching and learning which have helped to shed more light on the process, were stated by Newcombet al. (1986, p. 26-40) as follows: (1) When the subject matter to be learned possesses meaning, organization, and structure that is clear to students, learning proceeds more rapidly and is retained longer; (2) Readiness is a prerequisitefor learning. Subject matter and learningexperiences must be provided that begin where the learner is; (3) Students must be motivated to learn. Learning activities should be provided that take into account the wants, needs, interests, and aspirations of students; (4) Students are motivated through their involvement in setting goals and planning learning activities; (5) Success is astrong motivating force; (6) Students are motivated when they attempt tasks that fall in a range of challenge such that success is perceived to be possible but not certain; (7) When students have knowledge of their learning progress, performance will be superior to what it would have been without such knowledge; (8) Behaviors that are reinforced (rewarded) are more likely to be learned; (9) To be most effective, reward (reinforcement) must follow as immediately as possible the desired behavior and be clearly connected with that behavior by the student; (10) Directed learning is more effective than undirected learning. (11) To maximize learning, studentsshould "inquire into" rather than "be instructed in" the subject matter. Problem-oriented approaches to teaching improve learning; (12) Students learn what they practice; (13) Supervised practice that is most effective occurs in a functional educational experience. These principles constitute the foundation for all phases of the instructional process, the organization and structure of subject matter, motivation of smdents, appropriate use of reward and reinforcement, and to the selection of
  • 30. 15 Similarly, Tyler (1969, p.65) proposed two general principles to guide teachers in selecting learning experiences namely(1) for agiven objective to be attained, astudent must have experiences that give him an opportunity to practice the kind of behavior implied by the objective. Forexample, if one of the objectives is to develop skill in problem solving, this cannot be attained unless the learning experiences give thestudent ample opportunity to solve problems. (2) the learning experiences must besuch that the student obtains satisfactions from carrying on the kind of behavior implied by the objectives. In the same vein, Yelon (1996, p. 3) introduced the following ten powerful principles that excellent teachers should apply to the planning andselection of learning experiences for learning: 1. Meaninefulness.Motivate students by helping them connect the topic to be learned to their past, present, and future. 2. Prerequisites. Assess students' level of knowledge and skill adjust instruction carefully, so students are ready to learn the material at the next level. 3. Open Communication.Be sure smdents find out what they need to know so they can focus on what to learn. 4. Oreanized Essential Ideas. Help students focus on and structure the most important ideas, to be able to leam and recall those ideas. 5. Leamine Aids.Help students use devices to leam quickly and easily. 6. Novelty. Vary the instructional stimuli to keep students' attention. 7. Modeling.Show students how to recall, think, act, and solve problems so that they are ready to practice. 8. Active Appropriate Practice. Provide practice in recalling, thinking, performing, and solving problems so that smdents apply and perfect their learning. 9. Pleasant Conditions and Consequences. Make learning pleasing, so that students associate comfort with what is learned; and make learning satisfying, so that smdents keep learning and using what is learned. 10. Consistency.Make objectives, tests, practice, content, and explanation consistent, so that students will leam what they need and will use what they have leamed outside of the instructional setting. (Yelon, 1996, p. 3)
  • 31. 16 He advised teachers to gain a basic understanding of these underlying principles and use them rather than imitate other people's teachingstyle (Yelon, 1996, pp. 3-4). Teaching Methods, Techniques and Tools Today's education majors are asking different questions because they recognize that there are many teaching methods -expository, inquiry, questioning, discovery, simulation gaming...The old question "Which one should I use?"has given way to a new one: "Which ones should I use? and for what purposes?" Education students, who are now exposed to a number of teaching methods, know that certain methods work best with certain objectives. (Henson, 1988, p. 89) Kassem (1992, p. 45) defined teaching techniques as teacher's activities in the class to involve students in the subject matter, and requires that students participate in learning activities, share equally with other learners, and react to the learning experience. The teacher also needs to work with students as a friend, make the learning place more comfortable, organize his/her lesson plans, and influence students by using different teaching methods. The teaching goals must be adapted to the needs and interests of learners, while teaching strategies should be carefully used to improve learning and make the subject matter useful. According to several studies, these strategies have been found to be significantly related to smdents' learning achievement. Learning aids are devices or mechanisms designed to make learning more effective, efficient, and satisfying, while simplifying and organizing complex content and connecting new ideas to old ones (Yelon, 1996, p. 131). Furthermore they are built to focus the learners' attention on what is being taught, ease learning, produce recall, foster transfer, and speed instruction (p. 132).
  • 32. 17 According to Kahn (1990), educators over thelast decade have shown tremendous interest and investment in developing new curricula, and reformingexisting curricula, to promote the development of thinking skills. Dyer and Osborne (1995, p. 260) stated that students' thinking skills and problem solving abilitiescan be developed by teaching activities, especially by the selection of an appropriate teaching approach. Henson (1988, p. 9) argued that the teacher's paramount purpose is to help students leam and to give real help. He suggested three roles for teachers in planning a unit. The first is to "identify some of the important ideas or concepts that will be developed in the unit and to explain the importance of this material to the students." The second role is "to givesmdents an opportunity to include areas within the unit that they think should be studied." Lastly, teachers need to help in selecting activities necessary for developing an understanding of the unit (Henson, 1988, p. 17). Newcomb et al. (1986) classified teaching techniques into two groups namely the group techniques which include discussion, demonstrations, field trips, role playing and resource people. The individualized techniques include supervised study, experiments and independent study. Similarly, Henson (1988) calling them "strategies," mentioned others including lecture, tutoring, inquiry learning, questioning, discovery learning, and simulation games. Phipps et al. (1988) added teaching facilities, microcomputers and audio-visual aids to the teaching strategies in secondary agricultural education. Later, Creswell (1990, p. 16) summarized teaching methodologies into four categories namely instructor-centered, interactive, individualized, and experimental teaching methods. On the other hand Quina (1989) conceptualized them as traditional (lecture, recitation, one-on-one sharing, group
  • 33. 18 work, brainstorming, the project method, role playing) and nonverbal methods (the mandala, transitional objects, other-hand writing, dreams as methods, sensorystimulation, humor as method, mind maps, visualization), questions as methods (questions and Bloom's Taxonomy, questions and the teachingof precision, questions as embedded world views), critical thinking as a method, self-instructional packages, games and puzzles as method, integrative approaches. Yelon (1996) strongly advised that teachers vary their teaching techniques in the classroom when he said. To gain and keep students' attention, vary your instructional procedures. One simple thing todo within a lesson is to break up explanations with examples, demonstrations, practice, and feedback. That's enough variation to keep anyone alert. Vary your program format across lessons. Sometimes explain the idea to students;sometimes have leamers discover the concept from examples you provide; sometimes have students discuss the meaning of a study; sometimes run a simulation. Have students work individually and in groups. Use varied techniques within a lecture. Use a series of short lectures followed by exercises, intersperse short readings or videos in the lecture, and ask students to briefly discuss a point with a partner or write a reaction to an issue during a lecture, (p. 154) He went further, if teachers desire to use an instructional aid as a major teaching tool, they should focus their students' attention on the aid for most of the lesson. He offered an example of using an explicit statement of a task's steps as a major teaching tool in describing that task (p. 138). He argued that using an aid as a major teaching tool is one of the most valuable techniques in the teaching-learning process. Handouts, transparencies, checklists and videotapes are good examples of instructional aids, teaching devices or mechanisms designed to make learning more effective, more efficient,and more satisfying (p. 133).
  • 34. 19 Miller et al. (1996) noted that about 90% of the agricultural education teachers had computers in their departments but indicated that in teacher training is important to have more effective utilization of computers in the classroom. Newman et al. (1996) observed that the World Wide Web (WWW), currently the most exciting, user-friendly, and fastest way to share information has several merits as an information processing media for teaching and leaming and provides students with links to related information while improving their computer abilities. Similarly, Swan (1995)suggested that the effect of high school distance leaming on students' performance during and after completing relatedcourses would aid in determining the effectiveness of distance education as an instructional mode to provide a equal chance of education for learners. Teaching Effectiveness Tyler (1969), in his study of different kinds of leaming experiences useful for attaining various types of objectives made the following observation: Important changes in human behavior are not produced overnight. No single leamingexperience has a very profound influence upon the learner. Changes in ways of thinking, in ftindamental habits, in major operating concepts, in attitudes, in abiding interests and the like, develop slowly. It is only after months and years that we are able to see major educational objectives taking marked concrete shape. In some respects, educational experiences produce their effects in the way water dripping upon a stone wears it away. In a day or a week or a month there is no appreciablechange in the stone, but over a period of years definite erosion is noted. Correspondingly, by the cumulating of educational experiences profound changes are brought about in the learner, (p. 83) Challenging educators to ask questions such as "What is effective teaching?", Braskamp et al. (1984, p. 15-16) posited several questions about "How can we define
  • 35. 20 meritous teaching? and Can we measure excellence in teaching?" Questions of this type have been asked for centuries and they now embody a key issue in the minds of our politicians and civic leaders as the debate on merit pay for teachers escalates. While admitting that there is no set of easy answers to these questions, it is noted that research on effective teaching has primarily focused on teacher characteristics associated with instruction and the relative effectiveness of the lecture method when compared to alternative modes of instmction. Quina (1989, p. 3-14) posed a similarquestion, "What is Effective Teaching?" and tried to provide answers from three different perspectives - teacher definitions of effective teaching, dictionary definitions of effective teaching, and professional views of effective teaching. Then he summarized that "the professional interpretation of effective teaching stresses conscious analysis of cause-and-effect relationships between the behavior of the teacher and the learner. Ten guiding effective teaching definitions were listed by Quina (1989, p. 5) through university classes over a period of six years. Quina (1989, p. 5) provided ten principles to guide effective teaching: (1) A shared experience between students and the teacher (2) Imparting information and critical thinking skills to others (3) Facilitation of the learning process (4) Practicing the art of analyzing content and distributing the information to others (5) Guiding students to be critical thinkers and enabling them to evaluate their world (6) Conveying facts or information through a machine or person (7) The art of showing, sharing, and exploring aspectsof life (8) Guidance designed to motivate smdents to use theirfull potential
  • 36. 21 (9) Helping students tofind knowledge within themselves (10) An art-a performing art Webster's Dictionary International Version (1986) definition described teaching as (1) to impart knowledge or skill; give instruction to (2) to provide knowledge of; instruct in (3) to cause to learn by exampleor experience (4) to advocate; preach. In the same vein, Kindsvatter et al. (1988, pp. 156-183) offered four principles of effective teaching based on students' behavior as follows: (1) time on-task to learn the content (2) content coverageof the learning task appropriately (3) performance success of students' completion of their assignments (4) feedback and praise based on the correcmess, quality and remediation of students' performance. He added that the above factors are critical in determining smdent achievement and these behaviors enable the student to beactively involved with class materials and practice (1988, p. 156). Phipps et al. (1988, p. 145) defined "good teaching" or "effective teaching" as "the direction of the leaming process so that desirable changes of a relatively permanent nature are brought about within the learner as a result of the instruction." He emphasized that effective instruction should result in the development of desirable attitudes, interests, ideals, appreciations, understandings, habits, and abilities, llien he listed eight basic factors of good teaching as democracy, use, readiness, leaming by doing, motivation, structure, feedback, and discovery.
  • 37. 22 Odubiyi (1988, p. 48), in her study regarding the level of effectiveness of teaching methods and tools as perceived by teachers of vocational agriculture in Iowa, generated data supporting the problem solving approach as the most effective teaching method in secondary agriculture programs. Demonstration, individualized instruction, lecture-discussion, field trips, and real-object approaches and tools also ranked highly in the same study while the following tools and strategies magnetic boards, dramatic skits, opaque projectors, flipcharts, radio programs, seminars and learningcenters were rarely used or not used at all. Similarly, another study conducted by Kassem (1992, p. 47) to determine the effectiveness of teaching methods used in formal education, corroborated Odubiyi's (1988) findings although both smdies were conducted in the state of Iowa. Teacher-Student Factors The relationships between the teaching styles of teachers and the learning styles of students have been extensively studied by many researchers in the field. Among them, Henson (1988) pointed out that matching teaching styles with learning styles give a lot of clues to verifying teaching-learning achievement, and concluded that students who were matched with their leaming-style preferences had significantly higher reading scores than their counterparts who were not matched with leaming-style preferences (p. 157). The first of two approaches suggested by the same author involves matching teachers with students who have similar personalities while the second involves the selection of teaching methods that correspond to student leaming styles. Many studies have revealed that teachers' teaching styles, beliefs, job satisfaction, age, gender, teaching experiences, incomes, school location, school size and academic
  • 38. 23 background and several other factors affect teaching-learning outcomes. Cox et al. (1996, p. 15) observed that students, irrespectiveof age, gender, socioeconomic status, or intelligence, leam differently. Anderson (1994) sUBSsed that student learning achievement may heavily depend on the teacher's instructional planning, teaching method selection, and on a variety of learning activities. On the other hand, there is an assumption that students leam with different styles, speeds, levels of prior knowledge and environments when the subject matter is given by way of a variety of teaching strategies. Studies regarding teaching strategies show that teachers' teaching attitudes and their preferences are critical to deciding their teaching strategies and tools. Carkhuff (1981) observed that some teachers emphasize the useof question and answer methods while others use a lot of programmed instruction. Models for Teaching Strategy In the past, behaviorists concentrated on the observable behavior produced by stimulating animals and human subjects under controlled laboratory conditions. This model remains a powerful tradition and the evidence produced has the merit of all experimental science models (Shipman, 1985, p. 21). The basic model is stimulus (or input) and response (or output), followed by the feedback approach in cognitive processing models. However, modem psychologists and educators have developed more advanced models in interacting, negotiating, active interpretation of leaming, and refusal to treat learners as passive recipients because teaching-learning activities arecomplex and comprehensive processes (Shipman, 1985, p. 23-27). Bloom's Taxonomy of Educational Objectives (Bloom et al., 1956) has
  • 39. 24 provided acceptable descriptions of levels of cognitive complexity, from the simple recall through analysis to evaluation. Shipman (1985, p. 87) introduced the top-down and bottom- up teaching models comprising a number of stepsincluding the analysis of the task in hand and breaking it down into parts that can be placed in sequence from simple to complex. This model has been applied to all levels of academic interaction although Shipman (1985, p. 87) argued that these linear models are not suitable for some tasks. According to Ashman et al. (1993, p. 46), classroom instruction involves learning about tasks and how to perform them, what procedures are necessary for completing those tasks, and how and when to apply the procedures efficiently. Based on several other models with due consideration for the complexity of the teaching-leaming process, the Process-Based Instruction (FBI) model was introduced by Ashman and Conway (1993). As a teaching- leaming method, FBI includes a number of strategies that focus on teaching students how to leam and solve problems. Newcomb et al. (1986)suggested that "thoughtful consideration of the factors influencing decision making about instruction indicated in a model which reveals two important ideas" (p. 4). First, it is clear that the five factors, while influencing instructional strategies and techniques directly, are interrelated and mutually dependent. A second idea that becomes evident when the five factors influencing decisions about teaching are considered is that in any particular situation, four of the five factors are relatively fixed (p. 4). Worsham and Stockton (1986, p.16-19) introduced a model termed "Inclusion Process," which they believed to be the most useful approach to teaching thinking skills. Eight steps constitute the model as follows:
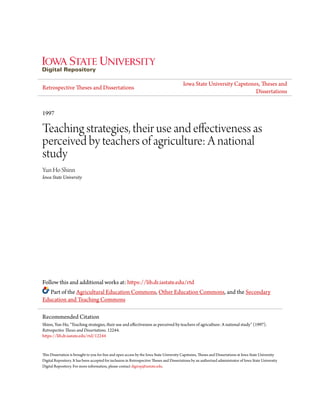
  • 40. 25 (1) Analyzing curriculum objectives to determine the categories and levels of thinking required. (2) Assessing the learner's cognitive needs with regard to the curriculum objectives. (3) Developing a list of thinking skills to be taught. (4) Developing a long-range plan for thesequencing of thinking skills. (5) Defining each skill. (6) Listing thesteps involved in applying each skill. (7) Applying the skill to the curriculum. (8) Testing forskill application. This model could be characterized as comprehensive, based on analyzing the curriculum, focused on student's achievement, based on individual program requirements and the needs of specific group of learners. Another model titled "How Instructional Elements Vary Depending on the Type of BCnowIedge" and proposed by Yelon (1996, p. 279), is depicted in Figure 1. Yelon (1996) articulated some instmctional elements and teaching principles that teachers can use in different combinations to create new teaching procedures. In secondary agriculmral education programs, this model can be applied in terms of accelerating teachers' teaching and students' leaming effectiveness.
  • 41. 26 Elements lyES Skills Facts of Knowledge Concepts Principles I N Motivation Why team to do the skill Why team to recall the facts Why team to identify examples of concepts Why leam to predict and explain new cases using principles R 0 Objective Do the skill Recall the £u:ts Identify new examples Predict and explain new cases using principles U c Overview Major skill steps Major headings of fact outline Key attributes from definition Major variables and relationship 1 0 N Review Review snbskills ideas Review concepts and facts Review concepts in definition Review concepts in definition 1 0 N Agenda Explanation, demonstratioiu and inactice C O R E Explanation Demonstration Practice Feedback and Tell steps of the skill Tell facts in an Tell definition. Organized vivid way examples and and substantiate nonexamples Show how to do the Show how to recall Show how to identify skill the facts examples Do the skill Recall die facts Identify new examples Use the skill checklist Check the fact outline Check the attributes Tell definition, evidence showing relationship Show how to predict and explain new cases Predict and explain new cases Check the variables and relationship C 0 N C L U s 1 o N Summary Integration Objective Motivation Test Major skill steps Next skill Do theskill Why do the skill Do the skill Major headings of Key attributes fhim Variables and relationship fact outline Next ideas Recall the facts Recall the facts Recall the facts definition Next ideas Identify new examples Identify new examples of the concept Identify new examples Next ideas Predict and explain new cases using principles Predict and explain new cases using principles Predict and explain new cases Figure 1. How instructional elements vary depending on the type of knowledge (Yelon, 1996, p. 279). Suimnary The review of the literature has provided a background and rationale for studying the teaching-learning principles, teaching methods, techniques and tools, teaching effectiveness, teacher-student variables in teaching and learning, and models for teaching strategies. It also
  • 42. 27 provides an understanding of the principles and concepts of teaching and learning, and instructional strategies and effectiveness in secondary agricultural education. The literature suggested a variety of teaching-learning principles that provide various aspects of teaching approaches including teaching methods, techniques and tools. These strategies are devicesor mechanisms designed to make learning more effective,efficient and satisfying. The newly introduced teaching tools are the World Wide Web, distance education and computer applications including software. The review of literature also revealed that effective teaching strategies are needed in secondary agriculture education programs. Limited studies have been conducted on this topic in agricultural at the national level. Teacher-student factors in the teaching-learning environment have been studied extensively and results have suggested that these factors have influenced student leaming outcomes. Models for teaching were noted in the literature review, but no systematic and detailed model has been developed focused on the process of selecting teaching strategies/tools in agricultural education. The issues in this literature review provided the basis for asking several research questions. Research Questions This study has been guided by the following research questions: 1. What are the demographic characteristics of teachers in secondary agricultural education program in the United States? 2. What perceptions do agricultural education teachers have regarding selected
  • 43. 28 teaching-learning principles? 3. To what extent dosecondary agricultural education teachers use an array of teaching methods, techniques and tools? 4. What are the perceptions of secondary agricultural teachers about the effectiveness of selected teaching methods, techniques and tools? 5. Are there any significant differences among teacher perceptions of teaching- learning principles, teaching methods, techniques and tools when grouped by related demographic factors? 6. What"model" can be evolved from the study to guide the process of selection of teaching-leaming strategies for secondary agriculture education programs?
  • 44. 29 CHAPTER m. METHODS AND PROCEDURES The primary purpose of this study was to determine the perceptions of agricultural education teachers regarding selected principles of teaching and leaming, identify the teaching methods, tools and techniques used and determine their perceived effectiveness. Based on the literature review and the results of the study, a model was developed for guiding the use of selected teaching-learning strategies in secondary agricultural education. This chapter presents the research design, population and sampling, instrumentation, data collection, data analysis procedures utilized, limitations and assumptions for the study. Research Design This study utilized a descriptivesurvey design focused on the perceptions of agricultural education teachers about selected teaching-learning principles, teaching strategies, and their effectiveness. To answer the objectiveness posited in this study, relevant data were gathered using a well designed questionnaire which was mailed to a randomly selected sample of agriculture teachers in the United States of America. The teachers were teaching agriculmral courses at the ninth to twelfth grade levels in secondary schools. The study was designed to give information regarding the following characteristics: 1. Demographic information of the teachers 1) years of teaching (1-5, 6-10, 11-15, 16 or more). 2) gender (male, female). 3) final academic degree (high school graduate, bachelors degree, masters degree and doctoral degree).
  • 45. 30 4) age (20 to 29 years, 30 to 39 years, 40 to 49 years, 50 to 59 years and 60 or more years). 5) days of teaching contract per year (180days or less, 181 to 200 days, 201 to 220 days, 221 to 240days). 6) number of courses taken related teaching and learning. 7) school location (urban, suburban, rural). 8) school size (small, middle, large). 2. Teacher perceptions of selected principles of teaching-learning in secondary agriculture programs. 3. The methods, techniques and tools used in teaching. 4. Perceived effectiveness of the methods, techniques and tools used in teaching. 5. Development of a model for selecting appropriate teaching-learning strategies in secondary agriculture education programs. Population and Sampling The population for this study consisted of all secondary agricultural instructors in the United States as listed in the 1996-1997 National Directory of Vocational Agriculture Teachers. A total of 9,100 teachers made up the population. A sample size of 370 or more teachers was considered adequate for the study according to "Krejcie and Morgans' Formula- Table forDetermining SampleSize from a Given Population" (1970). The critical effective size of the sample was calculated to be 370 or more agriculture teachers in a national study. The following formula was used to derive the critical effective samplesize for the population.
  • 46. 31 S = X^NP(1-P)-d^(N- 1) + X^P(1 -P) S = required samplesize. X" = the table value of chi-square for 1 degreeof freedom at the desired confidence level (3.841). N = the population size (9.100 agriculture teachers in the United States). P = the population proportion (assumed to be 0.50 since this would provide the maximum sample size. d = the degree of accuracy expressed as a proportion (0.05). In order to have a reliable representative group of teachers, a proportional stratified random sampling procedure was utilized to insure that specific subgroups in the population were represented in the sample in proportion to each state's numbers in the population. Based on the number of agriculmre education teachers in each state, names of respondents were randomly drawn by using a computer program. The samplesize was based on number of agricultural education teachers in each state. An over-sample was drawn to minimize non- response error. The distribution of respondents in the states covered by this study and the questionnaire retums are shown in Table 1. Instrumentation A survey instrument was developed to identify the agricultural education teachers perceptions of selected principles of teaching and learning, identify teaching methods/tools and their perceived effectiveness in secondary agricultural education programs. Four types of instruments were developed to address the study objectives. The instrument (Appendix C) consisted of five parts: 1) the first part of the questionnaire was designed to determine teachers' perceptions of selected principles of teaching and learning, 2) the second part was to identify the extent of use of selected teaching methods, techniques and tools, 3) the third part was to identify the perceived effectiveness of the methods, techniques and tools used by
  • 47. 32 Table 1. Distribution of respondents in the states and percentage of questionnaires returned and analyzed (n=386) State Questionnaires Number Numbers sent returned analyzed Alabama 38 15 14 Alaska 2 1 I Arizona 14 8 8 Arkansas 28 9 6 California 49 23 16 Colorado 15 6 4 Connecticut 9 7 7 Delaware 8 3 2 Florida 43 13 12 Georgia 24 9 8 Hawaii 5 3 2 Idaho 9 5 4 Illinois 33 19 18 Indiana 22 11 10 Iowa 27 8 7 Kansas 17 9 8 Kentucky 18 12 7 Louisiana 24 12 10 Maine 7 4 4 Maryland 7 3 2 Massachusetts 9 5 3 Michigan 16 8 5 Minnesota 23 11 9 Mississippi 16 7 10 Missouri 33 21 20 Montana 8 4 4 Nebraska 17 9 9 Nevada 6 2 2 New Hampshire 6 3 3 New Jersey 8 2 2 New Mexico 11 7 7 New York 27 13 12 North Carolina 28 10 8 North Dakota 15 7 7 Ohio 36 15 13 Oklahoma 33 14 14 Oregon 17 8 8
  • 48. 33 Table 1. (Continued) State Questionnaires Number Numbers sent returned analyzed Pennsylvania 18 8 6 Rhode Island 3 2 2 South Carolina 14 7 6 South Dakota 9 3 3 Tennessee 22 11 11 Texas 85 39 31 Utah 9 2 2 Vermont 4 2 2 Virginia 22 15 10 Washington 19 6 5 West Virginia 11 3 3 Wisconsin 23 14 13 Wyoming 9 6 6 total 956 (100.0%) 444 (46.5%) 386 (40.4%) the teachers, and 4) the fourth part was to elicit the demographic and personal background data on the teachers, and lastly 5) the fifth part was structured to gather comments from teachers. Items on the first, second and third parts were randomly arranged on the questionnaire to reduce set response error. A five-point Likert-type scale which is a technique widely accepted for measurements of perception and effectiveness (Simonson, 1979) was used in the study. The rationale for the selection of this research instrument was based upon the review of the literature. Part I of the questionnaire (Appendix C) contained 22 narrative statements about selected principles of teaching and learning in the secondary agricultural education environment. In order to identify selected teaching principles and theories, relevant studies, guide books and related articles from the literamre were examined. Thirty six principles were developed by researcher. The instrument (Appendix B) was then subjected to a pilot test and
  • 49. 34 panel, after which fourteen of the principles were dropped because they were rated as being of least importance and had a low reliability. In this part, a scale rangingfrom 1 to 5 was selected for use in this smdy: a 1 value indicating strongly disagree, 2 for disagree, 3 for uncertain, 4 foragree, 5for strongly agree. In the Part H, of the instrument, 53 teaching methods and tools were developed by the researcher. Fourteen methods/tools were dropped after the pilot-test and review. This process left a balance of 39 independent items to measure the extent of use of selected teaching methods, techniques and tools. Two open-ended items were included for teachers if they had any other methods, techniques and tools that were not listed on the instrument. In this part, a scale rangingfrom 1 to 5 andselected: 1 indicating not used, 2 for rarely used, 3 for sometimes used, 4for frequently used, and5 depicting heavily used. The third part of the questionnaire composed of 39 items drawn parallel with the second part, was designed to assess the perceived effectiveness of the teaching methods, techniques and tools. Similarly, a scale ranging from 1 to 5 was employed, 1 indicating not effective, 2 for of little effectiveness, 3 forsomewhat effective, 4for effective, and 5 for very effective (Appendix C). The fourth part of the questionnaire had 8 questions to obtain demographic information of the respondents in the following general areas: 1) years of teaching, 2) gender, 3) final academic degree, 4) age, 5) portion of teaching appointment, 6) number of taken courses related teaching-learning principles, 7) school location, 8) school size. The fifth part of the questionnaire allowed for comments by the respondents and their responses are summarized in Chapter IV.
  • 50. 35 The first draft of the instrument was reviewed by a panel of three agricultural education experts and eleven doctoral graduatestudents in the Department of Agricultural Education and Studies at Iowa State University. Members of the validation committee consisted of three professors in agricultural education, one in Curriculum and Instruction and other one in Psychology and Counseling. All members of the validation committee were teaching at the university level and eight of them have taught vocational agriculture at secondary school level. Data Collectioii One thousand copies of the instrument was produced and a copy mailed to each of the 956 selected agricultural education teachers listed in the Agricultural Educators Directory of 1996-1997. The questionnaires were mailed on January 23, 1997. Prior to pursuing this study, permission was obtained from the Graduate School, Iowa State University Human Subject Review Committee, and the project was approved (Appendix A). A cover letter of the instmment (Appendix C) explaining the purpose and importance of the study and a copy of the statement of confidentiality were included in the packet. The participants were asked to complete the questionnaires and retum them within two weeks. A code number was given on the first page or last page of each questionnaire for the purposes of identification and follow-up of non-respondents. A follow-up letter (Appendix D) was mailed on February 28, 1997, to all participants who had not yet returned their questionnaires. As of March 8, 1997, 391 or 40.9% of the questionnaires had been returned.
  • 51. 36 Data collection was closed by March 28, 1997, with 444 (46.5%) questionnaires received. However, 386 usable questionnaires were selected and analyzed for the study, as the remaining 58 were judged unusable because of unanswered or partly answered questions and wrong address labels. The relevant information on respondents in all states covered is presented in Table 1. The differences between early and late responses were tested for, using the Analysis of Variance (ANOVA) statistical tests. There were no significant differences found between the two groups. Coding and Analysis of Data The following step-by-step procedures constituted methods used in coding and analyzing the gathered data for thestudy. 1) An identification number was assigned to each respondent by state and school to determine the participant of that state and the school. Each state and school was assigned a number. 2) The internal consistency of the instrument for this study was measured by using the Cronbach's a measure of reliability. 3) Data were analyzed by using the Statistical Package for the Social Sciences for the Personal Computer (SPSSWIN PC). The statistical procedures used for data analysis in this study included frequencies, analysis of variance, t-test. Statistical procedures and tests were conducted using the .05a level of significance. The LeastSignificant Differences (LSD) and Duncan tests were used to test for the amount of differences in demographic characteristics when a significant difference was found.
  • 52. 4) SPSS Frequencies of means, percentages and standard deviations were used to identify the following variables: a. Teacher's perceptions of principles of teaching-learning. b. The used methods, techniques and tools. c. Effectiveness of the used methods, techniques and tools. d. Teacher's demographic characteristics. 5) SPSS ONEWAY ANALYSIS OF VARIANCE was employed to test the significant differences in the teacher perceptions of teaching and learning principles, teaching methods, techniques and tools and their effectiveness utilizing the following variables: a. Years of teaching, b. Final academic degree, c. Age d. Portion of teaching appointment (days of teaching contract per year) e. Number of taken courses related teaching-learning principle f. School location, g. School size T-tests were employed to determine the differences in teacher perceptions of teaching and learning principles, and teaching methods, techniques and tools, and their effectiveness when compared by gender.
  • 53. 38 Limitations to the Study 1. This study employed the useof descriptive research methodology which may not produce all of the related functions of secondary agriculmral education teachers' perceptions of teaching-learning principles, the extent of using methods and tools and their effectiveness. 2. The randomly selected agricultural education teachers in the United States may not be representative of all the possible perceptions of the teaching-learning principles and the extent to which the methods, techniques and tools are used and judged to be effective. Assumptions 1. The collected data reflected the actual perceptions of agricultural education teachers. 2. Teachers who were selected to participate in this study had obvious experience in applying the methods, techniques and tools in their teaching. 3. Teachers understood the questions as presented to them on the instrument and gave appropriate and true responses based on their experience and knowledge. 4. Teachers were knowledgeable about the subject matter under consideration in the study.
  • 54. 39 CHAPTER IV. FINDINGS The primary purpose of this study was to identify perceptions of agricultural education teachers in the United States of America regarding the use of a variety of selected teaching strategies (methods, tools and techniques), theircurrent use of selected instructional approaches and their effectiveness. A secondary purpose was to determine the relationship between the selected variables and to develop a modelfor guiding the selection of appropriate teaching-learning strategies in secondary agriculmral education program. The following six objectives were addressed: 1) To identify selected demographiccharacteristics of agricultural teachers in secondary agriculture programs in the United States; 2) To identify agricultural education teachers' perceptions regarding selected principles of teaching and learning in secondary agricultural education programs; 3) To determine the extent of use of selected teaching methods and tools by teachers of agriculture in secondary agriculture education programs; 4) To evaluate the effectivenessof selected teaching methods and tools by secondary agricultural education teachers; 5) To determine the relationship between selected demographic characteristics of teachers and the perceived principles of teaching - learning, their use and effectiveness in agricultural education programs; 6) To develop a model to guide selection of successful teaching-learning strategies in secondary agricultural education programs. This chapter presents the results and findings of the smdy. The results and findings were based on data obtained from a mailed survey questionnaire sent to 386 secondary agricultural education teachers fi-om 50 states of the USA.
  • 55. 40 Chapter IV presents the resultsobtained firom the statistical analysis of the data. This chapter was divided into sixsections based on the objectivesof the study. These six sections were: 1. Reliability Tests, 2. Demographic Characteristics of the Respondents, 3. Perceptions of Secondary Agricultural Education Teachers Regarding Teaching and Learning Principles, 4. Perceptions of Secondary Agricultural Education Teachers Regarding the Extent of Use of Selected Teaching Methods and Tools, 5. Perceptions of Secondary Agricultural Education Teachers Regarding Effectiveness of selected Teaching Methods and Tools. 6. Selected Comments and Opinions from the Respondents Reliability Tests To examine the level of intemal consistency and stability of the grouped items in the instrument, Cronbach's a was used to identify the reliability for the 100 items in the questionnaire, i.e., secondary agricultural education teachers' perceptions of teaching- leaming principles, the perceptions of the extent of use of the selected teaching methods, techniques and tools, and the perceptions of effectiveness of the selected teaching methods and tools. The a coefficient for the entire instrument was .93. The a coefficient for the perceptions of teaching-learning principles was .79 and the perceptions of extent of use of the teaching methods and tools was .88 and the perceptions of effectiveness of the teaching methods and tools was .89. Results of the analysis of the reliability are presented in Table 2. Acceptable coefficient a- values were indicated to allow statistical analysis. The acceptable
  • 56. 41 Table 2. Coefficient values for three partsof the instrument. Instrument section Number of items a- value Perceptions of teaching-learning principles 22 .79 Perceptions of extent of use of the teaching methods and tools 39 .88 Perceptions of effectiveness of the teaching methods and tools 39 .89 Overall instrument 100 .93 a value suggested that teachers understood the questions as presented in the instrument and gave appropriate and true responses based on their experience and knowledge. Respondents were asked to indicate the number of years of teaching experience. Data in Figure 2 reveals the respondents' years of teaching experience. Seventy two (18.7%) of the 386 respondents had 1 year to 5 years of teaching experience; 57 (14.8%) respondents had between 6 to 10 years of teaching experience; 69 (17.9%) respondents indicated teaching experience of 11 to 15 years; 60 respondents (15.5%) had between 16 to 20 years of teaching experience; 128 respondents (33.2%) indicated over 21 years of teaching experience. Two hundred fifty seven (66.6%) respondents had teaching experience of more than ten years. Figure 3 shows respondents' gender to be 339 (87.8%) male and 47 (12.2%) female. The data in Figure 4 presents the distribution of respondents by their highest level of education attained. Only 3 respondents (.8%) had a high school diploma as their highest Demographic Information of the Respondents
  • 57. 42 Over 20 yrs (33.3%) 1 to 5 yrs (18.7%)16 to 20 yrs (15.5%) 6 to 10 yrs 11 to 15 yrs (14.8%) (17.9%) ^ Figure 2. Distribution of respondents by years of teaching experiences (n=386). Female (12.2%) Male (87.8%) Figure 3. Distribution of respondents by gender (n=386).
  • 58. 43 Masters (52.1%) Bachelors (44.3%) High School Graduate (0.8%) Doctoral (2.8%) Figure 4. Distribution of respondents by highest educational level attained. degree; 171 respondents (44.3%) had attained bachelors degree; 201(52.1%) respondents had masters degree, and 11 (2.8%) respondents out of 386 had obtained the doctoral degree. Figure 5 presents the distribution of respondents by age. Fifty (13.0%) respondents' ages were in their twenties; 108 (28.0%) respondents were in their thirties, 148 (38.3%) were in their forties, and 80 (20.7%) respondents indicated ages in their fifties to sixties. Figure 6shows the distribution of respondents by days teaching contract per year. Forty five (11.7%) respondents had contracts for 180 days or less days per year; 106 (27.5%) respondents had contracts for 181 to 200 days per year; 104 (26.9%) respondents indicated 201 to 220 days in their teaching contracts per year, and 131 (33.9%) respondents of the 386 indicated 221 to 240 days in their teaching contracts per year. The data in Figure 7 present thedistribution of respondents by courses taken related to teaching and learning. Eight respondents (2.1%) of the 386 had not taken courses related
  • 59. 44 pl20' 18.4%100 13.0% 30 to 3920 to 29 40 to 49 50 to 59 over (roup of Age Figure 5. Distribution of respondents by group of age. below ISO Figure 6. Distribution of respondents by days of teaching contract per year.
  • 60. 45 34.7% 120 23.6% 100- 10.4%60 2-1% None 1 to2 3to4 5to6 over 7 Figure 7. Distribution of respondents by number of courses taken related to teaching and learning. to teaching and learning; 40 (10.4%) respondents had taken 1 to 2 courses in teaching and learning; 134 (34.7%) respondents had taken three to four courses in teaching and learning; 91 (23.6%) respondents had taken 5 to 6 courses in teaching and learning courses, and 113 (29.3%) respondents indicated 7 or more courses taken in teaching and learning. Data in Figure 8 present the distribution of respondents by school location. Forty (10.4%) respondents indicated that their school location was in an urban area; 76 (19.7%) respondents indicated their school was located in a suburban area, and 270(69.9%) of the 386 respondents taught in a rural area. The data in Figure 9 shows the distribution of respondents by school size. One hundred fifty six (40.4%) of the 386 respondents indicated that their school size was small; 149 (38.6%) respondents indicated their school was middle size; and 81 (21.0%) indicated large school size.
  • 61. 46 Rural (69.9%) Suburban (19.7%) Urban (10.4%) Figure 8. Distribution of respondents by school location. Smaller (40.4%) Larger (21.0%) Middle size (38.6%) Figure 9. Distribution of respondents by school location
  • 62. 47 Perceptions of the Respondents Regarding Teaching and Learning Principles Table 3 shows that respondents were asked to rate twenty-two perception statements dealing with selected teaching and learning principles in secondary agricultural education programs. The scale used was a 1 to 5 to agreement scale with each of the perception statements. The scale descriptors were: 1= Strongly Disagree, 2 = Disagree, 3 = Uncertain, 4 = Agree, 5 = Strongly Agree. The mean values were placed in descending order from the highest score to lowest score foreach statement as shown in Table 3. Fifteen perception statements regarding selected teaching-learning principles had means ratings above 4.0. The highest mean score was 4.63 (SD =.58) for the statement, "Agricultural education teachers recognize that individual differences exist among students." The second highest mean score was 4.46 (SD = .74) for the statement, "Feedback is important for student learning." The third highest mean score was 4.44 (SD = .74) for the statement, 'Teaching strategies are of little importance because students learn well any way." The fourth ranked mean score was 4.41 (SD = .64) for thestatement, "Agricultural education teachers use a variety of evaluation procedures in agricultural courses." Similarly, the mean score for the statement"Agricultural education teachers provide career guidance as necessary in teaching agricultural science" was 4.40 (SD = .60). Other perception statements which had means ratings above 4.0 were:"Agricultural education teachers set achievable objectives for lessons" (mean = 4.30), 'Trulyeffective discipline and classroom management are inseparable terms" (mean = 4.25), "Agricultural education teachers must be patient and sympathetic toward smdents" (mean = 4.23),"Agricultural education teachers use individualized instruction to help learners make decisions" (mean = 4.22), "Agricultural
  • 63. 48 education teachers use student-centered approaches when appropriate" (mean = 4.20), "Agricultural education teachers connect the new element to be learned with something in previous experiences" (mean = 4.19), "Agricultural education teachers prepare instructional plans to provide desirable learningexperiences" (mean = 4.17), "Agricultural education teachers use a specific interest approach to enhance the learner's motivation" (mean = 4.12), "Agricultural education teachers develop some proficiency with computers" (mean = 4.07), "Films that contain professional introductions need no further introduction by the teacher" (mean = 4.05). Table 3. Means and standard deviations of perceptions held by the respondents regarding selected teaching-learning principles in secondary agricultural education programs (n=386). Principle statement Mean SD Agricultural education teachers recognize that 4.63 .58 individual differences exist amongstudents Feedback is important for student learning. 4.46 .63 Teaching strategies are of little importance 4.44* .74 because students learn well any way. Agricultural education teachers use a variety of 4.41 .64 evaluation procedures in agriculture classes. Agricultural education teachers provide 4.40 .60 career guidance as necessary in teaching agricultural science. A^cultural education teachers set achievable 4.30 .61 objectives for lessons. Truly effective discipline and classroom 4.25 .90 management are inseparable terms. Agriculniral education teachers must be 4.23 .77 patient and sympathetic toward students. Agricultural education teachers use individualized 4.22 .69 instruction to help learners make decisions.
  • 64. 49 Table_3^_^Continue^ Principle statement Mean SD Agricultural education teachers use 4.20 .62 smdent-centered approaches when appropriate. Agriculmral education teachers connect 4.19 .62 the new element to be learned with something in previous experiences. Agricultural education teachers prepare 4.17 .68 instructional plans to provide desirable learning experiences. Agricultural education teachers use 4.12 .68 a specific interest approach to enhance the learner's motivation. Agricultural education teachers develop some 4.07 .63 proficiency with computers. Films that contain professional introductions 4.05* .87 need no further introduction by the teacher. Using a computer is not necessary 3.97* 1.08 in teaching and leaming agriculture. Agricultural education teachers clearly explain 3.96 .74 objectives of lessons to their smdents. Agricultural education teachers use 3.96 .79 on-farm/agribusiness instruction to deal with individual problems of students when appropriate. The way a teacher implements a teaching method 3.80 .87 is more important than which method is selected. Directed leaming is more effectivethan 3.71 .90 undirected leaming. Agricultural education teachers understand that 3.70 .95 the student's leamingstyle is related to the teacher's teaching style. A student's grades should be based on what 3.66 .97 the student has learned. Scale: 1 = strongly disagree, 2= disagree, 3 = uncertain, 4= agree, 5 = strongly agree * converted valuesfrom negative statement to positive statement
  • 65. 50 There were seven perception statements with means ranges from 3.66 to 3.97 which indicated respondents' tendencies toward agreement. The lowest meanscore was 3.66 (SD = .97) for the statement, "A student's grades should be based on what the student has learned." Analysis of variance for the teaching-learning principle A one way analysis of variance test was applied to identify if significant differences existed in the level of agreement or disagreement with statements regarding selected principles of teaching-learning when respondents were grouped by selected demographic characteristics of teaching experience, gender,academic background, age, days in the teaching contract per year, number of courses taken related to teaching-learning, school location, and school size. Duncan and LSD test was utilized to detect of the significant differences between the groups. The level of significance for all tests was set a priori at .05. Table 4 reveals that the analysisof variance indicated no significant differences among the respondents when grouped by teaching experience and analyzed with the perception variables. Therefore it could be concluded that respondents' teaching experiences had littie influence on their perceptions regarding the selected teaching-learning principles. Table 4. Analysis of variance of means/standard deviations regarding perceptions of teaching-learning principles when grouped by teaching experience (n=386). Teaching experience n Mean SD F-ratio F-prob. I to 5 years 72 4.10 .37 .28 .88 6 to 10 years 57 4.15 .27 11 to 15 years 69 4.13 .33 16 to 20 years 60 4.11 .30 21 or more years 128 4.14 .33 Scale; 1 = strongly disagree, 2 = disagree, 3 = uncertain,4 = agree, 5 = strongly agree
  • 66. 51 Table 5 shows that there is no significant difference respondents' perceptions when grouped by gender and analyzed with the perception statements for the teaching-learning principles. It implies that respondents' gender had little affect on their perceptions regarding teaching-learning principles. Table 5.Gender differences in the perceptions held by the respondents regarding ^^^teachin£Midleaniin££rinci£lesjn^econdar^_a^culture^ro^^]^^ Gender n Mean SD t-value df prob. Male 339 4.12 .33 -1.51 384 .80 Scale: 1 = strongly disagree, 2 = disagree, 3= uncertain, 4= agree, 5 = stronglyagree The data in Table6 reveals that there is no significant difference at the .05 level among the respondents when grouped by educational background and analyzed with the principle statements. There were significant differences between the high school graduate groups and the doctoral degree group. It is therefore, concluded that respondents' academic background had little influence their perceptions regarding teaching-learning principles. Table 7 reveals data that indicates no significant differences among the respondents' perception about selected teaching/learning principles when grouped by age and analyzed Table 6. Analysis of variance of means/standard deviations regarding selected teaching- learning principles as perceived by teachers when grouped by level of education (n=386). Level of education n Mean SD F-ratio F-prob. High school graduate 3 4.30 .15 .55 .64 Bachelors degree 171 4.13 .34 Masters degree 201 4.13 .31 Doctoral 11 4.04 .26 Scale: 1 = strongly disagree, 2= disagree, 3 = uncertain, 4= agree, 5 ==strongly agree
  • 67. 52 Table 7. Analysis of variance of means/standard deviations regarding perceptions based on ^^^^age^Wi£s^®S2E^i££selectedteachin£andleaniin££nnci£les_(n=38^^ Age group n Mean SD F-ratio F-prob. 20 to 29 years old 50 4.08 .39 .41 .80 30 to 39 years old 106 4.14 .30 40 to 49 years old 148 4.14 .32 50 to 59 years old 71 4.12 .31 60 or over yearsold 9 4.12 .33 Scale: 1 = strongly disagree, 2 =disagree, 3 = uncertain, 4 = agree, 5 =strongly agree with the principle statements. Therefore it can be concluded that respondents' age had little affect on their perceptions regarding teaching-learning principles. Data in Table 8 reveals no significant statistical differences among the respondents ratings of perceptions on teaching-learning principles when grouped by length of teaching contract. The mean scores were very similar. It implies that respondent's length of contract had little influence on perceptions regarding selected teaching-learning principles. Table 8. Analysis of variance of means/standard deviations based on respondents perceptions ^_^____^^__^___ofteadiing^Ie^nin££rinci£lesjwhen_^grouge£bjH£n^^ Days in teaching contract n Mean SD F-ratio F-prob. 180 days orless 45 4jl 39 Ts ^>0 181 to 200 days 106 4.13 .32 201 to 220 days 104 4.14 .33 221 to 240 days 131 4.12 .30 Scale: 1 = strongly disagree, 2 = disagree, 3 = uncertain, 4 = agree, 5 = strongly agree Table 9 indicates an analysis of data regarding respondents perceptions of the teaching/learning principles when grouped by the number of courses focused on teaching/learning taken by the respondents. The mean scores indicate that there were significant statistical differences between the group 'no taken courses' (mean = 4.04) and the
  • 68. 53 Table 9. Analysis of variance of means/standard deviations based on respondents perceptions of teaching/learning principles when grouped by number of courses taken focused on teaching/learning (n=386). Teaching-learning courses taken n Mean SD F-ratio F-prob, None 8 4.04 .23 1.23 .05 1 to 2 courses taken 40 4.07 .25 3 to 4courses taken 134 4.10 .36 5 to 6 courses taken 91 4.16 .28 7 or more taken 113 4.17 .34 Scale: 1 = strongly disagree, 2 = disagree, 3 = uncertain, 4 = agree, 5= strongly agree group '5 to6 courses taken' (mean = 4.16) and '7 or more taken,' (mean = 4.17) and between the group '1 to 2 courses taken' (mean = 4.07) and '7 or more taken' (mean = 4.17). It can therefore be concluded that the number of courses taken focused on teaching /learning by the respondents had influence on their perceptions regarding selected teaching and learning principles. Data in Table 10 shows that an analysis of the data indicated no significant statistical differences regarding perceptions about teaching and learning when respondents were grouped by their school location. It implies that the respondents' school location had little influence on their perceptions regarding selected teaching and leaming principles. Table 10. Analysis of variance of means/standard deviations based respondents perceptions of teaching/leaming principles when grouped by school location (n=386). School location n Mean SD F-ratio F-prob. Urban 40 4.15 .35 .94 .39 Suburban 76 4.17 .36 Rural 270 4J1 ^86 Scale: 1 = strongly disagree, 2 = disagree, 3 = uncertain, 4 = agree, 5= strongly agree
  • 69. 54 Table 11 reveals an analysis of data regarding the perceptionsof teaching and learning principles when respondents were grouped by their school size. The mean scores indicated that there were no significantstatistical differences in the respondents' perceptions about selected principles when compared by school size. It can therefore be concluded that the respondents' school size had little influence on their perceptions regarding selected teaching and learning principles. Table 11. Analysis of variance of means/standard deviations regarding respondents ^_^__^^^erce£tions_ofteaching/leaniin££rinci£lesjvhen^rou£edb^^ School size n Mean SD F-ratio F-prob. Smaller 156 4.13 .34 .67 .50 Middle 149 4.11 .31 Larger 81 4.16 .32 Scale: 1 = strongly disagree, 2 =disagree, 3 = uncertain, 4 = agree, 5 = strongly agree Perceptions of the Respondents Regarding the Use and Effectiveness of Selected Teaching Methods and Tools Respondents were asked to respond to a list of 39 methods and tools by using a scale of 1 to 5 toexpress the extent to which they use this methods and tools and the extent to which these methods and tools were effective. The scale descriptors were: extent of use scale: 1 = not used, 2 = rarely used, 3 =sometimes used, 4 = frequently used, 5 = heavily used, and the effectiveness scale: 1 = not effective, 2 = of little effectiveness, 3= somewhat effective, 4 = effective, 5 = very effective. It was established a priori that mean ratings would be derived from the descriptors. Data in Table 12 reveal the means and standard deviations of the respondents' perceptions regarding the use of selected teaching methods and tools in secondary
  • 70. 55 agricultural education programs. Those methods and tools perceived to be "heavily used" and/or "frequently used" by respondents were: demonstrations (mean =4.29), discussion (mean = 4.26), laboratories (mean = 4.25), projects (mean = 4.25), contests (FFA, etc.) (mean = 4.04), using real objects (4.04), supervised experience(4.01), problem solving approaches (mean = 3.89), lecture-discussion (mean = 3.89), chalk board (mean = 3.75), exams (mean = 3.75), lecmre (mean = 3.59) and assignments (mean = 3.54). These methods, techniques and tools were perceived to be "not used" and/or "rarely used" included: distanceeducation programs (mean = 1.60), learning contracts (mean = 1.87), Internet (mean = 1.87), and case studies (mean = 2.40). The standard deviations were usually larger with the following strategies: Internet (SD = 1.06), overhead projector (SD =1.15), slides (1.01), case studies (2.40), role play (1.05), computer-assisted instruction (1.06), learning contract (1.01), exhibits (2.94), computer software (1.06), television (1.06), mentorship (1.17) and cooperative learning (1.07). These teaching strategies were identified as "not used or rarely used" by the respondents, except for cooperative learning(mean = 3.27). Table 12 shows the means and standard deviations ratings of respondents' perceptions of the effectiveness of selected teaching methods and tools. Those teaching strategies perceived to be "very effective" and "effective" were: laboratories (mean = 4.40), demonstrations (mean = 4.39), contests (mean = 4.24), using real objects (mean = 4.24), discussion (mean = 4.07), supervised experience (mean = 4.01), problem solving approaches (mean = 4.00), field trips (mean = 3.92), individualized instruction (mean = 3.91), lecture- discussion (mean = 3.80), simulation (mean = 3.70) and questioning (mean = 3.63). It