SlideShare a Scribd company logo
1 of 6
Q.1 Explain different types of water demand?
Answer- Water Demand is the measureof the total amount of water used by the
customers within the water system. Thereare several things that can influence the
amount of water demanded of your system. Oneof the most important jobs of a water
systemis to continually meet this demand without interruption, rain or shine.
i) Total annual volume (V) in liters or million liters.
ii) Annual average rate of draft in liters per day, i.e V/365
VARIOUS TYPES OF WATER DEMAND:-
i) Domestic water demand
ii) Industrial and commercial water demand
iii) Demand for public uses
iv) Fire demand
v) Water required compensating losses in wastes and thefts.
DOMESTIC WATER DEMAND:- This includes the water required in private buildings for
drinking, cooking, bathing, lawn sprinkling, Gardening, sanitary purposes etc. This
amount varies according to the living conditions of the consumers on an average this
domestic consumption under normal conditions in a Indian city is expected to be
around 135 litres /day/person as per Id:1172,1971. The total domestic consumption
generally amounts to 50-60% of the total water consumption.
INDUSTRIAL AND COMMERCIAL WATER DEMAND:- This includes the quantity of
water required to be supplied to offices, Factories, different industries, hospitals,
hostels, etc. This will vary considerably with the nature of the city and with the number
and types of industries and commercial establishment there is no direct relation of this
consumption with the population and hence the actual requirements for all industries
should be estimated. The water requirements for buildings other than residences as
per is standards are as follows.
DEMAND FOR PUBLIC USES:- This includes the quantity of water required for public
parks, gardening, washing and sprinkling on roads, usein public fountains etc.
PURPOSE WATER CONSUMPTION
FIREDEMAND:- Firedemand is the amount of water considered necessary to controla
major developing fire in a specific building. The minimum needed fire flow for any
single building is 500 gpm for 2 hours and the maximum needed fire flow is 12000 gpm
for 4 hours.
WATER REQUIRED COMPENSATING LOSSES IN WASTES AND THEFTS:-All the water
which goes in the distribution pipe does not reach the consumers. Somewater is
wasted in the pipe line due to leakage, defective pipe joints, faulty valves and fittings.
In somecases, quantity of water is lost due to unauthorized and illegal connections.
While estimating the total quantity of water some allowances for these losses and
wastages should be done. While estimating the total quantity of water of a town;
allowance of 15% of total quantity of water is made to compensate for losses, thefts
and wastageof water.
1. Losses dueto unauthorised and illegal connections.
2. Losses dueto, continuous wastageof water.
3. Losses dueto defective pipe joints, cracked and broken pipes, faulty valves and
fittings.
4. Loses and wastes.
PER CAPITA DEMAND:- ------------------ litres/day P x365
 If ‘Q’ is the total quantity of water required by various purposes by a town per year
and ‘p’ is population of town, then per capita demand will be Q Per capita demand.
Q.2 Enlist different methods used for population forecast. Explain
any one in detail?
Answer- Forecasting is theprocess of making predictions of the future based on past
and presentdata and most commonly by analysis of trends. A commonplaceexample
might be estimation of somevariable of interest at some specified future
date. Prediction is a similar, but moregeneral term. Both might refer to formal
statistical methods employing time series, cross-sectionalor longitudinal data, or
alternatively to less formaljudgmental methods. Usage can differ between areas of
application: for example, in hydrology theterms "forecast" and "forecasting" are
sometimes reserved for estimates of values at certain specific future times, while the
term "prediction" is used for more general estimates, such as the number of times
floods will occur over a long period.
CATEGORIES OF FORECASTING METHODS:-
 Qualitative vs. quantitative methods.
 Average approach.
 Naïve approach.
 Drift method.
 Seasonal naïve approach.
 Time series methods.
 Causal / econometric forecasting methods.
 Judgmental methods.
 Artificial intelligence methods.
TIME SERIES METHODS:-
A time series is a series of data points indexed (or listed or graphed) in time order.
Most commonly, a time series is a sequence taken at successiveequally spaced points
in time. Time series are very frequently plotted via line charts. Time series are used
in statistics, signal processing, pattern recognition, econometrics, mathematical
finance, weather forecasting, earthquakeprediction, electroencephalography, control
engineering, astronomy, communications engineering, and largely in any domain of
applied science and engineering which involves temporal measurements.
METHODS FOR ANALYSIS:-
DOMAIN BASED METHOD:-
1. Frequency Domain:- In physics, electronics, controlsystems engineering,
and statistics, the frequency domain refers to the analysis of mathematical
functions or signals with respect to frequency, rather than time. Put simply,
a time-domain graph shows how a signalchanges over time, whereas a
frequency-domain graph shows how much of the signal lies within each given
frequency band over a rangeof frequencies. A frequency-domain representation
can also include information on the phaseshift that must be applied to
each sinusoid in order to be able to recombine the frequency components to
recover the original time signal.
A given function or signal can be converted between the time and frequency
domains with a pair of mathematical operators called transforms. An example is
the Fourier transform, which converts a time function into a sum or integral
of sine waves of different frequencies, each of which represents a frequency
component. The "spectrum" of frequency components is the frequency-domain
representation of the signal. The inverseFourier transform converts the
frequency-domain function back to the time function. A spectrum analyzer is a
tool commonly used to visualize electronic signals in the frequency domain.
2. TIME DOMAIN METHOD:-Timedomain refers to the analysis of mathematical
functions, physicalsignals or time series of economic or environmentaldata,
with respect to time. In the time domain, the signal or function's value is known
for all real numbers, for the case of continuous time, or at various separate
instants in the case of discretetime. An oscilloscopeis a tool commonly used to
visualizereal-world signals in the time domain. A time-domain graph shows how
a signal changes with time, whereas a frequency-domain graph shows how
much of the signal lies within each given frequency band over a range of
frequencies.
Autocorrelation, also known as serialcorrelation, is the correlation of
a signal with a delayed copy of itself as a function of delay. Informally, itis the
similarity between observations as a function of the time lag between them. The
analysis of autocorrelation is a mathematical tool for finding repeating patterns,
such as the presence of a periodic signal obscured by noise, or identifying
the missing fundamentalfrequency in a signalimplied by
its harmonic frequencies. Itis often used in signal processing for analyzing
functions or series of values, such as time domain signals.
Cross correlation is a measurement that tracks the movements of two variables
or sets of data relative to each other. In its simplest version, it can be described
in terms of an independent variable, X, and two dependent variables, Y and Z. If
independent variableX influences variable Y and the two are positively
correlated, then as the value of X rises so will the value of Y. If the same is true
of the relationship between X and Z, then as the value of X rises, so will the value
of Z. Variables Y and Z can be said to be cross correlated because their behaviour
is positively correlated as a resultof each of their individual relationships to
variable X. Cross correlation can also occur with sets and time series of data.
PARAMETER BASED METHODS:-
1. The Paramedic Method:- Thebasic idea is that there is a set of fixed parameters
that determine a probability model. Parametric methods are often those for
which we know that the population is approximately normal, or we can
approximate using a normal distribution after we invoke the central limit
theorem.
2. The Non Paramedic Method:- Nonparametric statistics is the branch
of statistics that is not based solely on parameterized families of probability
distributions (common examples of parameters are the mean and variance).
Nonparametric statistics is based on either being distribution-freeor having a
specified distribution but with the distribution's parameters unspecified.
Nonparametric statistics includes both descriptive statistics and statistical
inference.

More Related Content

Similar to Assignment water demand

Smart Water Meter System for Detecting Sudden Water Leakage
Smart Water Meter System for Detecting Sudden Water LeakageSmart Water Meter System for Detecting Sudden Water Leakage
Smart Water Meter System for Detecting Sudden Water LeakageAneekBanerjee4
 
Mathematical modeling approach for flood management
Mathematical modeling approach for flood managementMathematical modeling approach for flood management
Mathematical modeling approach for flood managementprjpublications
 
Comparision of flow analysis through a different geometry of flowmeters using...
Comparision of flow analysis through a different geometry of flowmeters using...Comparision of flow analysis through a different geometry of flowmeters using...
Comparision of flow analysis through a different geometry of flowmeters using...eSAT Publishing House
 
Rainfall Runoff Modelling on the Lower Tapi Basin using HEC-HMS
Rainfall Runoff Modelling on the Lower Tapi Basin using HEC-HMSRainfall Runoff Modelling on the Lower Tapi Basin using HEC-HMS
Rainfall Runoff Modelling on the Lower Tapi Basin using HEC-HMSAnkit Balyan MBA, B.Tech.
 
CHAPTER- FIVE.pptx futfuyuiui898 y90y8y98t78t
CHAPTER- FIVE.pptx futfuyuiui898 y90y8y98t78tCHAPTER- FIVE.pptx futfuyuiui898 y90y8y98t78t
CHAPTER- FIVE.pptx futfuyuiui898 y90y8y98t78t2cd
 
Footstep power generation
Footstep power generationFootstep power generation
Footstep power generationbaga reddy
 
Footstep power generation
Footstep power generationFootstep power generation
Footstep power generationbaga reddy
 
Understanding Water Level Sensors A Comprehensive Guide.pdf
Understanding Water Level Sensors A Comprehensive Guide.pdfUnderstanding Water Level Sensors A Comprehensive Guide.pdf
Understanding Water Level Sensors A Comprehensive Guide.pdfhappychickensfarm service
 
Advanced gas leakage detection using acoustic sensors new
Advanced gas leakage detection using acoustic sensors newAdvanced gas leakage detection using acoustic sensors new
Advanced gas leakage detection using acoustic sensors newYatheesh Kaggere
 
Design_and_Development_of_Automatic_Wate.pdf
Design_and_Development_of_Automatic_Wate.pdfDesign_and_Development_of_Automatic_Wate.pdf
Design_and_Development_of_Automatic_Wate.pdfIJCSEA Journal
 
DESIGN AND DEVELOPMENT OF AUTOMATIC WATER FLOW METER
DESIGN AND DEVELOPMENT OF AUTOMATIC WATER FLOW METERDESIGN AND DEVELOPMENT OF AUTOMATIC WATER FLOW METER
DESIGN AND DEVELOPMENT OF AUTOMATIC WATER FLOW METERIJCSEA Journal
 
Design and development of automatic Water flow meter
Design and development of automatic Water flow meterDesign and development of automatic Water flow meter
Design and development of automatic Water flow meterIJCSEA Journal
 
Comparison of Explicit Finite Difference Model and Galerkin Finite Element Mo...
Comparison of Explicit Finite Difference Model and Galerkin Finite Element Mo...Comparison of Explicit Finite Difference Model and Galerkin Finite Element Mo...
Comparison of Explicit Finite Difference Model and Galerkin Finite Element Mo...AM Publications
 
Ce 401 introduction to environmental engineering
Ce 401 introduction to environmental engineeringCe 401 introduction to environmental engineering
Ce 401 introduction to environmental engineeringMuhammad Nouman
 
Applications Of Math In Real Life And Business
Applications Of Math In Real Life And BusinessApplications Of Math In Real Life And Business
Applications Of Math In Real Life And BusinessMuhammad Ahmad Badar
 

Similar to Assignment water demand (20)

Smart Water Meter System for Detecting Sudden Water Leakage
Smart Water Meter System for Detecting Sudden Water LeakageSmart Water Meter System for Detecting Sudden Water Leakage
Smart Water Meter System for Detecting Sudden Water Leakage
 
Mathematical modeling
Mathematical modelingMathematical modeling
Mathematical modeling
 
Mathematical modeling approach for flood management
Mathematical modeling approach for flood managementMathematical modeling approach for flood management
Mathematical modeling approach for flood management
 
Comparision of flow analysis through a different geometry of flowmeters using...
Comparision of flow analysis through a different geometry of flowmeters using...Comparision of flow analysis through a different geometry of flowmeters using...
Comparision of flow analysis through a different geometry of flowmeters using...
 
Cnfms 18-06-14 sai bhaskar
Cnfms  18-06-14 sai bhaskarCnfms  18-06-14 sai bhaskar
Cnfms 18-06-14 sai bhaskar
 
Rainfall Runoff Modelling on the Lower Tapi Basin using HEC-HMS
Rainfall Runoff Modelling on the Lower Tapi Basin using HEC-HMSRainfall Runoff Modelling on the Lower Tapi Basin using HEC-HMS
Rainfall Runoff Modelling on the Lower Tapi Basin using HEC-HMS
 
CHAPTER- FIVE.pptx futfuyuiui898 y90y8y98t78t
CHAPTER- FIVE.pptx futfuyuiui898 y90y8y98t78tCHAPTER- FIVE.pptx futfuyuiui898 y90y8y98t78t
CHAPTER- FIVE.pptx futfuyuiui898 y90y8y98t78t
 
assignmenttutorhelp.com
assignmenttutorhelp.comassignmenttutorhelp.com
assignmenttutorhelp.com
 
Footstep power generation
Footstep power generationFootstep power generation
Footstep power generation
 
Footstep power generation
Footstep power generationFootstep power generation
Footstep power generation
 
Understanding Water Level Sensors A Comprehensive Guide.pdf
Understanding Water Level Sensors A Comprehensive Guide.pdfUnderstanding Water Level Sensors A Comprehensive Guide.pdf
Understanding Water Level Sensors A Comprehensive Guide.pdf
 
Advanced gas leakage detection using acoustic sensors new
Advanced gas leakage detection using acoustic sensors newAdvanced gas leakage detection using acoustic sensors new
Advanced gas leakage detection using acoustic sensors new
 
Measurements Basics
Measurements BasicsMeasurements Basics
Measurements Basics
 
Pstj 1342
Pstj 1342Pstj 1342
Pstj 1342
 
Design_and_Development_of_Automatic_Wate.pdf
Design_and_Development_of_Automatic_Wate.pdfDesign_and_Development_of_Automatic_Wate.pdf
Design_and_Development_of_Automatic_Wate.pdf
 
DESIGN AND DEVELOPMENT OF AUTOMATIC WATER FLOW METER
DESIGN AND DEVELOPMENT OF AUTOMATIC WATER FLOW METERDESIGN AND DEVELOPMENT OF AUTOMATIC WATER FLOW METER
DESIGN AND DEVELOPMENT OF AUTOMATIC WATER FLOW METER
 
Design and development of automatic Water flow meter
Design and development of automatic Water flow meterDesign and development of automatic Water flow meter
Design and development of automatic Water flow meter
 
Comparison of Explicit Finite Difference Model and Galerkin Finite Element Mo...
Comparison of Explicit Finite Difference Model and Galerkin Finite Element Mo...Comparison of Explicit Finite Difference Model and Galerkin Finite Element Mo...
Comparison of Explicit Finite Difference Model and Galerkin Finite Element Mo...
 
Ce 401 introduction to environmental engineering
Ce 401 introduction to environmental engineeringCe 401 introduction to environmental engineering
Ce 401 introduction to environmental engineering
 
Applications Of Math In Real Life And Business
Applications Of Math In Real Life And BusinessApplications Of Math In Real Life And Business
Applications Of Math In Real Life And Business
 

More from BIKIMALLIK1

Final plan with estimate sheet a1
Final plan with estimate sheet a1Final plan with estimate sheet a1
Final plan with estimate sheet a1BIKIMALLIK1
 
MAA SARASWATI PREPARED BY BIKI MALLIK
MAA SARASWATI PREPARED BY BIKI MALLIKMAA SARASWATI PREPARED BY BIKI MALLIK
MAA SARASWATI PREPARED BY BIKI MALLIKBIKIMALLIK1
 
PLAN DESIGN BY BIKI MALLIK
PLAN DESIGN BY BIKI MALLIKPLAN DESIGN BY BIKI MALLIK
PLAN DESIGN BY BIKI MALLIKBIKIMALLIK1
 
FIELD COMPACTION CE(PC)504
FIELD COMPACTION CE(PC)504FIELD COMPACTION CE(PC)504
FIELD COMPACTION CE(PC)504BIKIMALLIK1
 
Thiessen mean method
Thiessen mean methodThiessen mean method
Thiessen mean methodBIKIMALLIK1
 
Determination of alkalinity
Determination of alkalinityDetermination of alkalinity
Determination of alkalinityBIKIMALLIK1
 
Solid waste management
Solid waste managementSolid waste management
Solid waste managementBIKIMALLIK1
 
Socal & global model 4
Socal & global model 4Socal & global model 4
Socal & global model 4BIKIMALLIK1
 
Ce(hs)401 model 2 & 3 all
Ce(hs)401  model 2 & 3 allCe(hs)401  model 2 & 3 all
Ce(hs)401 model 2 & 3 allBIKIMALLIK1
 
CE(PC)403 Surveying & Geomatics
CE(PC)403 Surveying & GeomaticsCE(PC)403 Surveying & Geomatics
CE(PC)403 Surveying & GeomaticsBIKIMALLIK1
 
Nshm faculty of engineering & technology
Nshm faculty of engineering & technologyNshm faculty of engineering & technology
Nshm faculty of engineering & technologyBIKIMALLIK1
 
Management – I (Organizational Behaviour) Ce(mc)401 m3
Management – I (Organizational Behaviour) Ce(mc)401 m3Management – I (Organizational Behaviour) Ce(mc)401 m3
Management – I (Organizational Behaviour) Ce(mc)401 m3BIKIMALLIK1
 
Management – I (Organizational Behaviour) Ce(mc)401 m1
Management – I (Organizational Behaviour) Ce(mc)401 m1Management – I (Organizational Behaviour) Ce(mc)401 m1
Management – I (Organizational Behaviour) Ce(mc)401 m1BIKIMALLIK1
 

More from BIKIMALLIK1 (15)

Final plan with estimate sheet a1
Final plan with estimate sheet a1Final plan with estimate sheet a1
Final plan with estimate sheet a1
 
Cv
CvCv
Cv
 
MAA SARASWATI PREPARED BY BIKI MALLIK
MAA SARASWATI PREPARED BY BIKI MALLIKMAA SARASWATI PREPARED BY BIKI MALLIK
MAA SARASWATI PREPARED BY BIKI MALLIK
 
PLAN DESIGN BY BIKI MALLIK
PLAN DESIGN BY BIKI MALLIKPLAN DESIGN BY BIKI MALLIK
PLAN DESIGN BY BIKI MALLIK
 
FIELD COMPACTION CE(PC)504
FIELD COMPACTION CE(PC)504FIELD COMPACTION CE(PC)504
FIELD COMPACTION CE(PC)504
 
Thiessen mean method
Thiessen mean methodThiessen mean method
Thiessen mean method
 
Determination of alkalinity
Determination of alkalinityDetermination of alkalinity
Determination of alkalinity
 
EDM & GPS
EDM & GPSEDM & GPS
EDM & GPS
 
Solid waste management
Solid waste managementSolid waste management
Solid waste management
 
Socal & global model 4
Socal & global model 4Socal & global model 4
Socal & global model 4
 
Ce(hs)401 model 2 & 3 all
Ce(hs)401  model 2 & 3 allCe(hs)401  model 2 & 3 all
Ce(hs)401 model 2 & 3 all
 
CE(PC)403 Surveying & Geomatics
CE(PC)403 Surveying & GeomaticsCE(PC)403 Surveying & Geomatics
CE(PC)403 Surveying & Geomatics
 
Nshm faculty of engineering & technology
Nshm faculty of engineering & technologyNshm faculty of engineering & technology
Nshm faculty of engineering & technology
 
Management – I (Organizational Behaviour) Ce(mc)401 m3
Management – I (Organizational Behaviour) Ce(mc)401 m3Management – I (Organizational Behaviour) Ce(mc)401 m3
Management – I (Organizational Behaviour) Ce(mc)401 m3
 
Management – I (Organizational Behaviour) Ce(mc)401 m1
Management – I (Organizational Behaviour) Ce(mc)401 m1Management – I (Organizational Behaviour) Ce(mc)401 m1
Management – I (Organizational Behaviour) Ce(mc)401 m1
 

Recently uploaded

How to setup Pycharm environment for Odoo 17.pptx
How to setup Pycharm environment for Odoo 17.pptxHow to setup Pycharm environment for Odoo 17.pptx
How to setup Pycharm environment for Odoo 17.pptxCeline George
 
Exploring_the_Narrative_Style_of_Amitav_Ghoshs_Gun_Island.pptx
Exploring_the_Narrative_Style_of_Amitav_Ghoshs_Gun_Island.pptxExploring_the_Narrative_Style_of_Amitav_Ghoshs_Gun_Island.pptx
Exploring_the_Narrative_Style_of_Amitav_Ghoshs_Gun_Island.pptxPooja Bhuva
 
Interdisciplinary_Insights_Data_Collection_Methods.pptx
Interdisciplinary_Insights_Data_Collection_Methods.pptxInterdisciplinary_Insights_Data_Collection_Methods.pptx
Interdisciplinary_Insights_Data_Collection_Methods.pptxPooja Bhuva
 
Single or Multiple melodic lines structure
Single or Multiple melodic lines structureSingle or Multiple melodic lines structure
Single or Multiple melodic lines structuredhanjurrannsibayan2
 
Kodo Millet PPT made by Ghanshyam bairwa college of Agriculture kumher bhara...
Kodo Millet  PPT made by Ghanshyam bairwa college of Agriculture kumher bhara...Kodo Millet  PPT made by Ghanshyam bairwa college of Agriculture kumher bhara...
Kodo Millet PPT made by Ghanshyam bairwa college of Agriculture kumher bhara...pradhanghanshyam7136
 
HMCS Max Bernays Pre-Deployment Brief (May 2024).pptx
HMCS Max Bernays Pre-Deployment Brief (May 2024).pptxHMCS Max Bernays Pre-Deployment Brief (May 2024).pptx
HMCS Max Bernays Pre-Deployment Brief (May 2024).pptxEsquimalt MFRC
 
Salient Features of India constitution especially power and functions
Salient Features of India constitution especially power and functionsSalient Features of India constitution especially power and functions
Salient Features of India constitution especially power and functionsKarakKing
 
Application orientated numerical on hev.ppt
Application orientated numerical on hev.pptApplication orientated numerical on hev.ppt
Application orientated numerical on hev.pptRamjanShidvankar
 
ICT Role in 21st Century Education & its Challenges.pptx
ICT Role in 21st Century Education & its Challenges.pptxICT Role in 21st Century Education & its Challenges.pptx
ICT Role in 21st Century Education & its Challenges.pptxAreebaZafar22
 
Plant propagation: Sexual and Asexual propapagation.pptx
Plant propagation: Sexual and Asexual propapagation.pptxPlant propagation: Sexual and Asexual propapagation.pptx
Plant propagation: Sexual and Asexual propapagation.pptxUmeshTimilsina1
 
The basics of sentences session 3pptx.pptx
The basics of sentences session 3pptx.pptxThe basics of sentences session 3pptx.pptx
The basics of sentences session 3pptx.pptxheathfieldcps1
 
FSB Advising Checklist - Orientation 2024
FSB Advising Checklist - Orientation 2024FSB Advising Checklist - Orientation 2024
FSB Advising Checklist - Orientation 2024Elizabeth Walsh
 
On_Translating_a_Tamil_Poem_by_A_K_Ramanujan.pptx
On_Translating_a_Tamil_Poem_by_A_K_Ramanujan.pptxOn_Translating_a_Tamil_Poem_by_A_K_Ramanujan.pptx
On_Translating_a_Tamil_Poem_by_A_K_Ramanujan.pptxPooja Bhuva
 
UGC NET Paper 1 Mathematical Reasoning & Aptitude.pdf
UGC NET Paper 1 Mathematical Reasoning & Aptitude.pdfUGC NET Paper 1 Mathematical Reasoning & Aptitude.pdf
UGC NET Paper 1 Mathematical Reasoning & Aptitude.pdfNirmal Dwivedi
 
General Principles of Intellectual Property: Concepts of Intellectual Proper...
General Principles of Intellectual Property: Concepts of Intellectual  Proper...General Principles of Intellectual Property: Concepts of Intellectual  Proper...
General Principles of Intellectual Property: Concepts of Intellectual Proper...Poonam Aher Patil
 
SOC 101 Demonstration of Learning Presentation
SOC 101 Demonstration of Learning PresentationSOC 101 Demonstration of Learning Presentation
SOC 101 Demonstration of Learning Presentationcamerronhm
 
HMCS Vancouver Pre-Deployment Brief - May 2024 (Web Version).pptx
HMCS Vancouver Pre-Deployment Brief - May 2024 (Web Version).pptxHMCS Vancouver Pre-Deployment Brief - May 2024 (Web Version).pptx
HMCS Vancouver Pre-Deployment Brief - May 2024 (Web Version).pptxmarlenawright1
 
Beyond_Borders_Understanding_Anime_and_Manga_Fandom_A_Comprehensive_Audience_...
Beyond_Borders_Understanding_Anime_and_Manga_Fandom_A_Comprehensive_Audience_...Beyond_Borders_Understanding_Anime_and_Manga_Fandom_A_Comprehensive_Audience_...
Beyond_Borders_Understanding_Anime_and_Manga_Fandom_A_Comprehensive_Audience_...Pooja Bhuva
 
REMIFENTANIL: An Ultra short acting opioid.pptx
REMIFENTANIL: An Ultra short acting opioid.pptxREMIFENTANIL: An Ultra short acting opioid.pptx
REMIFENTANIL: An Ultra short acting opioid.pptxDr. Ravikiran H M Gowda
 
COMMUNICATING NEGATIVE NEWS - APPROACHES .pptx
COMMUNICATING NEGATIVE NEWS - APPROACHES .pptxCOMMUNICATING NEGATIVE NEWS - APPROACHES .pptx
COMMUNICATING NEGATIVE NEWS - APPROACHES .pptxannathomasp01
 

Recently uploaded (20)

How to setup Pycharm environment for Odoo 17.pptx
How to setup Pycharm environment for Odoo 17.pptxHow to setup Pycharm environment for Odoo 17.pptx
How to setup Pycharm environment for Odoo 17.pptx
 
Exploring_the_Narrative_Style_of_Amitav_Ghoshs_Gun_Island.pptx
Exploring_the_Narrative_Style_of_Amitav_Ghoshs_Gun_Island.pptxExploring_the_Narrative_Style_of_Amitav_Ghoshs_Gun_Island.pptx
Exploring_the_Narrative_Style_of_Amitav_Ghoshs_Gun_Island.pptx
 
Interdisciplinary_Insights_Data_Collection_Methods.pptx
Interdisciplinary_Insights_Data_Collection_Methods.pptxInterdisciplinary_Insights_Data_Collection_Methods.pptx
Interdisciplinary_Insights_Data_Collection_Methods.pptx
 
Single or Multiple melodic lines structure
Single or Multiple melodic lines structureSingle or Multiple melodic lines structure
Single or Multiple melodic lines structure
 
Kodo Millet PPT made by Ghanshyam bairwa college of Agriculture kumher bhara...
Kodo Millet  PPT made by Ghanshyam bairwa college of Agriculture kumher bhara...Kodo Millet  PPT made by Ghanshyam bairwa college of Agriculture kumher bhara...
Kodo Millet PPT made by Ghanshyam bairwa college of Agriculture kumher bhara...
 
HMCS Max Bernays Pre-Deployment Brief (May 2024).pptx
HMCS Max Bernays Pre-Deployment Brief (May 2024).pptxHMCS Max Bernays Pre-Deployment Brief (May 2024).pptx
HMCS Max Bernays Pre-Deployment Brief (May 2024).pptx
 
Salient Features of India constitution especially power and functions
Salient Features of India constitution especially power and functionsSalient Features of India constitution especially power and functions
Salient Features of India constitution especially power and functions
 
Application orientated numerical on hev.ppt
Application orientated numerical on hev.pptApplication orientated numerical on hev.ppt
Application orientated numerical on hev.ppt
 
ICT Role in 21st Century Education & its Challenges.pptx
ICT Role in 21st Century Education & its Challenges.pptxICT Role in 21st Century Education & its Challenges.pptx
ICT Role in 21st Century Education & its Challenges.pptx
 
Plant propagation: Sexual and Asexual propapagation.pptx
Plant propagation: Sexual and Asexual propapagation.pptxPlant propagation: Sexual and Asexual propapagation.pptx
Plant propagation: Sexual and Asexual propapagation.pptx
 
The basics of sentences session 3pptx.pptx
The basics of sentences session 3pptx.pptxThe basics of sentences session 3pptx.pptx
The basics of sentences session 3pptx.pptx
 
FSB Advising Checklist - Orientation 2024
FSB Advising Checklist - Orientation 2024FSB Advising Checklist - Orientation 2024
FSB Advising Checklist - Orientation 2024
 
On_Translating_a_Tamil_Poem_by_A_K_Ramanujan.pptx
On_Translating_a_Tamil_Poem_by_A_K_Ramanujan.pptxOn_Translating_a_Tamil_Poem_by_A_K_Ramanujan.pptx
On_Translating_a_Tamil_Poem_by_A_K_Ramanujan.pptx
 
UGC NET Paper 1 Mathematical Reasoning & Aptitude.pdf
UGC NET Paper 1 Mathematical Reasoning & Aptitude.pdfUGC NET Paper 1 Mathematical Reasoning & Aptitude.pdf
UGC NET Paper 1 Mathematical Reasoning & Aptitude.pdf
 
General Principles of Intellectual Property: Concepts of Intellectual Proper...
General Principles of Intellectual Property: Concepts of Intellectual  Proper...General Principles of Intellectual Property: Concepts of Intellectual  Proper...
General Principles of Intellectual Property: Concepts of Intellectual Proper...
 
SOC 101 Demonstration of Learning Presentation
SOC 101 Demonstration of Learning PresentationSOC 101 Demonstration of Learning Presentation
SOC 101 Demonstration of Learning Presentation
 
HMCS Vancouver Pre-Deployment Brief - May 2024 (Web Version).pptx
HMCS Vancouver Pre-Deployment Brief - May 2024 (Web Version).pptxHMCS Vancouver Pre-Deployment Brief - May 2024 (Web Version).pptx
HMCS Vancouver Pre-Deployment Brief - May 2024 (Web Version).pptx
 
Beyond_Borders_Understanding_Anime_and_Manga_Fandom_A_Comprehensive_Audience_...
Beyond_Borders_Understanding_Anime_and_Manga_Fandom_A_Comprehensive_Audience_...Beyond_Borders_Understanding_Anime_and_Manga_Fandom_A_Comprehensive_Audience_...
Beyond_Borders_Understanding_Anime_and_Manga_Fandom_A_Comprehensive_Audience_...
 
REMIFENTANIL: An Ultra short acting opioid.pptx
REMIFENTANIL: An Ultra short acting opioid.pptxREMIFENTANIL: An Ultra short acting opioid.pptx
REMIFENTANIL: An Ultra short acting opioid.pptx
 
COMMUNICATING NEGATIVE NEWS - APPROACHES .pptx
COMMUNICATING NEGATIVE NEWS - APPROACHES .pptxCOMMUNICATING NEGATIVE NEWS - APPROACHES .pptx
COMMUNICATING NEGATIVE NEWS - APPROACHES .pptx
 

Assignment water demand

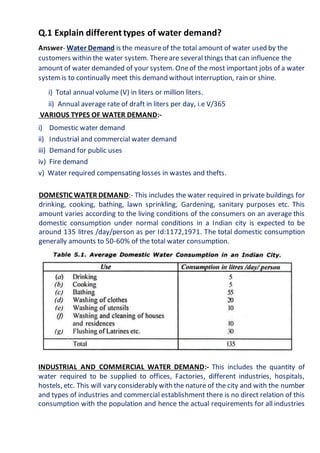
  • 1. Q.1 Explain different types of water demand? Answer- Water Demand is the measureof the total amount of water used by the customers within the water system. Thereare several things that can influence the amount of water demanded of your system. Oneof the most important jobs of a water systemis to continually meet this demand without interruption, rain or shine. i) Total annual volume (V) in liters or million liters. ii) Annual average rate of draft in liters per day, i.e V/365 VARIOUS TYPES OF WATER DEMAND:- i) Domestic water demand ii) Industrial and commercial water demand iii) Demand for public uses iv) Fire demand v) Water required compensating losses in wastes and thefts. DOMESTIC WATER DEMAND:- This includes the water required in private buildings for drinking, cooking, bathing, lawn sprinkling, Gardening, sanitary purposes etc. This amount varies according to the living conditions of the consumers on an average this domestic consumption under normal conditions in a Indian city is expected to be around 135 litres /day/person as per Id:1172,1971. The total domestic consumption generally amounts to 50-60% of the total water consumption. INDUSTRIAL AND COMMERCIAL WATER DEMAND:- This includes the quantity of water required to be supplied to offices, Factories, different industries, hospitals, hostels, etc. This will vary considerably with the nature of the city and with the number and types of industries and commercial establishment there is no direct relation of this consumption with the population and hence the actual requirements for all industries
  • 2. should be estimated. The water requirements for buildings other than residences as per is standards are as follows. DEMAND FOR PUBLIC USES:- This includes the quantity of water required for public parks, gardening, washing and sprinkling on roads, usein public fountains etc. PURPOSE WATER CONSUMPTION FIREDEMAND:- Firedemand is the amount of water considered necessary to controla major developing fire in a specific building. The minimum needed fire flow for any single building is 500 gpm for 2 hours and the maximum needed fire flow is 12000 gpm for 4 hours.
  • 3. WATER REQUIRED COMPENSATING LOSSES IN WASTES AND THEFTS:-All the water which goes in the distribution pipe does not reach the consumers. Somewater is wasted in the pipe line due to leakage, defective pipe joints, faulty valves and fittings. In somecases, quantity of water is lost due to unauthorized and illegal connections. While estimating the total quantity of water some allowances for these losses and wastages should be done. While estimating the total quantity of water of a town; allowance of 15% of total quantity of water is made to compensate for losses, thefts and wastageof water. 1. Losses dueto unauthorised and illegal connections. 2. Losses dueto, continuous wastageof water. 3. Losses dueto defective pipe joints, cracked and broken pipes, faulty valves and fittings. 4. Loses and wastes. PER CAPITA DEMAND:- ------------------ litres/day P x365  If ‘Q’ is the total quantity of water required by various purposes by a town per year and ‘p’ is population of town, then per capita demand will be Q Per capita demand. Q.2 Enlist different methods used for population forecast. Explain any one in detail? Answer- Forecasting is theprocess of making predictions of the future based on past and presentdata and most commonly by analysis of trends. A commonplaceexample might be estimation of somevariable of interest at some specified future date. Prediction is a similar, but moregeneral term. Both might refer to formal statistical methods employing time series, cross-sectionalor longitudinal data, or alternatively to less formaljudgmental methods. Usage can differ between areas of application: for example, in hydrology theterms "forecast" and "forecasting" are
  • 4. sometimes reserved for estimates of values at certain specific future times, while the term "prediction" is used for more general estimates, such as the number of times floods will occur over a long period. CATEGORIES OF FORECASTING METHODS:-  Qualitative vs. quantitative methods.  Average approach.  Naïve approach.  Drift method.  Seasonal naïve approach.  Time series methods.  Causal / econometric forecasting methods.  Judgmental methods.  Artificial intelligence methods. TIME SERIES METHODS:- A time series is a series of data points indexed (or listed or graphed) in time order. Most commonly, a time series is a sequence taken at successiveequally spaced points in time. Time series are very frequently plotted via line charts. Time series are used in statistics, signal processing, pattern recognition, econometrics, mathematical finance, weather forecasting, earthquakeprediction, electroencephalography, control engineering, astronomy, communications engineering, and largely in any domain of applied science and engineering which involves temporal measurements. METHODS FOR ANALYSIS:- DOMAIN BASED METHOD:- 1. Frequency Domain:- In physics, electronics, controlsystems engineering, and statistics, the frequency domain refers to the analysis of mathematical functions or signals with respect to frequency, rather than time. Put simply, a time-domain graph shows how a signalchanges over time, whereas a frequency-domain graph shows how much of the signal lies within each given
  • 5. frequency band over a rangeof frequencies. A frequency-domain representation can also include information on the phaseshift that must be applied to each sinusoid in order to be able to recombine the frequency components to recover the original time signal. A given function or signal can be converted between the time and frequency domains with a pair of mathematical operators called transforms. An example is the Fourier transform, which converts a time function into a sum or integral of sine waves of different frequencies, each of which represents a frequency component. The "spectrum" of frequency components is the frequency-domain representation of the signal. The inverseFourier transform converts the frequency-domain function back to the time function. A spectrum analyzer is a tool commonly used to visualize electronic signals in the frequency domain. 2. TIME DOMAIN METHOD:-Timedomain refers to the analysis of mathematical functions, physicalsignals or time series of economic or environmentaldata, with respect to time. In the time domain, the signal or function's value is known for all real numbers, for the case of continuous time, or at various separate instants in the case of discretetime. An oscilloscopeis a tool commonly used to visualizereal-world signals in the time domain. A time-domain graph shows how a signal changes with time, whereas a frequency-domain graph shows how much of the signal lies within each given frequency band over a range of frequencies. Autocorrelation, also known as serialcorrelation, is the correlation of a signal with a delayed copy of itself as a function of delay. Informally, itis the similarity between observations as a function of the time lag between them. The analysis of autocorrelation is a mathematical tool for finding repeating patterns, such as the presence of a periodic signal obscured by noise, or identifying the missing fundamentalfrequency in a signalimplied by its harmonic frequencies. Itis often used in signal processing for analyzing functions or series of values, such as time domain signals. Cross correlation is a measurement that tracks the movements of two variables or sets of data relative to each other. In its simplest version, it can be described in terms of an independent variable, X, and two dependent variables, Y and Z. If independent variableX influences variable Y and the two are positively correlated, then as the value of X rises so will the value of Y. If the same is true of the relationship between X and Z, then as the value of X rises, so will the value of Z. Variables Y and Z can be said to be cross correlated because their behaviour is positively correlated as a resultof each of their individual relationships to variable X. Cross correlation can also occur with sets and time series of data.
  • 6. PARAMETER BASED METHODS:- 1. The Paramedic Method:- Thebasic idea is that there is a set of fixed parameters that determine a probability model. Parametric methods are often those for which we know that the population is approximately normal, or we can approximate using a normal distribution after we invoke the central limit theorem. 2. The Non Paramedic Method:- Nonparametric statistics is the branch of statistics that is not based solely on parameterized families of probability distributions (common examples of parameters are the mean and variance). Nonparametric statistics is based on either being distribution-freeor having a specified distribution but with the distribution's parameters unspecified. Nonparametric statistics includes both descriptive statistics and statistical inference.