SlideShare a Scribd company logo
1 of 88
GULF UNITED REAL ESTATE INVESTMENT
CO.
Strategic Plan 2021 and 2 Years Forward
Executive Summary
Company Overview
Our Evolution
Real Estate Portfolio
The Team
Identification of Strategic Objectives
Marketing, Leasing and Revenue
Analysis
a) The market
b) Competitor Analysis
c) Revenue, occupancy, opportunity
loss
d) Bad debt analysis
e) Leasing and marketing strategy
f) Leasing department process
 Financial performance of properties
 Cost of operation analysis
a) Electricity and water cost analysis
b) Maintenance cost analysis
c) Cost reduction plan
 Finance Department Strategy and
Improvement plan
 MEP service improvement plan
 GUC Property-Improvement and
beautification plan in year 2021 and 2
years forward ( refer separate ppt
attachment)
OUR COMPANY
• Gulf United Real Estate Investments Company
(GUC) is primarily involved in the leasing of its
owned villas, apartments and office building, Labour
accommodation, warehouse (dry, ambient, chilled
and frozen) Since 2005
• GUC is subsidiary of Zad Holding Company.
OUR EVOLUTION
2005
Najma Apartments and
IAD Office
2007
Cascade I and II, Ruby,
Diamond, Sapphire
compounds and Twin
villas
2010
Pearl Garden and
Ewaan compounds
OUR EVOLUTION
2014
IPW1, ST38 and ST39
Warhouese and Labour
Accommodations
2018
ST02 Cold Stores
(Ambient, Chiller and
Frozen)
2020
ST26 Warehouse and
Labour
Accommodations
And still
going
strong!
Real Estate Portfolio
Property Name Type Locations No. of units
Cascade I Villa/Apartment Abu Hamour 56
Cascade II Villa/Apartment Abu Hamour 32
Ruby Villa/Apartment Abu Hamoiur 28
Sapphire Villa/Apartment Abu Hamour 20
Diamond Villa/Apartment Abu Hamour 32
Twin Villa Villas Abu Hamour 2
Pearl Garden Villas Old Airport Area 16
Najma Building Apartment Najma/Mansoura 20
IAD Office Office C-Ring road 1
IPW1 Store Industrial Area,ST11 20
ST11 Labour Accommodations Labour Accommodation Industrial Area,ST38 180
ST38 Store Store Industrial Area,ST38 1
ST38 Labour Accommodations Labour Accommodation Industrial Area,ST38 168
ST39 Store Store Industrial Area,ST39 1
ST39 Labour Accommodations Labour Accommodation Industrial Area,ST39 270
ST26 Store Store Industrial Area,ST26 2
ST26 Labour Accommodations Labour Accommodation Industrial Area,ST26 190
ST2 Cold Stores Cold Rooms Industrial Area,ST26 86
The Team (Total Head counts-164)
Management
General Manager
(1)
Maintenance
Department
(94 no’s)
Cold Store
operation
Department
(54 no’s)
Leasing
Department
(3 no’s )
Project
Departments
(8 no’s)
Finance Department
(5 no’s)
The Team
● Management: General Manager is overall heading all the function the business.
● Finance Department: 5 no. of team, headed by Asst. Manager-Finance
● Leasing Department: 3 no. of team, headed by Manager-Leasing
● Maintenance Department: 94 no. of team managed by Civil Engineer and MEP engineer
● Cold Store Operation: 54 no. of team headed Manager-Cold Store
● Total Head Counts-164
IDENTIFICATION OF STRATEGIC OBJECTIVES
Financial
•Achieve business plan
on consistent basis.
•Maintain occupancy
target of 98% on
consistent basis
•Achieve Revenue as
per busines plan target
on consistent basis
•Identify all type of risk
and plan to mitigate
those risk to avoid any
kind of loss to business
Enhance value and
life of assets
•Consistent
improvement to
enhance life of
building and keep
updating as per
market demands
•Upgrade kitchen and
bath
•Change flooring
•Upgrade common
facilities like Gym,
Clubhouse, play area
•Not to over improve
Customer
•To achieve financial
objective, we must
serve as per target
customer satisfaction
•Establish strong
customer trust and
service delivery to
achieve above average
industry performance
in our segments
Internal improvement
process
• We must focus on
smoothing internal
process without
compromising on any
type of risk to satisfy
our customers and
meet our financial
objective.
Learning and growth
•To achieve our
Financial, Customer
and Internal
improvement process
strategic objective.
Always organization
need to learn and
adopt latest change.
•To adopt latest
changes, often training
and skill development
program must be
organized to trained
employee.
Marketing, Leasing and Revenue Analysis
02 03
05 06
REVENUE AND OCCUPANCY
ANALYSIS
01
PROCESS IMPROVEMENT PLAN
The MARKET
SWOT ANALYSIS
04
COMPETITOR ANALYSIS
LEASING AND MARKETING
STRATEGY
The Market
o Ewaan Garden villas (39 No.) are premium products in our portfolio and expected 98%
occupancy in year 2021 and future 2 years as most of the tenants belong to various
embassies and CEOs of companies who are really satisfied with our property.
o All villas (168 No.) in the Abu Hamour area cater to upper mid-scale market and is price
sensitive with a mix of Asian, Arab and Western tenants. From past 4 year, we have
observed downward trend in rental rate, we have reduced the rental price average 10% per
year in line with prevailing market rate. However, our target occupancy will be 98% for the
year 2021 and 2 years forward.
o Najma flats are in low mid-scale market and is price sensitive, but location close to day-to-
day conveniences makes it attractive. However, our target occupancy will be 99% for the
year 2021 and 2 years forward.
o IAD building is rented to government and lease agreement is presently under automatic
annual renewal basis. Hence, there will be assured occupancy of 100% for the year 2021
and 2 years forward.
The Market
o ST39 labour accommodations(270 rooms) is rented to internal group companies and assured 100%
occupancy as they will continue leasing in year 2021 and future years as their complete workers
accommodated in one location which is convenient for their business need.
o ST39 Warehouses (10 stores of SQM 730 each) is 70% leased to internal group companies and
30% to external, however our strategy to retain all tenants and maintain 100% occupancy through
out 2021 and in future years.
o ST38 Labour accommodations (168 rooms) is rented to external customers and our target to retain
80% of customers and maintain 98% occupancy throughout 2021 and future years.
o ST11 Warehouse (IPW1) is dry warehouse (SQM 27,500), open land yards (SQM 47,000) and
Labour accommodation (180 rooms) are rented to external customers and most of them are bound
by contract for the year 2021, hence there will be assured occupancy of 100% in year 2021.
However, in year 2022 and 2023, our strategy will be to retain these customers and maintain
100% occupancy throughout the years.
o Cold Stores( 2 no.) are located at Industrial Area, St02, which is priced location. Currently we are
maintaining 90% occupancy in New Cold Stores and 100% in small Cold stores with better
rental than market due advantage of location. Our strategy remain to retain 80% of existing
customers and maintain 90% occupancy throughout year 2021 and future two years
The Market (Porter's 5 forces analysis)
FORCE HOW EFFECTIVE
Risk of
New Entrants
MEDIUM
 There are no barriers to entry for Qatari companies/individuals in either residential, warehouses and labour accommodations but subject to
availability of good land parcels (location, accessibility, plot size etc.) However the use capital investment may deter the new entrants.
 In past 3 years, we have noticed that supply has added much bigger than demand. As per valustrat report, in first half of year around 80K
residential units are vacant and expected 7,250 new residential unit will be ready by end of year 2020.
Bargaining
Power of
Supplier
LOW
 We have observed in past 3 year as supplier bargaining power has decreased huge and we are trying to take advantage it and wherever possible,
we are signing the 2 years contract to fix the price. In fact, from past 6 months due to Covid-19 impact service cost has gone down which is
benefiting to us as a customer.
Bargaining
Power of
Customers
HIGH
 Present bargaining power of customers for residential villas being eroded in the short-to-medium term due to Covid -19 pandemic impact. Also, as
stated above, there is huge over supply of residential unit, which is resulting drop in rental price However, there is possibility mid of year 2021,
rental price will go up.
 Due to Covid-19 pandemic 1- and newly added property has resulted huge drop in rental price. However, Growth in demand for warehousing
expected due to nearing FIFA expected to moderate bargaining power of customers
Threat of
substitute
product
HIGH
 Since road connectivity has improved and customers having multiple choices with less rent in out of Doha City.
 Major substitute for mid-scale villas are older/cheaper stand-alone villas or luxury apartments at Pearl Qatar
Competitive
Rivalry with
existing
players
HIGH
 Major rival are Dar As Salam and Al Fardan compounds in Abu Hamour and nearby which has large no. of units and of bigger size with negotiable
rate
 Major rivals are Barwa and Ezdan that operate in the mid-scale apartment segment as they have expanded capacity with lower rate
 Major rivals in warehouse competitor are Gulf Warehousing Co. and MILAHA who awhile most others are small stand-alone players.
 Currently GWC and MILAHA are using penetrate pricing policy attract customers from all smaller players and occupy maximum share of market
The Competitions
RANGE COMPETIRORS
High-scale villa
 West bay Lagoon Villas managed Al Asmakh Real Estate Development
 West bay Lagoon Villas managed by The Pearl Gate Reality
Mid-scale Villa-
Apartments
 Dar Al Salam
 The Pearl Qatar
 Al Asmakh Real Estate Development
 Al Emadi Enterprises
Mid-scale apartments  Barwa Real Estate Company
 Ezdan Real Estate Company
Warehouses
 Gulf Warehousing Company
 MILAHA
 Barwa Commercial Avenue
Labour Accommodations
 Barwa Labour Accommodations
 Fragmented market ( No clear competitor)
The Competitions
Dar Al Salam The Pearl Qatar
Owners
Unidentified United Development Company, and listed on the Qatar
Stock Exchange
Prime Movers
Investor returns and market
expectations
Investor returns and market expectations
Business Objective/
Strategy
Economies of scale by having
many units with sharing of
centralized services
Mixed development on the marina, catering to mainly a
Western lifestyle preference
Strengths
High quality, many central
amenities, close to city center,
many schools, Property
appearance is attractive
High quality, many central amenities, retail (branded)
shopping, restaurants, marina, , Property appearance is
attractive
Weaknesses
Very large compound and limited
privacy/exclusivity
Very large property and no. of available unit for lease
Target Customer
Segment
Upper mid-scale tenants (with
children)
Mainly upper mid-scale to upscale customers with
Western preferences
Mid-Scale Villa-apartments
The Competitions
Mid-Scale Villa-apartments
Al Asmakh Real Estate Al Emadi Enterprises
Owners Privately held Privately held (Al Emadi family)
Prime Movers
Investor returns and market
expectations
Investor returns and market expectations
Business Objective/ Strategy
Operates in multiple real estate
segments, including villas and
apartments, towers
Operates in multiple real estate
segments, including villas and apartments
Strengths
Brand recognition, strong reputation,
market presence, good quality,
existence from past 30 years
Brand recognition, strong reputation,
market presence, good quality
Weaknesses
May not have sufficient focus on any
particular segment / brand dilution.
May not have sufficient focus on any
particular segment / brand dilution.
Target Customer Segment
Mostly upper mid-scale villas, apartment
and commercial customers
Mostly mid-scale (some up-scale)
apartment and commercial customers
The Competitions
Mid-Scale apartments
Barwa Real Estate Company Ezdan Real Estate Company
Owners Listed on Qatar Stock Exchange Listed on Qatar Stock Exchange
Prime Movers
Investor returns and market expectations Investor returns and market expectations
Business Objective/ Strategy
Operates in multiple real estate
segments
Operates in multiple real estate segments
Strengths
Government backed, brand recognition,
market presence
Brand recognition, market presence
Weaknesses
Large-scale developments available to
market
Quality and standard of developments not
consistent
Target Customer Segment
Mostly mid-scale customers
development
Mostly mid-scale apartment customers
The Competitions
Warehouses
Gulf Warehousing Company and
MILAHA
Barwa Commercial Avenue
Owners
Both companies are Listed on Qatar
Stock Exchange
Barwa Real Estate Company
Prime Movers
Investor returns and market
expectations
Investor returns and market
expectations
Business Objective/
Strategy
Specialised logistics company
providing warehousing, cold storage
and open yard space
Offer offices and showrooms in close
proximity to the Industrial Area
Strengths
Brand recognition, market presence Brand recognition, market presence,
ability to offer large leasable areas
Weaknesses
Need to fill large-scale development
can depress rental rates however
they are penetrating price to capture
market
Need to fill large-scale development
can depress rental rates
Target Customer Segment
Industrial / commercial customers Cater to the commercial segment near
the Industrial Area
REVENUE, OCCUPANCY AND OPPORTUNITY LOSS ANALYSIS
6M 7M 7M
8M 9M
2020 2019 2018 2017 2016
Annual Revenue
Cascade I
Year 2020 2019 2018 2017 2016
Revenue growth/decline% Vs 2016 -30% -26% -20% -7%
Annual Revenue 6,241,719 6,609,311 7,148,373 8,308,969 8,925,383
Occupancy% 95.5% 96.2% 92.4% 94.9% 98.2%
Opportunity Loss 287,692 258,000 534,021 430,133 164,633
Avg. monthly rent growth/decline % Vs 2016 -28% -24% -15% -4%
Average Monthly Rent 9,716 10,219 11,432 13,005 13,527
Vacant no. of Units 14 16 22 16 15
Total days vacant in year 914 786 1,553 1,036 377
Average days vacant in a year 65 49 71 65 25
95.5% 96.2%
92.4%
94.9%
98.2%
2020 2019 2018 2017 2016
Occupancy%
REVENUE, OCCUPANCY AND OPPORTUNITY LOSS ANALYSIS
4M 4M 4M
5M 5M
2020 2019 2018 2017 2016
Cascade II
Year 2020 2019 2018 2017 2016
Revenue growth/decline% Vs 2016 -25% -21% -17% -2%
Annual Revenue 3,537,784 3,755,729 3,931,836 4,614,004 4,730,493
Occupancy% 96.1% 96.7% 93.8% 94.4% 91.6%
Opportunity Loss 145,608 126,533 250,333 273,767 428,583
Avg. monthly rent growth/decline % Vs 2016 -29% -25% -19% -5%
Average Monthly Rent 9,592 10,110 10,891 12,729 13,435
Vacant no. of Units 8 8 11 13 13
Total days vacant in year 460 384 720 656 984
Average days vacant in a year 58 48 65 50 76
96.1% 96.7%
93.8% 94.4%
91.6%
2020 2019 2018 2017 2016
Occupancy%
REVENUE, OCCUPANCY AND OPPORTUNITY LOSS ANALYSIS
3M 3M 3M
3M 4M
2020 2019 2018 2017 2016
Annual Revenue
Ruby
Year 2020 2019 2018 2017 2016
Revenue growth/decline% Vs 2016 -30% -26% -18% -8%
Annual Revenue 2,512,816 2,674,464 2,966,426 3,295,313 3,599,275
Occupancy% 93.4% 94.5% 98.2% 92.4% 96.6%
Opportunity Loss 180,800 157,817 51,850 184,100 127,233
Avg. monthly rent growth/decline % Vs 2016 -28% -24% -19% -7%
Average Monthly Rent 8,017 8,429 8,984 10,355 11,091
Vacant no. of Units 7 7 7 11 9
Total days vacant in year 678 557 183 778 347
Average days vacant in a year 97 80 26 71 39
93.4% 94.5%
98.2%
92.4%
96.6%
2020 2019 2018 2017 2016
Occupancy%
REVENUE, OCCUPANCY AND OPPORTUNITY LOSS ANALYSIS
92.3% 94.5%
98.2%
87.0%
97.0%
2020 2019 2018 2017 2016
Occupancy%
2M 2M 2M 2M
2M
2020 2019 2018 2017 2016
Annual Revenue
Sapphire
Year 2020 2019 2018 2017 2016
Revenue growth/decline% Vs 2016 -26% -21% -14% -9%
Annual Revenue 1,776,889 1,898,827 2,071,919 2,182,904 2,409,526
Occupancy% 92.3% 94.5% 98.2% 87.0% 97.0%
Opportunity Loss 150,133 113,050 37,967 332,500 79,567
Avg. monthly rent growth/decline % Vs 2016 -23% -19% -15% 1%
Average Monthly Rent 8,029 8,383 8,791 10,481 10,371
Vacant no. of Units 6 7 4 9 4
Total days vacant in year 563 399 134 950 217
Average days vacant in a year 94 57 34 106 54
REVENUE, OCCUPANCY AND OPPORTUNITY LOSS ANALYSIS
3M 3M 3M 4M 4M
2020 2019 2018 2017 2016
Annual Revenue
Diamond
Year 2020 2019 2018 2017 2016
Revenue growth/decline% Vs 2016 -33% -26% -18% -11%
Annual Revenue 2,825,090 3,124,107 3,464,573 3,774,588 4,222,363
Occupancy% 92.2% 95.7% 96.8% 89.9% 95.6%
Opportunity Loss 243,467 141,100 109,667 412,650 188,467
Avg. monthly rent growth/decline % Vs 2016 -30% -26% -19% -5%
Average Monthly Rent 7,991 8,503 9,308 10,904 11,487
Vacant no. of Units 15 9 13 15 14
Total days vacant in year 913 498 376 1,179 514
Average days vacant in a year 61 55 29 79 37
92.2%
95.7% 96.8%
89.9%
95.6%
2020 2019 2018 2017 2016
Occupancy%
REVENUE, OCCUPANCY AND OPPORTUNITY LOSS ANALYSIS
94.8% 96.9%
93.4%
88.7% 88.2%
2020 2019 2018 2017 2016
Occupancy%
2M 2M 2M 2M 2M
2020 2019 2018 2017 2016
Annual Revenue
Pearl Garden
Year 2020 2019 2018 2017 2016
Revenue growth/decline% Vs 2016 -24% -17% -11% -5%
Annual Revenue 1,653,626 1,815,766 1,937,653 2,080,901 2,187,257
Occupancy% 94.8% 96.9% 93.4% 88.7% 88.2%
Opportunity Loss 91,500 57,633 136,458 256,258 299,867
Avg. monthly rent growth/decline % Vs 2016 -30% -25% -17% -6%
Average Monthly Rent 9,089 9,757 10,803 12,173 12,954
Vacant no. of Units 3 6 4 6 12
Total days vacant in year 305 182 385 661 692
Average days vacant in a year 102 30 96 110 58
REVENUE, OCCUPANCY AND OPPORTUNITY LOSS ANALYSIS
98.3% 99.3% 86.4%
37.0%
100.0%
2020 2019 2018 2017 2016
Occupancy%
10M 10M
8M
4M
14M
2020 2019 2018 2017 2016
Annual Revenue
Ewaan
Year 2020 2019 2018 2017 2016
Revenue growth/decline% Vs 2016 -29% -30% -41% -72%
Annual Revenue 9,761,884 9,751,411 8,172,015 3,872,351 13,832,400
Occupancy% 98.3% 99.3% 86.4% 37.0% 100.0%
Opportunity Loss 160,550 69,700 1,353,100 6,279,000 -
Avg. monthly rent growth/decline % Vs 2016 -28% -29% -31% -27%
Average Monthly Rent 21,202 20,985 20,353 21,691 29,556
Vacant no. of Units 5 2 12 34 -
Total days vacant in year 247 102 1,933 8,970 -
Average days vacant in a year 49 51 161 264 -
REVENUE, OCCUPANCY AND OPPORTUNITY LOSS ANALYSIS
1M 1M 1M 1M 1M
2020 2019 2018 2017 2016
Annual Revenue
Najma
Year 2020 2019 2018 2017 2016
Revenue growth/decline% Vs 2016 -24% -19% -12% -8%
Annual Revenue 1,069,113 1,140,444 1,246,145 1,301,744 1,414,436
Occupancy% 100.0% 99.7% 99.0% 95.9% 99.9%
Opportunity Loss - 3,600 12,667 54,817 1,000
Avg. monthly rent growth/decline % Vs 2016 -24% -19% -11% -4%
Average Monthly Rent 4,455 4,767 5,245 5,652 5,898
Vacant no. of Units - 1 2 4 1
Total days vacant in year - 24 76 299 5
Average days vacant in a year - 24 38 75 5
100.0% 99.7% 99.0%
95.9%
99.9%
2020 2019 2018 2017 2016
Occupancy%
REVENUE, OCCUPANCY AND OPPORTUNITY LOSS ANALYSIS
TWIN VILLA
Year 2020 2019 2018 2017 2016
Revenue growth/decline% Vs 2016 -54% -100% -17% -1%
Annual Revenue 96,000 - 174,000 205,500 208,425
Occupancy% 100.0% 100.0% 100.0% 100.0% 100.0%
Opportunity Loss 96,000 192,000 16,000 -
Avg. monthly rent growth/decline % Vs 2016 -54% -100% -17% -1%
Average Monthly Rent 8,000 - 14,500 17,125 17,369
Vacant no. of Units - - - - -
Total days vacant in year - - - - -
Average days vacant in a year - - - - -
100.0% 100.0% 100.0% 100.0% 100.0%
2020 2019 2018 2017 2016
Occupancy%
96K
0K
174K
206K 208K
2020 2019 2018 2017 2016
Annual Revenue
REVENUE, OCCUPANCY AND OPPORTUNITY LOSS ANALYSIS
100% 100% 100% 100% 100%
2020 2019 2018 2017 2016
Occupancy%
5M 5M 5M 5M 5M
2020 2019 2018 2017 2016
Annual Revenue
IAD Building
Year 2020 2019 2018 2017 2016
Revenue growth/decline% Vs 2016 0% 0% 0% 0%
Annual Revenue 5,460,840 5,460,840 5,460,840 5,460,840 5,460,840
Occupancy% 100% 100% 100% 100% 100%
Opportunity Loss - - - - -
Avg. monthly rent growth/decline % Vs 2016 0% 0% 0% 0%
Average Monthly Rent 5,460,840 5,460,840 5,460,840 5,460,840 5,460,840
Vacant no. of Units - - - - -
Total days vacant in year - - - - -
Average days vacant in a year - - - - -
REVENUE, OCCUPANCY AND OPPORTUNITY LOSS ANALYSIS
97.5%
100.0% 100.0% 100.0% 100.0%
2020 2019 2018 2017 2016
Occupancy%
11M
17M 17M 17M 17M
2020 2019 2018 2017 2016
Annual Revenue
IPW1 Warehouse
Year 2020 2019 2018 2017 2016
Revenue growth/decline% Vs 2016 -37% 0% 0% 0%
Annual Revenue 10,800,202 17,048,256 17,048,256 17,048,256 17,048,256
Occupancy% 97.5% 100.0% 100.0% 100.0% 100.0%
Opportunity Loss 232,310 - - - -
Avg. monthly rent growth/decline % Vs 2016 -31% 0% 0% 0%
Average Monthly Rent in SQM 35.5 51.7 51.7 51.7 51.7
Vacant Area in SQM 13,753 - - - -
Total days vacant in year 15 - - - -
Average days vacant in a year 7.5 - - - -
REVENUE, OCCUPANCY AND OPPORTUNITY LOSS ANALYSIS
100.0% 100.0% 100.0% 100.0% 100.0%
2020 2019 2018 2017 2016
Occupancy%
4M
5M
7M
8M 8M
2020 2019 2018 2017 2016
Annual Revenue
ST39 Labour Accommodations
Year 2020 2019 2018 2017 2016
Revenue growth/decline% Vs 2016 -54% -33% -16% -1%
Annual Revenue 3,564,000 5,173,005 6,560,000 7,683,000 7,776,000
Occupancy% 100.0% 100.0% 100.0% 100.0% 100.0%
Opportunity Loss - - - - -
Avg. monthly rent growth/decline % Vs 2016 -54% -33% -16% -1%
Average Monthly Rent 1,100 1,597 2,025 2,371 2,400
Vacant no. of Units - - - - -
Total days vacant in year - - - - -
Average days vacant in a year - - - - -
REVENUE, OCCUPANCY AND OPPORTUNITY LOSS ANALYSIS
98.1% 99.0% 97.5% 81.1% 100.0%
2020 2019 2018 2017 2016
Occupancy%
4M
5M
7M
8M 8M
2020 2019 2018 2017 2016
Annual Revenue
ST39 Warehouse
Year 2020 2019 2018 2017 2016
Revenue growth/decline% Vs 2016 -30% -21% -18% -23%
Annual Revenue 4,039,748 4,525,922 4,728,415 4,433,816 5,741,387
Occupancy% 98.1% 99.0% 97.5% 81.1% 100.0%
Opportunity Loss 70,157 44,321 112,952 789,409
Avg. monthly rent growth/decline % Vs 2016 -28% -20% -16% -5%
Average Monthly Rent 34,334 38,100 40,414 45,577 47,845
Vacant no. of Units (each unit SQM 730) 2 1 3 5 -
Total days vacant in year 61 37 85 648 -
Average days vacant in a year 30 32 30 130 -
REVENUE, OCCUPANCY AND OPPORTUNITY LOSS ANALYSIS
100.0% 100.0% 100.0% 100.0% 75.0%
2020 2019 2018 2017 2016
Occupancy%
106K 103K 100K 96K
79K
2020 2019 2018 2017 2016
Annual Revenue
ST39 Cafeteria
Year 2020 2019 2018 2017 2016
Revenue growth/decline% Vs 2016 34% 31% 26% 22%
Annual Revenue 105,600 103,488 99,584 96,000 79,000
Occupancy% 100.0% 100.0% 100.0% 100.0% 75.0%
Opportunity Loss 24,000
Avg. monthly rent growth/decline % Vs 2016 0% -2% -5% -9%
Average Monthly Rent 8,800 8,624 8,299 8,000 8,778
Vacant no. of Unit 1
Total days vacant in year 90
Average days vacant in a year - - - - 90
REVENUE, OCCUPANCY AND OPPORTUNITY LOSS ANALYSIS
97.0% 97.3% 85.9% 99.1%
54.0%
2020 2019 2018 2017 2016
Occupancy%
2M 2M
2M
3M
2M
2020 2019 2018 2017 2016
Annual Revenue
ST38 Labour Accommodations
Year 2020 2019 2018 2017 2016
Revenue growth/decline% Vs 2016 26% 31% 57% 87%
Annual Revenue 1,971,676 2,046,010 2,448,600 2,924,700 1,561,120
Occupancy% 97.0% 97.3% 85.9% 99.1% 54.0%
Opportunity Loss 61,612 73,035 412,982 26,991 1,386,000
Avg. monthly rent growth/decline % Vs 2016 -14% -11% -3% 0%
Average Monthly Rent 1,284 1,328 1,449 1,500 1,500
Vacant no. of Units 5 5 24 2 77
Total days vacant in year 1,440 1,650 8,550 540 27,720
Average days vacant in a year 283 360 360 360 358
REVENUE, OCCUPANCY AND OPPORTUNITY LOSS ANALYSIS
ST38 Store
Year 2020 2019 2018 2017 2016
Revenue growth/decline% Vs 2017 980% 1050% 1100%
Annual Revenue 302,400 322,000 336,000 28,000
Occupancy% 100.0% 100.0% 100.0% 100.0%
Opportunity Loss - - - -
Avg. monthly rent growth/decline % Vs 2016 -10% -4% 0%
Average Monthly Rent 25,200 26,833 28,000 28,000
Vacant no. of Units - - - -
Total days vacant in year
Average days vacant in a year - - - - -
100.0% 100.0% 100.0% 100.0%
2020 2019 2018 2017 2016
Occupancy%
302K 322K 336K
28K
2020 2019 2018 2017 2016
Annual Revenue
REVENUE, OCCUPANCY AND OPPORTUNITY LOSS ANALYSIS
ST11 Labour Accommodations
Year 2020 2019 2018 2017 2016
Revenue growth/decline% Vs 2016 -28% -12%
Annual Revenue 2,257,411 2,750,040 3,127,580 - -
Occupancy% 96.7% 95.0% 96.5%
Opportunity Loss 77,842 144,739 108,034 - -
Avg. monthly rent growth/decline % Vs 2016 -28% -11%
Average Monthly Rent 1,081 1,340 1,500 - -
Vacant no. of Units 6 9 6 - -
Total days vacant in year 2,160 3,240 2,160 - -
Average days vacant in a year 360.0 360 360 - -
96.7%
95.0%
96.5%
2020 2019 2018 2017 2016
Occupancy%
2M
3M
3M
2020 2019 2018 2017 2016
Annual Revenue
REVENUE, OCCUPANCY AND OPPORTUNITY LOSS ANALYSIS
ST02 Cold Stores
Year 2020 2019
Revenue growth/decline% Vs 2019 -8%
Annual Revenue 10,390,699 11,312,048
Occupancy% 86.0% 78.5%
Opportunity Loss 483,288 1,657,179
86.0%
78.5%
2020 2019
Occupancy%
10M
11M
2020 2019
Annual Revenue
DEBTS LOSS ANALYSIS
75,000
-
74,903
-
107,200 106,000
363,103
0.19%
0.00%
0.17%
0.00%
0.25% 0.28%
0.22%
2015 2016 2017 2018 2019 2020 Total
Bad debts % on external revenue
For year, 2021 and future
years our target to review
each customer persona very
carefully and know their
capability to pay rent on time
to avoid any type doubt full
debts.
Ensure timely collection as
per SOP and agreements
signed by both parties.
Strong follow up and timely
escalation to management for
any doubtful debts.
Constant follow up with legal
for ensure timely submission
of case against default
customers
Year 2015 2016 2017 2018 2019 2020 Total
Bad debts 75,000 - 74,903 - 107,200 106,000 363,103
% on external
revenue 0.19% 0.00% 0.17% 0.00% 0.25% 0.28% 0.22%
Total External
Revenue 39,474,848 43,280,420 43,212,991 38,377,092 164,345,351
SWOT ANALYSIS
WEKNESSES
THREATS
Strengths Weaknesses
• Generally good locations at key sites, basically residential
properties are near to schools, hospitals and malls
• Good reputation for maintenance and responsiveness with
existing tenants
• Offer villa-apartments with benefits of a small-to-medium
sized gated community
• Offer warehouses with value-added benefits of
offices/showrooms and beside labour accommodations
• Not much branding
• Major neighboring villa competitor in Abu Hamour has
much better facilities
• Spex and design above 13 years old for Residential
properties
• Bulk residential tenants can vacate resulting in sudden drop
in occupancy
• IPW1 Warehouses have restriction due to limitation of
power
Opportunities Threats
• Build on existing good reputation
• Build closer communities within the compound making it
emotionally harder for tenants to vacate
• Enhance maintenance service and response
• Enhance properties facilities to make more attractive to
new tenants and existing tenant
• Retain 80% of tenant which is better for organization.
• Noticeable Market over supply 80,000 units (villas,
apartments) including neighboring villas
• In past six months, approx. 2,250 apartments and 700 villas
added and majority of these units Lusail, The Pearl and
West Bay
• External factors and events lowering demand/economic
growth
• Due to no. of layoff in jobs, more tenants are vacating than
new tenants are coming.
LEASING STRATEGY
Achieve 100%
target of revenue
Achieve 98%
occupancy
overall
Identify
opportunities to
improve the
customer journey
Quarterly update
to higher
management on
market updates
Establish
contacts and
build relationship
Classify
properties in 3-4
categories
Nail down to fit in
prevailing market
LEASING STRATEGY
• Achieve 100% target of revenue and maintain 98% occupancy overall properties
o As expected, market will lift in year 2021 since FIFA is nearing. Hence our Leasing strategy to retain 75% of
existing customer and target new customers as per business plan.
o Overall target occupancy 98% across all residential and commercial properties (except Cold stores) in year 2021
and 2 years forward.
o Specific to Cold stores, our target to focus on multiple customers who can pay premium price considering priced
location of GUC cold stores.
• Identify opportunities to improve the customer journey
o Asses each single customer who visit our property and target them to convert into real customers by
understanding their needs and settling them to available properties with us.
• Nail down to fit in prevailing market
o Quarterly review and identify, how we fit in market (through detailed SWOT analysis)
LEASING STRATEGY
• Classify properties in 3-4 categories
o Break down our properties into 3-4 classifications based on layout, size and location. Accordingly, need to target
customers to achieve business plan target.
• Establish contacts and build relationship
o Asses each and every single customer who visit our property and target them to convert into real customers by
understanding their needs and settling them to available properties available with us
• Establish contacts and build relationship
o Focus on Exceptional Communication. Timely, efficient communication should be a priority. Maintain a Positive
Attitude. ...
• Quarterly update to higher management on market updates
o Regular updates on bench market rate, new competitors, new stocks added in Qatar real estate markets.
Accordingly update it to higher management for review and assessments
MARKETING STRATEGY (THROUGH ONLINE MEDIA)
From past 5 years, we are
using “Property finder”
real estate portal and
observed most effective
source to promote GUC
properties and each to
large number of
customers.
We spent QAR 44K for
annual subscriptions
Qatar living classified is
2nd best source to promote
GUC properties and reach
to maximum number of
customers.
We spent QAR 15K for
annual subscriptions
We use social media
source also to promote
GUC properties and
generate leads and reach
to large number of
customers.
We spent approx. Amount
of QAR 20K on social
media
MARKETING STRATEGY (THROUGH VARIOUS SOURCES)
Specific to commercial
properties, as on when
required, we promote GUC
properties by giving ad. on
GULF TIMES
We spent approx. amount
QAR 10K per year.
We lease our property with
the help of Real estate
agent as well.
Approx. QAR80K per year
we pay as real estate
agent fee
We use several way to
promote our properties by
way of banner ads.,
pamphlet. Advertising
board on building
Approx. QAR 15K per
year, we spent to use
MARKETING STRATEGY (YEAR 2020 AND PAST 4 YEARS COST)
Categories Act-20 Act-19 Act-18 Act-17 Act-16
Print advertisement 7,155 6,599 50,252 18,832 9,909
Online advertisement 69,372 67,244 66,413 114,492 73,372
Real Estate Brokerage 72,071 98,820 97,833 103,750 78,500
Total 148,599 172,663 214,498 237,074 161,781
Increase/(Decrease)% -14% -20% -10% 47%
148,599
172,663
214,498
237,074
161,781
-14% -20% -10% 47%
ACT-20 ACT-19 ACT-18 ACT-17 ACT-16
Total marketing cost Increase/(Decrease)%
MARKETING STRATEGY (YEAR 2021 AND 2 YEARS
FORWARD)
For year, 2021 and 2 years forward, we will be continuing same
platform aggressively to promote GUC commercial and residential
properties to reach large number of potential customers and convert
them into real customers
LEASING DEPARTMENT PROCESS IMPROVEMENT AND IMPLEMENTATION PLAN
1 2 3
Lease agreements
100% renewals before expiry of
Lease contracts
0% Erros in Lease
agreements
100% compliance in collection
documents as per SOP
Rent Colletions
Specific to Cold stores, ensure to
collect PDC as rental and undated
deposit as security
100% ensure, Cheques are
A/C payee, no. error in
cheque.
100% timely collections
Approvals/Esclations
Ensure wherever any deviation,
prior approval must be obtained
Ensure, wherever required, it
must be esclated to GM and
CEO
Ensure all obtained approvals
are attached with records and
kept properly for audit purpose
Leasing process
Develop better presentation skill by
way of communications
Learn presentation skills in
power points, excel.
Keep upto date, with latest
market trends, geo political
knowledge
LEASING DEPARTMENT PROCESS IMPROVEMENT AND IMPLEMENTATION PLAN
1 2 3
Identify risk
Always be vigilant to understand
and identify risk associated with our
property or customers
Maintian risk register to update
higher management on
specific interval.
Plan and follow up until, risk is
mitigated and close
Learn and keep upto
date yourself with
policies and SOP
On regular interval, please review
Corporate policy
On regular basis, please
reading Leasing SOP
Suggest, if any changes
required in policies and SOP
More foruce on
customer perosnal
profile
Improve focuse on customer
persona profile
Know customer interst, carrer,
about family member
Must know cabilites of
customer to pay monthly rent
Property Improvement
Suggestion
As and often visit, competitors
property
To know their facilites,
Keep suggesting maintenance
department for improvement
plan as per customer feedback
Keep knowledge about latest
change and design in real
estate portfolio
7,381,638
6,483,722
5,180,692
4,854,237
4,444,503
82.7% 78.0% 72.5% 72.3% 71.2%
2016 2017 2018 2019 2020
EBITDA EBITDA %
8.0%
8.7%
7.4% 7.1%
6.5%
2016 2017 2018 2019 2020
NET YIELD % ON ASSETS MARKET
VALUE ( L +B)
FINANCIAL PERFORMANCE OF CASCADE I COMPOUND
-20% -25% -27% -27%
93M
75M 70M 68M 68M
2016 2017 2018 2019 2020
Growth/Decline Vs 2016 (Land+Build)
Market value for land & Building for year 2020 is considered based on year 2019 since latest number are not available
Cascade I 2016 2017 2018 2019 2020
Building Cost 21,569,056 15,821,565 14,555,840 14,636,364 14,636,364
LandCost 71,342,600 58,752,432 55,395,096 53,628,143 53,628,143
(Land+Build) 92,911,656 74,573,996 69,950,935 68,264,507 68,264,507
Growth/Decline Vs 2016 -20% -25% -27% -27%
Growth/Decline Vs LY -20% -6% -2% 0%
3,907,412
3,594,186
2,713,832 2,695,719
2,515,307
82.6% 77.9% 69.0% 71.9% 71.1%
2016 2017 2018 2019 2020
EBITDA EBITDA %
7.3%
8.3%
6.7% 6.8%
6.4%
2016 2017 2018 2019 2020
NET YIELD % ON ASSETS MARKET
VALUE (L+B)
FINANCIAL PERFORMANCE OF CASCADE II COMPOUND
-19% -24% -26% -26%
53M
43M 41M 39M 39M
2016 2017 2018 2019 2020
Growth/Decline Vs 2016 (Land+Build)
Market value for land & Building for year 2020 is considered based on year 2019 since latest number are not available
Cascade II 2016 2017 2018 2019 2020
Building Cost 12,108,944 9,178,435 8,444,160 8,363,636 8,363,636
LandCost 41,387,400 34,083,568 32,135,904 31,110,857 31,110,857
(Land+Build) 53,496,344 43,262,004 40,580,065 39,474,493 39,474,493
Growth/Decline Vs 2016 -19% -24% -26% -26%
Growth/Decline Vs LY -19% -6% -3% 0%
2,981,981
2,531,334
2,145,462
1,787,261 1,698,453
82.8% 76.8% 72.3% 66.6% 67.6%
2016 2017 2018 2019 2020
EBITDA EBITDA %
8.2%
8.7%
7.4%
6.4% 6.1%
2016 2017 2018 2019 2020
NET YIELD % ON ASSETS MARKET
VALUE (L+B)
FINANCIAL PERFORMANCE OF RUBY COMPOUND
-17% -20% -24% -24%
37M
30M 29M 28M 28M
2016 2017 2018 2019 2020
Growth/Decline Vs 2016 (Land+Build)
Market value for land & Building for year 2020 is considered based on year 2019 since latest number are not available
Ruby 2016 2017 2018 2019 2020
Building Cost 7,859,100 6,817,000 5,500,000 5,500,000 5,500,000
LandCost 28,695,000 23,593,000 23,593,000 22,318,000 22,318,000
(Land+Build) 36,554,100 30,410,000 29,093,000 27,818,000 27,818,000
Growth/Decline Vs 2016 -17% -20% -24% -24%
Growth/Decline Vs LY -17% -4% -4% 0%
1,992,822
1,666,770
1,492,845
1,238,198
1,132,545
82.7% 76.4% 72.1% 64.9% 63.7%
2016 2017 2018 2019 2020
EBITDA EBITDA %
7.9% 7.7%
6.9%
5.9%
5.4%
2016 2017 2018 2019 2020
NET YIELD % ON ASSETS MARKET VALUE
(L+B)
FINANCIAL PERFORMANCE OF SAPPHIRE COMPOUND
-20% -20% -23% -23%
27M
22M 22M 21M 21M
2016 2017 2018 2019 2020
Growth/Decline Vs 2016 (Land+Build)
Market value for land & Building for year 2020 is considered based on year 2019 since latest number are not available
Sapphire 2016 2017 2018 2019 2020
Building Cost 6,817,200 5,000,000 5,000,000 5,000,000 5,000,000
Land Cost 20,363,000 16,743,000 16,743,000 15,838,000 15,838,000
(Land+Build) 27,180,200 21,743,000 21,743,000 20,838,000 20,838,000
Growth/Decline Vs 2016 -20% -20% -23% -23%
Growth/Decline Vs LY -20% 0% -4% 0%
3,450,540
2,899,996
2,414,017
2,097,484
1,852,748
81.7% 76.8% 69.7% 67.5% 65.6%
2016 2017 2018 2019 2020
EBITDA EBITDA %
7.5% 7.5%
6.4%
5.8%
5.2%
2016 2017 2018 2019 2020
NET YIELD % ON ASSETS MARKET
VALUE (L+B)
FINANCIAL PERFORMANCE OF DIAMOND COMPOUND
-18% -20% -23% -23%
47M
39M 38M 36M 36M
2016 2017 2018 2019 2020
Growth/Decline Vs 2016 (Land+Build)
Market value for land & Building for year 2020 is considered based on year 2019 since latest number are not available
Diamond 2016 2017 2018 2019 2020
Building Cost 9,999,825 8,200,000 7,200,000 7,200,000 7,200,000
LandCost 36,949,000 30,380,000 30,380,000 28,738,000 28,738,000
(Land+Build) 46,948,825 38,580,000 37,580,000 35,938,000 35,938,000
Growth/DeclineVs 2016 -18% -20% -23% -23%
Growth/DeclineVs LY -18% -3% -4% 0%
FINANCIAL PERFORMANCE OF PEARL GARDEN COMPOUND
5.8%
4.4%
3.8% 3.6%
3.0%
2016 2017 2018 2019 2020
NET YIELD % ON ASSETS MARKET
VALUE (L+B)
1,814,928
1,282,672
1,055,235
952,539
789,414
83.0% 61.6% 54.5% 51.8% 47.7%
2016 2017 2018 2019 2020
EBITDA EBITDA %
-7% -11% -17% -17%
31M 29M 28M 26M 26M
2016 2017 2018 2019 2020
Growth/Decline Vs 2016 (Land+Build)
Market value for land & Building for year 2020 is considered based on year 2019 since latest number are not available
Pearl Garden 2,016 2,017 2,018 2,019 2,020
Building Cost 6,922,996 5,978,951 5,978,951 5,349,588 5,349,588
Land Cost 24,529,741 23,303,254 22,076,767 20,850,280 20,850,280
(Land+Build) 31,452,737 29,282,205 28,055,718 26,199,867 26,199,867
Growth/Decline Vs 2016 -7% -11% -17% -17%
Growth/Decline Vs LY -7% -4% -7% 0%
FINANCIAL PERFORMANCE OF TWIN VILLAS
5.5%
6.2%
4.9%
2.6% 2.6%
2016 2017 2018 2019 2020
NET YIELD % ON ASSETS MARKET VALUE
(L+B)
333,610 326,046
256,893
135,262 136,703
83.6% 79.3% 68.0% 70.4% 71.2%
2016 2017 2018 2019 2020
EBITDA EBITDA %
-13% -14% -14% -14%
6M
5M 5M 5M 5M
2016 2017 2018 2019 2020
Growth/Decline Vs 2016 (Land+Build)
Market value for land & Building for year 2020 is considered based on year 2019 since latest number are not available
Twin Villa 2016 2017 2018 2019 2020
Building Cost 1,224,000 1,000,000 900,000 900,000 900,000
LandCost 4,839,000 4,301,000 4,301,000 4,301,000 4,301,000
(Land+Build) 6,063,000 5,301,000 5,201,000 5,201,000 5,201,000
Growth/Decline Vs 2016 -13% -14% -14% -14%
Growth/Decline Vs LY -13% -2% 0% 0%
FINANCIAL PERFORMANCE OF EWAAN COMPOUND
11,592,112
2,876,716
5,712,551
7,472,806 7,715,573
83.8% 74.3% 69.9% 78.3% 79.0%
2016 2017 2018 2019 2020
EBITDA EBITDA %
4.0%
1.2%
2.4%
3.2% 3.4%
2016 2017 2018 2019 2020
NET YIELD % ON ASSETS MARKET VALUE
(L+B)
-16% -18% -21% -21%
291M
243M 238M 230M 230M
2016 2017 2018 2019 2020
Growth/Decline Vs 2016 (Land+Build)
Market value for land & Building for year 2020 is considered based on year 2019 since latest number are not available
Ewan 2016 2017 2018 2019 2020
Building Cost 65,580,000 50,000,000 45,000,000 45,000,000 45,000,000
LandCost 225,600,000 193,371,000 193,371,000 185,314,000 185,314,000
(Land+Build) 291,180,000 243,371,000 238,371,000 230,314,000 230,314,000
Growth/Decline Vs 2016 -16% -18% -21% -21%
Growth/Decline Vs LY -16% -2% -3% 0%
1,189,929
938,058
861,369
607,835
747,169
84.1% 72.1% 69.1% 52.8% 69.9%
2016 2017 2018 2019 2020
EBITDA EBITDA %
FINANCIAL PERFORMANCE OF NAJMA FLATS
4.8%
3.8%
4.0%
3.1%
3.8%
2016 2017 2018 2019 2020
NET YIELD % ON ASSETS MARKET
VALUE (L+B)
0% -14% -20% -20%
25M 25M
21M 20M 20M
2016 2017 2018 2019 2020
Growth/Decline Vs 2016 (Land+Build)
Market value for land & Building for year 2020 is considered based on year 2019 since latest number are not available
Najma Flat 2016 2017 2018 2019 2020
Building Cost 4,756,000 4,756,000 2,395,460 2,096,040 2,096,040
LandCost 20,147,000 20,147,000 18,962,000 17,777,000 17,777,000
(Land+Build) 24,903,000 24,903,000 21,357,460 19,873,040 19,873,040
Growth/Decline Vs 2016 0% -14% -20% -20%
Growth/Decline Vs LY 0% -14% -7% 0%
FINANCIAL PERFORMANCE OF IAD (C RING OFFICE)
4,927,520
4,474,525
4,846,343 4,988,358 4,871,946
90.2% 81.9% 88.7% 91.3% 89.2%
2016 2017 2018 2019 2020
EBITDA EBITDA %
3.5%
3.9%
4.4%
4.7% 4.6%
2016 2017 2018 2019 2020
NET YIELD % ON ASSETS MARKET VALUE
(L+B)
-19% -22% -24% -24%
141M
114M 110M 106M 106M
2016 2017 2018 2019 2020
Growth/Decline Vs 2016 (Land+Build)
Market value for land & Building for year 2020 is considered based on year 2019 since latest number are not available
IAD Building 2016 2017 2018 2019 2020
Building Cost 13,443,760 13,443,760 9,777,325 8,555,171 8,555,171
Land Cost 127,459,000 100,146,000 100,146,000 97,870,000 97,870,000
(Land+Build) 140,902,760 113,589,760 109,923,325 106,425,171 106,425,171
Growth/Decline Vs 2016 -19% -22% -24% -24%
Growth/Decline Vs LY -19% -3% -3% 0%
FINANCIAL PERFORMANCE OF ST39 PROPERTIES
11,506,239
10,122,886
8,604,298
6,129,293
5,589,315
84.7% 82.9% 75.6% 62.8% 72.5%
2016 2017 2018 2019 2020
EBITDA EBITDA %
12.2%
12.9%
11.5%
8.8%
8.0%
2016 2017 2018 2019 2020
NET YIELD % ON ASSETS MARKET VALUE
(L+B)
Market value for land & Book value of Building for year 2020 is considered based on year 2019 since latest number are not available
ST39 Projects 2016 2017 2018 2019 2020
Building Cost 35,904,130 35,904,130 35,904,130 35,904,130 35,904,130
Land Cost 58,126,000 42,625,000 38,750,000 33,907,000 33,907,000
(Land+Build) 94,030,130 78,529,130 74,654,130 69,811,130 69,811,130
Growth/Decline Vs 2016 1% -4% -11% -11%
Growth/Decline Vs LY -16% -5% -6% 0%
-24% -31% -37% -37%
94M
79M 75M 70M 70M
2016 2017 2018 2019 2020
Growth/Decline Vs 2016 (Land+Build)
12,688,725
13,819,179 13,406,947
16,127,095
8,107,241
74.4% 81.1% 78.6% 81.3% 75.1%
2016 2017 2018 2019 2020
EBITDA EBITDA %
FINANCIAL PERFORMANCE OF IPW1 STORES
9.0%
11.8% 12.0%
15.1%
7.6%
2016 2017 2018 2019 2020
NET YIELD % ON ASSETS MARKET VALUE
(L+B)
Market value for land & Book value of Building for year 2020 is considered based on year 2019 since latest number are not available
IPW1 2,016 2,017 2,018 2,019 2,020
Building Cost 43,320,375 43,320,375 43,320,375 43,320,375 43,320,375
Land Cost (SQM46K) 97,848,925 73,386,944 68,494,348 63,601,751 63,601,751
(Land+Build) 141,169,300 116,707,319 111,814,723 106,922,126 106,922,126
Growth/Decline Vs 2016 -3% -7% -12% -12%
Growth/Decline Vs LY -17% -4% -4% 0%
-24% -31% -37% -37%
141M
117M 112M 107M 107M
2016 2017 2018 2019 2020
Growth/Decline Vs 2016 (Land+Build)
1,739,750
1,399,595
1,243,728
1,517,506
58.9% 48.2% 45.3% 55.7%
2017 2018 2019 2020
EBITDA EBITDA %
FINANCIAL PERFORMANCE OF ST38 PROPERTIES
6.7%
5.7%
5.3%
6.5%
2017 2018 2019 2020
NET YIELD % ON ASSETS MARKET VALUE
(L+B)
Market value for land & Book value of Building for year 2020 is considered based on year 2019 since latest number are not available
ST38 2016 2017 2018 2019 2020
Building Cost 13,111,614 13,111,614 13,111,614 13,111,614 13,111,614
LandCost 15,545,799 12,664,064 11,515,327 10,363,688 10,363,688
(Land+Build) 28,657,413 25,775,678 24,626,941 23,475,302 23,475,302
Growth/Decline Vs 2017 10% 5% 0% 0%
Growth/Decline Vs LY -10% -4% -5% 0%
-24% -31% -37% -37%
29M
26M 25M 23M 23M
2016 2017 2018 2019 2020
Growth/Decline Vs 2016 (Land+Build)
6,189,502
7,124,858
55.5% 66.7%
2019 2020
EBITDA EBITDA %
FINANCIAL PERFORMANCE OF ST02 COLD STORES
7.2%
8.3%
2019 2020
NET YIELD % ON ASSETS MARKET
VALUE (L+B)
0% 0%
0 0 0
88M 88M
2016 2017 2018 2019 2020
Growth/Decline Vs 2019 (Land+Build)
ST02 Cold Stores 2,016 2,017 2,018 2,019 2,020
Building Cost 61,186,809 61,186,809
Land Cost 26,974,200 26,974,200
(Land+Build) - - - 88,161,009 88,161,009
Growth/Decline Vs 2019 0% 0%
Growth/Decline Vs LY 0% 0%
Cost of Operation (Electricity and water cost)
Electricity and water cost analysis 2016 2017 2018 2019 2020
Occupancy% 96.3% 86.9% 95.5% 97.1% 95.8%
Residential Properties 1,171,729 1,288,098 1,471,879 1,700,063 1,544,780
Increase/Decrease in cost % 9.9% 14.3% 15.5% -9.1%
Increase in Kahramaa Tariff 31.0%
Occupancy% 100.0% 100.0% 100.0% 100.0% 100.0%
ST39 Properties 1,197,113 960,640 1,448,005 1,668,033 1,320,335
Increase/Decrease in cost % -19.8% 50.7% 15.2% -20.8%
Increase in Kahramaa Tariff 31.0%
Occupancy% 99.1% 85.9% 97.3% 97.0%
ST38 Properties 673,133 613,870 618,351 509,576
Increase/Decrease in % -8.8% 0.7% -17.6%
Increase in Kahramaa Tariff 31.0%
Occupancy% 100.0% 100.0% 100.0% 100.0% 97.5%
IPW1 Properties 1,008,902 1,060,894 1,211,133 1,078,676 1,212,583
Increase/Decrease in % 5.2% 14.2% -10.9% 12.4%
Occupancy% 96.5% 95.0% 96.7%
ST11 Labour Accommod
475,267 376,459 386,853
Increase/Decrease in %
-20.8% 2.8%
Increase in Kahramaa Tariff
Occupancy%
73.8% 80.0%
Cold Stores
727,266 784,652
Increase/Decrease in %
7.9%
Increase in Kahramaa Tariff
Total 3,377,744 3,982,765 5,220,155 6,168,847 5,758,777
Cost of Operation (Electricity and water cost)
0
1,197,113
960,640
1,448,005
1,668,033
1,320,335
673,133
613,870 618,351
509,576
0
1,008,902
1,060,894
1,211,133
1,078,676
1,212,583
1
0
0
727,266
784,652
2016 2017 2018 2019 2020
Residential Properties ST39 Properties ST38 Properties IPW1 Properties
ST11 Labour Accommod Cold Stores Cold Stores
Maintenance Cost analysis
2016 2017 2018 2019 2020
Occupancy% 96.3% 86.9% 95.5% 97.1% 95.8%
Residential Properties 1,645,765 2,293,618 2,811,448 2,296,459 3,386,489
% of Revenue 4% 7% 8% 6% 9.71%
Increase/Decrease in cost % 39.4% 22.6% -18.3% 47.5%
Occupancy% 100.0% 100.0% 100.0% 100.0% 100.0%
ST39 Properties 112,071 150,944 229,175 1,131,720 400,388
% of Revenue 1% 1% 2% 12% 5.2%
Increase/Decrease in cost % 34.7% 51.8% 393.8% -64.6%
Occupancy% 40.0% 99.1% 85.9% 97.3% 97.0%
ST38 Properties 51,375 78,736 220,203 169,590 243,396
% of Revenue 3% 3% 8% 7% 11%
Increase/Decrease in % 53.3% 179.7% -23.0% 43.5%
Occupancy% 100.0% 100.0% 100.0% 100.0% 97.5%
IPW1 Properties 1,414,991 1,065,381 941,640 768,417 451,527
% of Revenue 8% 6% 6% 5% 4%
Increase/Decrease in % -24.7% -11.6% -18.4% -41.2%
Occupancy% 96.5% 95.0% 96.7%
ST11 Labour Accommod 268,556 260,604 112,882
% of Revenue 9% 9% 6%
Increase/Decrease in % -3.0% -56.7%
Occupancy% 73.8% 80.0%
Cold Stores 1,274,577 1,101,506
% of Revenue 11% 10.3%
Increase/Decrease in % -13.6%
Total 3,224,201 3,588,679 4,471,021 5,901,367 5,696,188
Maintenance Cost analysis
2016 2017 2018 2019 2020
Residential Properties 1.65 2.29 2.81 2.29 3.39
ST39 Properties 0.11 0.15 0.23 1.13 0.40
ST38 Properties 0.05 0.08 0.22 0.17 0.24
IPW1 Properties 1.41 1.07 0.94 0.77 0.45
ST11 Labour Accommod 0.27 0.26 0.12
Cold Stores 1.27 1.10
-
0.50
1.00
1.50
2.00
2.50
3.00
3.50
4.00
Amount in Million
Maintenance Cost analysis (Cost reduction plan to be implemented)
1. Quality control – We need to ensure that we are using better quality material and
workmanship in order to avoid recuring cost.
2. Warranty/Guarantee- We shall go for materials and service wherever we avail maximum
warranty and guarantee without incurring any additional cost.
3. Automation-It is suggested wherever possible, we need to bring automation. (Like, we can
add cleaning machine
4. Robust Plan preventive maintenance-We shall ensure PPM is fully implemented and all
minor issue is arrested in advance before any machinery get breakdown.
5. Corrective Action- We shall ensure all corrective maintenance to be done as soon it is
identified to avoid major cost.
6. Outsourcing work- We shall identify work, which we can be outsourced without adding extra
cost as compared to work done internally.
7. Productivity- We shall focus to increase productivity of existing team, will trained them for
multitasking job.
Cost of Operations (Electricity and water cost reduction in year 2021 and future)
1. Switch100 % to LED to conserve electricity
2. Switch to energy star appliances
3. Plan preventive maintenance schedule to be complied 100%
4. Identifying high usage meter, frequently complain to Kahramaa to replace new meter
5. Those tenants, there electricity and water usage is abnormal higher than other tenants, will
be reported abnormal usage. If consumption is not reduced, then additional premium rent
will be charged at the time of renewal.
6. To reduce water, if we found any abnormalities to specific water meter, we will investigate
on immediate basis for leakage.
Finance Department
Strategy for the year
2021 and 2 years
forward
1. Finance Department –Restructure plan
2. Negotiations and cost control initiative
3. Risk identification and mitigation plan
4. Working capital reduction plan
5. Ensure business plan is achieved
6. Resource productivity measurement initiatives and
review mechanism
7. Plan / Roadmap for robust Information system setup
and rolling out the MIS with Insights and analytics
8. Continuous improvement areas
9. Policy Compliance Gap Assessment and
improvement plan with milestones
Finance Department Restructure Plan
STAGE 01
•Identify slow
performance
employee
STAGE 02
•Communicate
the plan to staff
and
management
STAGE 03
•Perform skill
assessment
and detailed
analysis
STAGE 04
•Review and
Plan correction
STAGE 05
•Execute for
replacement plan
The identification of slow performance from GUC finance team is already initiated.
Negotiations and cost control initiative
Working
Price review
of valid
contracts and
renewal
contracts
• For all valid contracts and contracts due for renewal, price will be reviewed by
comparing with other service providers.
• Accordingly, stiff price negotiations will be done with existing service provider or
new service provider.
Price
comparison
with every
single item
with last
purchase
• Every single purchase order/service order price will be compared with last
purchase.
• If we observed if any major increased, then price will be renegotiated .
Internal Cost
estimations for
any major
maintenance
work
• For any major work, there will be internal estimation will be done before we float
tender.
• We shall ensure, all contractors are renegotiated till GM level.
Negotiations and cost control initiative
Working
Budgetary
control
• We shall coordinate, every single line items are covered in budgeted cost for the
year 2021 and 2 years ahead.
• Accordingly, stiff price negotiations will be done and ensure that cost should not
surplus budgeted value.
Warranty or
Guarantee
• Every single job, where cost will be above QAR 100K, we shall ensure warranty
or guarantee is provided by supplier or contractor..
• As much possible, we shall collect guarantee cheque against retention money
or warranty coverage.
Variance Log
will be
maintained
• Finance team will maintain report for savings or deficit for every single purchase
order or service order.
Negotiations and cost control initiative
Working
Inventory
review and
physical count
• Finance team shall conduct physical verification on every six months and make
report for any variance found during physical count.
• Finance team shall review trend of usage of material to identify any abnormal
usage us any line item.
Overtime cost
review and
control
• We shall do monthly comparison in order to track overtime cost increase and
decrease.
• Accordingly, we shall raise concern to related department to initiate overtime
cost.
Maintenance
cost track
assets wise
• We shall track wherever possible to track the record of cost for all major assets
in order to evaluate capability and replacement plan.
Negotiations and cost control initiative
Working
Capex Cost
Control
• Finance team ensure, every assets are requested for replacement is fully
justified by life of usage, existing appearance, condition of assets.
• Finance team shall prepare feasibility study for CAPEX wherever applicable.
Accordingly recommend for Capex acquision plan.
Comparison of
Projects
actual
performance
vs feasibility
• Every year, project performance reports will be updated and submitted to
management for review.
• Accordingly, learning and improvement plan will be recommended to project
department.
Asses Risk
factors
• Wherever identical, we shall assess risk and future associated cost. Same will
be communicated to management about risk and future associated cost. Also, it
will be updated to avoid these risk, what would be current cost.
Risk Identification and mitigation plan
Work on mitigation
plan
• Finance team will inform
related department to start
working on mitigation plan
and will keep coordination
until it is closed.
Risk report to
management
• Upon identification of risk,
immediately. Detailed report
will be submitted to
management with
mitigation plan
Risk identification
• Finance team shall
maintain risk register.
• Whenever any type of risk
is identified. It will be
recorded whether it is
related operational, leasing,
finance etc.
Working Management Cycle
Inventory
Accounts payable
Service Invoice
Accounts
Receivable
Cash
Working Capital management plan
Working capital
management
initiatives
•All advance payment supplier will be converted to credit supplier.
•All existing credit supplier will be renegotiated for credit days.
As per SOP, only 3 months inventory will be kept in stock. However, Finance team will
reassess the fast moving and slow-moving items and plan accordingly.
`
All Cold stores customers will be covered through Post dated cheques and undated
deposit. Ontime invoice will be ensure to avoid delay in collection.
For any return cheques, immediately legal case will be initiated and parallelly stiff
follow up will be done.
Ensure bad debts to be NIL, be reviewing customer personas and ability of
payment and timely follow up against return cheques
Transfer excess cash to Zad Holding after analyzing monthly working capital.
Ensure business plan is achieved
Obtain approval
from
management for
revised rod
map.
Propose revised
road map to
achieve
business plan
Coordinate with
related
department
head on
monthly basis to
update on
deficit
Monthly review
of Business
plan and
variance
analysis
Resource productivity measurement initiatives and review
mechanism
Working
 At present, there is no specific tool to review resource productivity measurement.
 As a service industry, its totally depend on complaint type whether it is major or minor.
 From year 2021, we will set up tool based on various KPI to capture productivity of each
employee working under Supervisor/manager.
 On every quarter, same will be reviewed managers along with supervisor.
 Final reports will be submitted to HR and Finance and General Manager
Roadmap for robust Information system setup and rolling out the MIS with Insights
and analytics
STAGE
01
•Addition more
experienced
team and Trained
existing for timely
updating of data
with accuracy
STAGE
02
•Segregate specific
MIS reporting to
each team member.
STAGE
03
•Review and
revision by
Finance head
STAGE
04
•Addition of Risk
register as part of
Existing MIS
STAGE
05
•Revisit every quarter
and workout on tool
and templet to cover
detailed MIS in robust
form.
This is to be noted, our existing ERP system, doesn’t support for various report
required for management. Hence, there will be dependence on MS office for reporting
which is time consuming until we create robust tool in Excel.
Continuous improvement plan
Quality
Leasing
 Leasing SOP to be revised
 Communication and presentation
skills for Leasing team
Cold Store
 WMS to be implemented for Cold Store
 Communication and presentation skills for
cold store team
Maintenance
 Maintenance SOP to be revised
 Communication and presentation skill
to be developed among maintenance
Engineers/supervisor
approval
Finance
 Finance SOP to be revised and
updated on quarterly basis
 Timely reporting
 Develop information to improve
decision making
Continuous Improvement Plan
Below areas need to be improved on continues basis which are essentially
required to achieve organization objective.
1. Corporate policy and SOP revisit again and again to comply 100%
2. Timely MIS Reporting Process
3. Decision making and approval process
4. Internal Communications Process
5. Record Keeping Process
6. Training Process
7. Internal Audit Process
Policy compliance GAP assessment and improvement plan with miles stores
Roadmap for robust Information system setup and rolling out
the MIS with Insights and
analytics
 Gap analysis is required on quarterly basis to improve business processes and identify gap
between planed and actual performance. This need to be done on consistent basis to
recognize which processes need improvement.
 Policy not complied:
1. Most of the place, we are following corporate policy however, physical verification of assets
is not done as per policy on annual basis. However, we are conducting whenever any
tenant vacate the property.
2. Sometimes, we are unable to go for multiple quotes as items are being purchased on
existing colour code, similarly and other specification.
3. Many times customer request to delay their cheques for 1 or 2 days due to delay in their
salary. However, we insist Leasing department to obtain approval from General Manager.
4. There are some exceptions, however we obtain management approval to fill these gaps by
justifying with reasons.
MEP Service
Improvement
Fire Protection system
improvement
1) Solving smoke detectors issue for GUC Cold Store by
modifying Fire Alarm system as per the Qcdd norms, in
alignment with the end user and the Owners objective.
2) Identifying the Fire Fighting pipe water leakage point at
St 39 Labor accommodation and warehouse sand
rectifying the issue to have proper and healthy Fire
Fighting system.
3) Installation of the separate alarm system for all Fire
Fighting Pump room accessories like water overflow
alarm, Jockey Pump and Electrical Pump Working alarm
in the Guard Room.
4) Conducting semi annually Fire Safety Drill to enhance
safety awareness to tenants, maintenance team about
the Fire safety and Fire extinguishing process and
protocol to avoid the Fire risk.
5) Maintaining 100% compliance for complete fire
protection system for all site as per the Qcdd standards
and regulations.
MEP Services Improvement
1. Improving the GUC Cold Store Site Electromechanical
Panels, devices safety with the installation of the under
and over Voltage shunt trip.
2. Upgrading St 11 IPW site Electrical LV Panel and getting
the required authorities' approval to avoid rental Diesel
Generators and Diesel Supply cost.
3. Enhancing the Abu hamour properties by replacing old
Split Ac Units with new Units and using the old but
working Acs in other acceptable areas like Labor
accommodation building, warehouses etc.
MEP Services Improvement
5. Improving site services like installations of the CCTV
Cameras, improvement in the lighting system, Air
conditioning unit's new installation etc.
6. Looking for new machines and latest technology for the
regular maintenance works like online monitoring system
of GUC Cold Store temp. panels to reduce the manpower
cost.
7. Continuous monitoring of the electricity and water cost and
identifying wastage of water due to leakage and rectifying
leakage. As well identifying problematic electric meters
and complaining to Kahramaa.
8. Continuous upgrading with latest Govt. authorities'
regulations for services and implementing the same at the
site in accordance with the end user and the owner's
objective.
Since the residential building getting older ( above 13 years) whereas our competitors building is 5-6 years old.
Hence to we have identified specific areas, which need to be improved in year 2021 and 2 years forward to
maintain occupancy and keep attractive potential customers.
GUC Property-Improvement and beautification plan in year 2021 and 2 years forward
Thanks
Gulf United Real Estate Investment Co.

More Related Content

Similar to Strategic 2021 and 2 years forward R1.pptx

Ici magazine (
Ici magazine (Ici magazine (
Ici magazine (kiraly93
 
8826869222 63 GOLF DRIVE Sector 63A Golf Course Extension Road Gurgaon
8826869222 63 GOLF DRIVE Sector 63A Golf Course Extension Road Gurgaon8826869222 63 GOLF DRIVE Sector 63A Golf Course Extension Road Gurgaon
8826869222 63 GOLF DRIVE Sector 63A Golf Course Extension Road Gurgaonsarveshnassa11
 
Stay Ulo - Seed Deck
Stay Ulo - Seed DeckStay Ulo - Seed Deck
Stay Ulo - Seed DeckAlfredAnucha
 
The Proposed New Petroleum Company in the Philippines.pptx
The Proposed New Petroleum Company in the Philippines.pptxThe Proposed New Petroleum Company in the Philippines.pptx
The Proposed New Petroleum Company in the Philippines.pptxReneBernaldez1
 
Zafe builders : A Proposed Business Plan
Zafe builders : A Proposed Business PlanZafe builders : A Proposed Business Plan
Zafe builders : A Proposed Business Planharoldtaylor1113
 
Sunrays Heights Affordable Housing Gurgaon 9953993753
Sunrays Heights Affordable Housing Gurgaon 9953993753Sunrays Heights Affordable Housing Gurgaon 9953993753
Sunrays Heights Affordable Housing Gurgaon 9953993753Take One Real Estate
 
13 12 05_capital_markets_day_final
13 12 05_capital_markets_day_final13 12 05_capital_markets_day_final
13 12 05_capital_markets_day_finalCompany Spotlight
 
13287 OSBORNE AR lores spreads
13287 OSBORNE AR lores spreads13287 OSBORNE AR lores spreads
13287 OSBORNE AR lores spreadsJosie Piercy
 
05oct11presentation.4 update.2
05oct11presentation.4 update.205oct11presentation.4 update.2
05oct11presentation.4 update.2Chucshwal's MK
 
ACCT351- 1404B-01Cost AccountingExecutive SummaryQuesa.docx
ACCT351- 1404B-01Cost AccountingExecutive SummaryQuesa.docxACCT351- 1404B-01Cost AccountingExecutive SummaryQuesa.docx
ACCT351- 1404B-01Cost AccountingExecutive SummaryQuesa.docxbobbywlane695641
 
Iberdrola Gamesa Alliance
Iberdrola Gamesa AllianceIberdrola Gamesa Alliance
Iberdrola Gamesa Alliancekilia84
 
Ksahousingcrisis 101024004941-phpapp02
Ksahousingcrisis 101024004941-phpapp02Ksahousingcrisis 101024004941-phpapp02
Ksahousingcrisis 101024004941-phpapp02Duncan Speed Smith
 
KSA Housing Crisis
KSA Housing CrisisKSA Housing Crisis
KSA Housing CrisisDuncan Smith
 
Tilt Talk Scrolling Newsletter_3815iii
Tilt Talk Scrolling Newsletter_3815iiiTilt Talk Scrolling Newsletter_3815iii
Tilt Talk Scrolling Newsletter_3815iiiCraig Cairns
 
Uk pv market strategy execution cb
Uk pv market strategy execution cbUk pv market strategy execution cb
Uk pv market strategy execution cbChristian Bogue
 
GoCo Group - NOAH19 London
GoCo Group - NOAH19 LondonGoCo Group - NOAH19 London
GoCo Group - NOAH19 LondonNOAH Advisors
 
Keppel Corporation - Briefing to Analysts on Vietnam Property
Keppel Corporation - Briefing to Analysts on Vietnam Property Keppel Corporation - Briefing to Analysts on Vietnam Property
Keppel Corporation - Briefing to Analysts on Vietnam Property KeppelCorporation
 

Similar to Strategic 2021 and 2 years forward R1.pptx (20)

Ici magazine (
Ici magazine (Ici magazine (
Ici magazine (
 
8826869222 63 GOLF DRIVE Sector 63A Golf Course Extension Road Gurgaon
8826869222 63 GOLF DRIVE Sector 63A Golf Course Extension Road Gurgaon8826869222 63 GOLF DRIVE Sector 63A Golf Course Extension Road Gurgaon
8826869222 63 GOLF DRIVE Sector 63A Golf Course Extension Road Gurgaon
 
Stay Ulo - Seed Deck
Stay Ulo - Seed DeckStay Ulo - Seed Deck
Stay Ulo - Seed Deck
 
The Proposed New Petroleum Company in the Philippines.pptx
The Proposed New Petroleum Company in the Philippines.pptxThe Proposed New Petroleum Company in the Philippines.pptx
The Proposed New Petroleum Company in the Philippines.pptx
 
Zafe builders : A Proposed Business Plan
Zafe builders : A Proposed Business PlanZafe builders : A Proposed Business Plan
Zafe builders : A Proposed Business Plan
 
Property Times July 2015 eMagazine
Property Times July 2015 eMagazineProperty Times July 2015 eMagazine
Property Times July 2015 eMagazine
 
Sunrays Heights Affordable Housing Gurgaon 9953993753
Sunrays Heights Affordable Housing Gurgaon 9953993753Sunrays Heights Affordable Housing Gurgaon 9953993753
Sunrays Heights Affordable Housing Gurgaon 9953993753
 
13 12 05_capital_markets_day_final
13 12 05_capital_markets_day_final13 12 05_capital_markets_day_final
13 12 05_capital_markets_day_final
 
13287 OSBORNE AR lores spreads
13287 OSBORNE AR lores spreads13287 OSBORNE AR lores spreads
13287 OSBORNE AR lores spreads
 
05oct11presentation.4 update.2
05oct11presentation.4 update.205oct11presentation.4 update.2
05oct11presentation.4 update.2
 
Savills Indonesia - CBD Office Market Update
Savills Indonesia - CBD Office Market UpdateSavills Indonesia - CBD Office Market Update
Savills Indonesia - CBD Office Market Update
 
ACCT351- 1404B-01Cost AccountingExecutive SummaryQuesa.docx
ACCT351- 1404B-01Cost AccountingExecutive SummaryQuesa.docxACCT351- 1404B-01Cost AccountingExecutive SummaryQuesa.docx
ACCT351- 1404B-01Cost AccountingExecutive SummaryQuesa.docx
 
Iberdrola Gamesa Alliance
Iberdrola Gamesa AllianceIberdrola Gamesa Alliance
Iberdrola Gamesa Alliance
 
Ksahousingcrisis 101024004941-phpapp02
Ksahousingcrisis 101024004941-phpapp02Ksahousingcrisis 101024004941-phpapp02
Ksahousingcrisis 101024004941-phpapp02
 
KSA Housing Crisis
KSA Housing CrisisKSA Housing Crisis
KSA Housing Crisis
 
Tilt Talk Scrolling Newsletter_3815iii
Tilt Talk Scrolling Newsletter_3815iiiTilt Talk Scrolling Newsletter_3815iii
Tilt Talk Scrolling Newsletter_3815iii
 
Uk pv market strategy execution cb
Uk pv market strategy execution cbUk pv market strategy execution cb
Uk pv market strategy execution cb
 
GoCo Group - NOAH19 London
GoCo Group - NOAH19 LondonGoCo Group - NOAH19 London
GoCo Group - NOAH19 London
 
Keppel Corporation - Briefing to Analysts on Vietnam Property
Keppel Corporation - Briefing to Analysts on Vietnam Property Keppel Corporation - Briefing to Analysts on Vietnam Property
Keppel Corporation - Briefing to Analysts on Vietnam Property
 
Saji Muhammed Salih Adeptus Technologies LLC
Saji Muhammed Salih Adeptus Technologies LLCSaji Muhammed Salih Adeptus Technologies LLC
Saji Muhammed Salih Adeptus Technologies LLC
 

Recently uploaded

80 ĐỀ THI THỬ TUYỂN SINH TIẾNG ANH VÀO 10 SỞ GD – ĐT THÀNH PHỐ HỒ CHÍ MINH NĂ...
80 ĐỀ THI THỬ TUYỂN SINH TIẾNG ANH VÀO 10 SỞ GD – ĐT THÀNH PHỐ HỒ CHÍ MINH NĂ...80 ĐỀ THI THỬ TUYỂN SINH TIẾNG ANH VÀO 10 SỞ GD – ĐT THÀNH PHỐ HỒ CHÍ MINH NĂ...
80 ĐỀ THI THỬ TUYỂN SINH TIẾNG ANH VÀO 10 SỞ GD – ĐT THÀNH PHỐ HỒ CHÍ MINH NĂ...Nguyen Thanh Tu Collection
 
Spellings Wk 4 and Wk 5 for Grade 4 at CAPS
Spellings Wk 4 and Wk 5 for Grade 4 at CAPSSpellings Wk 4 and Wk 5 for Grade 4 at CAPS
Spellings Wk 4 and Wk 5 for Grade 4 at CAPSAnaAcapella
 
UGC NET Paper 1 Unit 7 DATA INTERPRETATION.pdf
UGC NET Paper 1 Unit 7 DATA INTERPRETATION.pdfUGC NET Paper 1 Unit 7 DATA INTERPRETATION.pdf
UGC NET Paper 1 Unit 7 DATA INTERPRETATION.pdfNirmal Dwivedi
 
Introduction to TechSoup’s Digital Marketing Services and Use Cases
Introduction to TechSoup’s Digital Marketing  Services and Use CasesIntroduction to TechSoup’s Digital Marketing  Services and Use Cases
Introduction to TechSoup’s Digital Marketing Services and Use CasesTechSoup
 
Jamworks pilot and AI at Jisc (20/03/2024)
Jamworks pilot and AI at Jisc (20/03/2024)Jamworks pilot and AI at Jisc (20/03/2024)
Jamworks pilot and AI at Jisc (20/03/2024)Jisc
 
Tatlong Kwento ni Lola basyang-1.pdf arts
Tatlong Kwento ni Lola basyang-1.pdf artsTatlong Kwento ni Lola basyang-1.pdf arts
Tatlong Kwento ni Lola basyang-1.pdf artsNbelano25
 
21st_Century_Skills_Framework_Final_Presentation_2.pptx
21st_Century_Skills_Framework_Final_Presentation_2.pptx21st_Century_Skills_Framework_Final_Presentation_2.pptx
21st_Century_Skills_Framework_Final_Presentation_2.pptxJoelynRubio1
 
FICTIONAL SALESMAN/SALESMAN SNSW 2024.pdf
FICTIONAL SALESMAN/SALESMAN SNSW 2024.pdfFICTIONAL SALESMAN/SALESMAN SNSW 2024.pdf
FICTIONAL SALESMAN/SALESMAN SNSW 2024.pdfPondicherry University
 
HMCS Vancouver Pre-Deployment Brief - May 2024 (Web Version).pptx
HMCS Vancouver Pre-Deployment Brief - May 2024 (Web Version).pptxHMCS Vancouver Pre-Deployment Brief - May 2024 (Web Version).pptx
HMCS Vancouver Pre-Deployment Brief - May 2024 (Web Version).pptxmarlenawright1
 
Understanding Accommodations and Modifications
Understanding  Accommodations and ModificationsUnderstanding  Accommodations and Modifications
Understanding Accommodations and ModificationsMJDuyan
 
Economic Importance Of Fungi In Food Additives
Economic Importance Of Fungi In Food AdditivesEconomic Importance Of Fungi In Food Additives
Economic Importance Of Fungi In Food AdditivesSHIVANANDaRV
 
How to Manage Call for Tendor in Odoo 17
How to Manage Call for Tendor in Odoo 17How to Manage Call for Tendor in Odoo 17
How to Manage Call for Tendor in Odoo 17Celine George
 
Details on CBSE Compartment Exam.pptx1111
Details on CBSE Compartment Exam.pptx1111Details on CBSE Compartment Exam.pptx1111
Details on CBSE Compartment Exam.pptx1111GangaMaiya1
 
FSB Advising Checklist - Orientation 2024
FSB Advising Checklist - Orientation 2024FSB Advising Checklist - Orientation 2024
FSB Advising Checklist - Orientation 2024Elizabeth Walsh
 
OSCM Unit 2_Operations Processes & Systems
OSCM Unit 2_Operations Processes & SystemsOSCM Unit 2_Operations Processes & Systems
OSCM Unit 2_Operations Processes & SystemsSandeep D Chaudhary
 
Sensory_Experience_and_Emotional_Resonance_in_Gabriel_Okaras_The_Piano_and_Th...
Sensory_Experience_and_Emotional_Resonance_in_Gabriel_Okaras_The_Piano_and_Th...Sensory_Experience_and_Emotional_Resonance_in_Gabriel_Okaras_The_Piano_and_Th...
Sensory_Experience_and_Emotional_Resonance_in_Gabriel_Okaras_The_Piano_and_Th...Pooja Bhuva
 
Interdisciplinary_Insights_Data_Collection_Methods.pptx
Interdisciplinary_Insights_Data_Collection_Methods.pptxInterdisciplinary_Insights_Data_Collection_Methods.pptx
Interdisciplinary_Insights_Data_Collection_Methods.pptxPooja Bhuva
 
TỔNG ÔN TẬP THI VÀO LỚP 10 MÔN TIẾNG ANH NĂM HỌC 2023 - 2024 CÓ ĐÁP ÁN (NGỮ Â...
TỔNG ÔN TẬP THI VÀO LỚP 10 MÔN TIẾNG ANH NĂM HỌC 2023 - 2024 CÓ ĐÁP ÁN (NGỮ Â...TỔNG ÔN TẬP THI VÀO LỚP 10 MÔN TIẾNG ANH NĂM HỌC 2023 - 2024 CÓ ĐÁP ÁN (NGỮ Â...
TỔNG ÔN TẬP THI VÀO LỚP 10 MÔN TIẾNG ANH NĂM HỌC 2023 - 2024 CÓ ĐÁP ÁN (NGỮ Â...Nguyen Thanh Tu Collection
 
What is 3 Way Matching Process in Odoo 17.pptx
What is 3 Way Matching Process in Odoo 17.pptxWhat is 3 Way Matching Process in Odoo 17.pptx
What is 3 Way Matching Process in Odoo 17.pptxCeline George
 

Recently uploaded (20)

80 ĐỀ THI THỬ TUYỂN SINH TIẾNG ANH VÀO 10 SỞ GD – ĐT THÀNH PHỐ HỒ CHÍ MINH NĂ...
80 ĐỀ THI THỬ TUYỂN SINH TIẾNG ANH VÀO 10 SỞ GD – ĐT THÀNH PHỐ HỒ CHÍ MINH NĂ...80 ĐỀ THI THỬ TUYỂN SINH TIẾNG ANH VÀO 10 SỞ GD – ĐT THÀNH PHỐ HỒ CHÍ MINH NĂ...
80 ĐỀ THI THỬ TUYỂN SINH TIẾNG ANH VÀO 10 SỞ GD – ĐT THÀNH PHỐ HỒ CHÍ MINH NĂ...
 
Spellings Wk 4 and Wk 5 for Grade 4 at CAPS
Spellings Wk 4 and Wk 5 for Grade 4 at CAPSSpellings Wk 4 and Wk 5 for Grade 4 at CAPS
Spellings Wk 4 and Wk 5 for Grade 4 at CAPS
 
UGC NET Paper 1 Unit 7 DATA INTERPRETATION.pdf
UGC NET Paper 1 Unit 7 DATA INTERPRETATION.pdfUGC NET Paper 1 Unit 7 DATA INTERPRETATION.pdf
UGC NET Paper 1 Unit 7 DATA INTERPRETATION.pdf
 
Introduction to TechSoup’s Digital Marketing Services and Use Cases
Introduction to TechSoup’s Digital Marketing  Services and Use CasesIntroduction to TechSoup’s Digital Marketing  Services and Use Cases
Introduction to TechSoup’s Digital Marketing Services and Use Cases
 
Jamworks pilot and AI at Jisc (20/03/2024)
Jamworks pilot and AI at Jisc (20/03/2024)Jamworks pilot and AI at Jisc (20/03/2024)
Jamworks pilot and AI at Jisc (20/03/2024)
 
Tatlong Kwento ni Lola basyang-1.pdf arts
Tatlong Kwento ni Lola basyang-1.pdf artsTatlong Kwento ni Lola basyang-1.pdf arts
Tatlong Kwento ni Lola basyang-1.pdf arts
 
21st_Century_Skills_Framework_Final_Presentation_2.pptx
21st_Century_Skills_Framework_Final_Presentation_2.pptx21st_Century_Skills_Framework_Final_Presentation_2.pptx
21st_Century_Skills_Framework_Final_Presentation_2.pptx
 
FICTIONAL SALESMAN/SALESMAN SNSW 2024.pdf
FICTIONAL SALESMAN/SALESMAN SNSW 2024.pdfFICTIONAL SALESMAN/SALESMAN SNSW 2024.pdf
FICTIONAL SALESMAN/SALESMAN SNSW 2024.pdf
 
HMCS Vancouver Pre-Deployment Brief - May 2024 (Web Version).pptx
HMCS Vancouver Pre-Deployment Brief - May 2024 (Web Version).pptxHMCS Vancouver Pre-Deployment Brief - May 2024 (Web Version).pptx
HMCS Vancouver Pre-Deployment Brief - May 2024 (Web Version).pptx
 
Our Environment Class 10 Science Notes pdf
Our Environment Class 10 Science Notes pdfOur Environment Class 10 Science Notes pdf
Our Environment Class 10 Science Notes pdf
 
Understanding Accommodations and Modifications
Understanding  Accommodations and ModificationsUnderstanding  Accommodations and Modifications
Understanding Accommodations and Modifications
 
Economic Importance Of Fungi In Food Additives
Economic Importance Of Fungi In Food AdditivesEconomic Importance Of Fungi In Food Additives
Economic Importance Of Fungi In Food Additives
 
How to Manage Call for Tendor in Odoo 17
How to Manage Call for Tendor in Odoo 17How to Manage Call for Tendor in Odoo 17
How to Manage Call for Tendor in Odoo 17
 
Details on CBSE Compartment Exam.pptx1111
Details on CBSE Compartment Exam.pptx1111Details on CBSE Compartment Exam.pptx1111
Details on CBSE Compartment Exam.pptx1111
 
FSB Advising Checklist - Orientation 2024
FSB Advising Checklist - Orientation 2024FSB Advising Checklist - Orientation 2024
FSB Advising Checklist - Orientation 2024
 
OSCM Unit 2_Operations Processes & Systems
OSCM Unit 2_Operations Processes & SystemsOSCM Unit 2_Operations Processes & Systems
OSCM Unit 2_Operations Processes & Systems
 
Sensory_Experience_and_Emotional_Resonance_in_Gabriel_Okaras_The_Piano_and_Th...
Sensory_Experience_and_Emotional_Resonance_in_Gabriel_Okaras_The_Piano_and_Th...Sensory_Experience_and_Emotional_Resonance_in_Gabriel_Okaras_The_Piano_and_Th...
Sensory_Experience_and_Emotional_Resonance_in_Gabriel_Okaras_The_Piano_and_Th...
 
Interdisciplinary_Insights_Data_Collection_Methods.pptx
Interdisciplinary_Insights_Data_Collection_Methods.pptxInterdisciplinary_Insights_Data_Collection_Methods.pptx
Interdisciplinary_Insights_Data_Collection_Methods.pptx
 
TỔNG ÔN TẬP THI VÀO LỚP 10 MÔN TIẾNG ANH NĂM HỌC 2023 - 2024 CÓ ĐÁP ÁN (NGỮ Â...
TỔNG ÔN TẬP THI VÀO LỚP 10 MÔN TIẾNG ANH NĂM HỌC 2023 - 2024 CÓ ĐÁP ÁN (NGỮ Â...TỔNG ÔN TẬP THI VÀO LỚP 10 MÔN TIẾNG ANH NĂM HỌC 2023 - 2024 CÓ ĐÁP ÁN (NGỮ Â...
TỔNG ÔN TẬP THI VÀO LỚP 10 MÔN TIẾNG ANH NĂM HỌC 2023 - 2024 CÓ ĐÁP ÁN (NGỮ Â...
 
What is 3 Way Matching Process in Odoo 17.pptx
What is 3 Way Matching Process in Odoo 17.pptxWhat is 3 Way Matching Process in Odoo 17.pptx
What is 3 Way Matching Process in Odoo 17.pptx
 

Strategic 2021 and 2 years forward R1.pptx

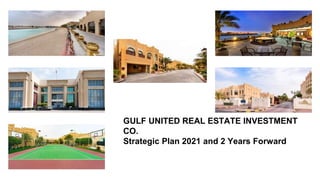
  • 1. GULF UNITED REAL ESTATE INVESTMENT CO. Strategic Plan 2021 and 2 Years Forward
  • 2. Executive Summary Company Overview Our Evolution Real Estate Portfolio The Team Identification of Strategic Objectives Marketing, Leasing and Revenue Analysis a) The market b) Competitor Analysis c) Revenue, occupancy, opportunity loss d) Bad debt analysis e) Leasing and marketing strategy f) Leasing department process  Financial performance of properties  Cost of operation analysis a) Electricity and water cost analysis b) Maintenance cost analysis c) Cost reduction plan  Finance Department Strategy and Improvement plan  MEP service improvement plan  GUC Property-Improvement and beautification plan in year 2021 and 2 years forward ( refer separate ppt attachment)
  • 3. OUR COMPANY • Gulf United Real Estate Investments Company (GUC) is primarily involved in the leasing of its owned villas, apartments and office building, Labour accommodation, warehouse (dry, ambient, chilled and frozen) Since 2005 • GUC is subsidiary of Zad Holding Company.
  • 4. OUR EVOLUTION 2005 Najma Apartments and IAD Office 2007 Cascade I and II, Ruby, Diamond, Sapphire compounds and Twin villas 2010 Pearl Garden and Ewaan compounds
  • 5. OUR EVOLUTION 2014 IPW1, ST38 and ST39 Warhouese and Labour Accommodations 2018 ST02 Cold Stores (Ambient, Chiller and Frozen) 2020 ST26 Warehouse and Labour Accommodations And still going strong!
  • 6. Real Estate Portfolio Property Name Type Locations No. of units Cascade I Villa/Apartment Abu Hamour 56 Cascade II Villa/Apartment Abu Hamour 32 Ruby Villa/Apartment Abu Hamoiur 28 Sapphire Villa/Apartment Abu Hamour 20 Diamond Villa/Apartment Abu Hamour 32 Twin Villa Villas Abu Hamour 2 Pearl Garden Villas Old Airport Area 16 Najma Building Apartment Najma/Mansoura 20 IAD Office Office C-Ring road 1 IPW1 Store Industrial Area,ST11 20 ST11 Labour Accommodations Labour Accommodation Industrial Area,ST38 180 ST38 Store Store Industrial Area,ST38 1 ST38 Labour Accommodations Labour Accommodation Industrial Area,ST38 168 ST39 Store Store Industrial Area,ST39 1 ST39 Labour Accommodations Labour Accommodation Industrial Area,ST39 270 ST26 Store Store Industrial Area,ST26 2 ST26 Labour Accommodations Labour Accommodation Industrial Area,ST26 190 ST2 Cold Stores Cold Rooms Industrial Area,ST26 86
  • 7. The Team (Total Head counts-164) Management General Manager (1) Maintenance Department (94 no’s) Cold Store operation Department (54 no’s) Leasing Department (3 no’s ) Project Departments (8 no’s) Finance Department (5 no’s)
  • 8. The Team ● Management: General Manager is overall heading all the function the business. ● Finance Department: 5 no. of team, headed by Asst. Manager-Finance ● Leasing Department: 3 no. of team, headed by Manager-Leasing ● Maintenance Department: 94 no. of team managed by Civil Engineer and MEP engineer ● Cold Store Operation: 54 no. of team headed Manager-Cold Store ● Total Head Counts-164
  • 9. IDENTIFICATION OF STRATEGIC OBJECTIVES Financial •Achieve business plan on consistent basis. •Maintain occupancy target of 98% on consistent basis •Achieve Revenue as per busines plan target on consistent basis •Identify all type of risk and plan to mitigate those risk to avoid any kind of loss to business Enhance value and life of assets •Consistent improvement to enhance life of building and keep updating as per market demands •Upgrade kitchen and bath •Change flooring •Upgrade common facilities like Gym, Clubhouse, play area •Not to over improve Customer •To achieve financial objective, we must serve as per target customer satisfaction •Establish strong customer trust and service delivery to achieve above average industry performance in our segments Internal improvement process • We must focus on smoothing internal process without compromising on any type of risk to satisfy our customers and meet our financial objective. Learning and growth •To achieve our Financial, Customer and Internal improvement process strategic objective. Always organization need to learn and adopt latest change. •To adopt latest changes, often training and skill development program must be organized to trained employee.
  • 10. Marketing, Leasing and Revenue Analysis 02 03 05 06 REVENUE AND OCCUPANCY ANALYSIS 01 PROCESS IMPROVEMENT PLAN The MARKET SWOT ANALYSIS 04 COMPETITOR ANALYSIS LEASING AND MARKETING STRATEGY
  • 11. The Market o Ewaan Garden villas (39 No.) are premium products in our portfolio and expected 98% occupancy in year 2021 and future 2 years as most of the tenants belong to various embassies and CEOs of companies who are really satisfied with our property. o All villas (168 No.) in the Abu Hamour area cater to upper mid-scale market and is price sensitive with a mix of Asian, Arab and Western tenants. From past 4 year, we have observed downward trend in rental rate, we have reduced the rental price average 10% per year in line with prevailing market rate. However, our target occupancy will be 98% for the year 2021 and 2 years forward. o Najma flats are in low mid-scale market and is price sensitive, but location close to day-to- day conveniences makes it attractive. However, our target occupancy will be 99% for the year 2021 and 2 years forward. o IAD building is rented to government and lease agreement is presently under automatic annual renewal basis. Hence, there will be assured occupancy of 100% for the year 2021 and 2 years forward.
  • 12. The Market o ST39 labour accommodations(270 rooms) is rented to internal group companies and assured 100% occupancy as they will continue leasing in year 2021 and future years as their complete workers accommodated in one location which is convenient for their business need. o ST39 Warehouses (10 stores of SQM 730 each) is 70% leased to internal group companies and 30% to external, however our strategy to retain all tenants and maintain 100% occupancy through out 2021 and in future years. o ST38 Labour accommodations (168 rooms) is rented to external customers and our target to retain 80% of customers and maintain 98% occupancy throughout 2021 and future years. o ST11 Warehouse (IPW1) is dry warehouse (SQM 27,500), open land yards (SQM 47,000) and Labour accommodation (180 rooms) are rented to external customers and most of them are bound by contract for the year 2021, hence there will be assured occupancy of 100% in year 2021. However, in year 2022 and 2023, our strategy will be to retain these customers and maintain 100% occupancy throughout the years. o Cold Stores( 2 no.) are located at Industrial Area, St02, which is priced location. Currently we are maintaining 90% occupancy in New Cold Stores and 100% in small Cold stores with better rental than market due advantage of location. Our strategy remain to retain 80% of existing customers and maintain 90% occupancy throughout year 2021 and future two years
  • 13. The Market (Porter's 5 forces analysis) FORCE HOW EFFECTIVE Risk of New Entrants MEDIUM  There are no barriers to entry for Qatari companies/individuals in either residential, warehouses and labour accommodations but subject to availability of good land parcels (location, accessibility, plot size etc.) However the use capital investment may deter the new entrants.  In past 3 years, we have noticed that supply has added much bigger than demand. As per valustrat report, in first half of year around 80K residential units are vacant and expected 7,250 new residential unit will be ready by end of year 2020. Bargaining Power of Supplier LOW  We have observed in past 3 year as supplier bargaining power has decreased huge and we are trying to take advantage it and wherever possible, we are signing the 2 years contract to fix the price. In fact, from past 6 months due to Covid-19 impact service cost has gone down which is benefiting to us as a customer. Bargaining Power of Customers HIGH  Present bargaining power of customers for residential villas being eroded in the short-to-medium term due to Covid -19 pandemic impact. Also, as stated above, there is huge over supply of residential unit, which is resulting drop in rental price However, there is possibility mid of year 2021, rental price will go up.  Due to Covid-19 pandemic 1- and newly added property has resulted huge drop in rental price. However, Growth in demand for warehousing expected due to nearing FIFA expected to moderate bargaining power of customers Threat of substitute product HIGH  Since road connectivity has improved and customers having multiple choices with less rent in out of Doha City.  Major substitute for mid-scale villas are older/cheaper stand-alone villas or luxury apartments at Pearl Qatar Competitive Rivalry with existing players HIGH  Major rival are Dar As Salam and Al Fardan compounds in Abu Hamour and nearby which has large no. of units and of bigger size with negotiable rate  Major rivals are Barwa and Ezdan that operate in the mid-scale apartment segment as they have expanded capacity with lower rate  Major rivals in warehouse competitor are Gulf Warehousing Co. and MILAHA who awhile most others are small stand-alone players.  Currently GWC and MILAHA are using penetrate pricing policy attract customers from all smaller players and occupy maximum share of market
  • 14. The Competitions RANGE COMPETIRORS High-scale villa  West bay Lagoon Villas managed Al Asmakh Real Estate Development  West bay Lagoon Villas managed by The Pearl Gate Reality Mid-scale Villa- Apartments  Dar Al Salam  The Pearl Qatar  Al Asmakh Real Estate Development  Al Emadi Enterprises Mid-scale apartments  Barwa Real Estate Company  Ezdan Real Estate Company Warehouses  Gulf Warehousing Company  MILAHA  Barwa Commercial Avenue Labour Accommodations  Barwa Labour Accommodations  Fragmented market ( No clear competitor)
  • 15. The Competitions Dar Al Salam The Pearl Qatar Owners Unidentified United Development Company, and listed on the Qatar Stock Exchange Prime Movers Investor returns and market expectations Investor returns and market expectations Business Objective/ Strategy Economies of scale by having many units with sharing of centralized services Mixed development on the marina, catering to mainly a Western lifestyle preference Strengths High quality, many central amenities, close to city center, many schools, Property appearance is attractive High quality, many central amenities, retail (branded) shopping, restaurants, marina, , Property appearance is attractive Weaknesses Very large compound and limited privacy/exclusivity Very large property and no. of available unit for lease Target Customer Segment Upper mid-scale tenants (with children) Mainly upper mid-scale to upscale customers with Western preferences Mid-Scale Villa-apartments
  • 16. The Competitions Mid-Scale Villa-apartments Al Asmakh Real Estate Al Emadi Enterprises Owners Privately held Privately held (Al Emadi family) Prime Movers Investor returns and market expectations Investor returns and market expectations Business Objective/ Strategy Operates in multiple real estate segments, including villas and apartments, towers Operates in multiple real estate segments, including villas and apartments Strengths Brand recognition, strong reputation, market presence, good quality, existence from past 30 years Brand recognition, strong reputation, market presence, good quality Weaknesses May not have sufficient focus on any particular segment / brand dilution. May not have sufficient focus on any particular segment / brand dilution. Target Customer Segment Mostly upper mid-scale villas, apartment and commercial customers Mostly mid-scale (some up-scale) apartment and commercial customers
  • 17. The Competitions Mid-Scale apartments Barwa Real Estate Company Ezdan Real Estate Company Owners Listed on Qatar Stock Exchange Listed on Qatar Stock Exchange Prime Movers Investor returns and market expectations Investor returns and market expectations Business Objective/ Strategy Operates in multiple real estate segments Operates in multiple real estate segments Strengths Government backed, brand recognition, market presence Brand recognition, market presence Weaknesses Large-scale developments available to market Quality and standard of developments not consistent Target Customer Segment Mostly mid-scale customers development Mostly mid-scale apartment customers
  • 18. The Competitions Warehouses Gulf Warehousing Company and MILAHA Barwa Commercial Avenue Owners Both companies are Listed on Qatar Stock Exchange Barwa Real Estate Company Prime Movers Investor returns and market expectations Investor returns and market expectations Business Objective/ Strategy Specialised logistics company providing warehousing, cold storage and open yard space Offer offices and showrooms in close proximity to the Industrial Area Strengths Brand recognition, market presence Brand recognition, market presence, ability to offer large leasable areas Weaknesses Need to fill large-scale development can depress rental rates however they are penetrating price to capture market Need to fill large-scale development can depress rental rates Target Customer Segment Industrial / commercial customers Cater to the commercial segment near the Industrial Area
  • 19. REVENUE, OCCUPANCY AND OPPORTUNITY LOSS ANALYSIS 6M 7M 7M 8M 9M 2020 2019 2018 2017 2016 Annual Revenue Cascade I Year 2020 2019 2018 2017 2016 Revenue growth/decline% Vs 2016 -30% -26% -20% -7% Annual Revenue 6,241,719 6,609,311 7,148,373 8,308,969 8,925,383 Occupancy% 95.5% 96.2% 92.4% 94.9% 98.2% Opportunity Loss 287,692 258,000 534,021 430,133 164,633 Avg. monthly rent growth/decline % Vs 2016 -28% -24% -15% -4% Average Monthly Rent 9,716 10,219 11,432 13,005 13,527 Vacant no. of Units 14 16 22 16 15 Total days vacant in year 914 786 1,553 1,036 377 Average days vacant in a year 65 49 71 65 25 95.5% 96.2% 92.4% 94.9% 98.2% 2020 2019 2018 2017 2016 Occupancy%
  • 20. REVENUE, OCCUPANCY AND OPPORTUNITY LOSS ANALYSIS 4M 4M 4M 5M 5M 2020 2019 2018 2017 2016 Cascade II Year 2020 2019 2018 2017 2016 Revenue growth/decline% Vs 2016 -25% -21% -17% -2% Annual Revenue 3,537,784 3,755,729 3,931,836 4,614,004 4,730,493 Occupancy% 96.1% 96.7% 93.8% 94.4% 91.6% Opportunity Loss 145,608 126,533 250,333 273,767 428,583 Avg. monthly rent growth/decline % Vs 2016 -29% -25% -19% -5% Average Monthly Rent 9,592 10,110 10,891 12,729 13,435 Vacant no. of Units 8 8 11 13 13 Total days vacant in year 460 384 720 656 984 Average days vacant in a year 58 48 65 50 76 96.1% 96.7% 93.8% 94.4% 91.6% 2020 2019 2018 2017 2016 Occupancy%
  • 21. REVENUE, OCCUPANCY AND OPPORTUNITY LOSS ANALYSIS 3M 3M 3M 3M 4M 2020 2019 2018 2017 2016 Annual Revenue Ruby Year 2020 2019 2018 2017 2016 Revenue growth/decline% Vs 2016 -30% -26% -18% -8% Annual Revenue 2,512,816 2,674,464 2,966,426 3,295,313 3,599,275 Occupancy% 93.4% 94.5% 98.2% 92.4% 96.6% Opportunity Loss 180,800 157,817 51,850 184,100 127,233 Avg. monthly rent growth/decline % Vs 2016 -28% -24% -19% -7% Average Monthly Rent 8,017 8,429 8,984 10,355 11,091 Vacant no. of Units 7 7 7 11 9 Total days vacant in year 678 557 183 778 347 Average days vacant in a year 97 80 26 71 39 93.4% 94.5% 98.2% 92.4% 96.6% 2020 2019 2018 2017 2016 Occupancy%
  • 22. REVENUE, OCCUPANCY AND OPPORTUNITY LOSS ANALYSIS 92.3% 94.5% 98.2% 87.0% 97.0% 2020 2019 2018 2017 2016 Occupancy% 2M 2M 2M 2M 2M 2020 2019 2018 2017 2016 Annual Revenue Sapphire Year 2020 2019 2018 2017 2016 Revenue growth/decline% Vs 2016 -26% -21% -14% -9% Annual Revenue 1,776,889 1,898,827 2,071,919 2,182,904 2,409,526 Occupancy% 92.3% 94.5% 98.2% 87.0% 97.0% Opportunity Loss 150,133 113,050 37,967 332,500 79,567 Avg. monthly rent growth/decline % Vs 2016 -23% -19% -15% 1% Average Monthly Rent 8,029 8,383 8,791 10,481 10,371 Vacant no. of Units 6 7 4 9 4 Total days vacant in year 563 399 134 950 217 Average days vacant in a year 94 57 34 106 54
  • 23. REVENUE, OCCUPANCY AND OPPORTUNITY LOSS ANALYSIS 3M 3M 3M 4M 4M 2020 2019 2018 2017 2016 Annual Revenue Diamond Year 2020 2019 2018 2017 2016 Revenue growth/decline% Vs 2016 -33% -26% -18% -11% Annual Revenue 2,825,090 3,124,107 3,464,573 3,774,588 4,222,363 Occupancy% 92.2% 95.7% 96.8% 89.9% 95.6% Opportunity Loss 243,467 141,100 109,667 412,650 188,467 Avg. monthly rent growth/decline % Vs 2016 -30% -26% -19% -5% Average Monthly Rent 7,991 8,503 9,308 10,904 11,487 Vacant no. of Units 15 9 13 15 14 Total days vacant in year 913 498 376 1,179 514 Average days vacant in a year 61 55 29 79 37 92.2% 95.7% 96.8% 89.9% 95.6% 2020 2019 2018 2017 2016 Occupancy%
  • 24. REVENUE, OCCUPANCY AND OPPORTUNITY LOSS ANALYSIS 94.8% 96.9% 93.4% 88.7% 88.2% 2020 2019 2018 2017 2016 Occupancy% 2M 2M 2M 2M 2M 2020 2019 2018 2017 2016 Annual Revenue Pearl Garden Year 2020 2019 2018 2017 2016 Revenue growth/decline% Vs 2016 -24% -17% -11% -5% Annual Revenue 1,653,626 1,815,766 1,937,653 2,080,901 2,187,257 Occupancy% 94.8% 96.9% 93.4% 88.7% 88.2% Opportunity Loss 91,500 57,633 136,458 256,258 299,867 Avg. monthly rent growth/decline % Vs 2016 -30% -25% -17% -6% Average Monthly Rent 9,089 9,757 10,803 12,173 12,954 Vacant no. of Units 3 6 4 6 12 Total days vacant in year 305 182 385 661 692 Average days vacant in a year 102 30 96 110 58
  • 25. REVENUE, OCCUPANCY AND OPPORTUNITY LOSS ANALYSIS 98.3% 99.3% 86.4% 37.0% 100.0% 2020 2019 2018 2017 2016 Occupancy% 10M 10M 8M 4M 14M 2020 2019 2018 2017 2016 Annual Revenue Ewaan Year 2020 2019 2018 2017 2016 Revenue growth/decline% Vs 2016 -29% -30% -41% -72% Annual Revenue 9,761,884 9,751,411 8,172,015 3,872,351 13,832,400 Occupancy% 98.3% 99.3% 86.4% 37.0% 100.0% Opportunity Loss 160,550 69,700 1,353,100 6,279,000 - Avg. monthly rent growth/decline % Vs 2016 -28% -29% -31% -27% Average Monthly Rent 21,202 20,985 20,353 21,691 29,556 Vacant no. of Units 5 2 12 34 - Total days vacant in year 247 102 1,933 8,970 - Average days vacant in a year 49 51 161 264 -
  • 26. REVENUE, OCCUPANCY AND OPPORTUNITY LOSS ANALYSIS 1M 1M 1M 1M 1M 2020 2019 2018 2017 2016 Annual Revenue Najma Year 2020 2019 2018 2017 2016 Revenue growth/decline% Vs 2016 -24% -19% -12% -8% Annual Revenue 1,069,113 1,140,444 1,246,145 1,301,744 1,414,436 Occupancy% 100.0% 99.7% 99.0% 95.9% 99.9% Opportunity Loss - 3,600 12,667 54,817 1,000 Avg. monthly rent growth/decline % Vs 2016 -24% -19% -11% -4% Average Monthly Rent 4,455 4,767 5,245 5,652 5,898 Vacant no. of Units - 1 2 4 1 Total days vacant in year - 24 76 299 5 Average days vacant in a year - 24 38 75 5 100.0% 99.7% 99.0% 95.9% 99.9% 2020 2019 2018 2017 2016 Occupancy%
  • 27. REVENUE, OCCUPANCY AND OPPORTUNITY LOSS ANALYSIS TWIN VILLA Year 2020 2019 2018 2017 2016 Revenue growth/decline% Vs 2016 -54% -100% -17% -1% Annual Revenue 96,000 - 174,000 205,500 208,425 Occupancy% 100.0% 100.0% 100.0% 100.0% 100.0% Opportunity Loss 96,000 192,000 16,000 - Avg. monthly rent growth/decline % Vs 2016 -54% -100% -17% -1% Average Monthly Rent 8,000 - 14,500 17,125 17,369 Vacant no. of Units - - - - - Total days vacant in year - - - - - Average days vacant in a year - - - - - 100.0% 100.0% 100.0% 100.0% 100.0% 2020 2019 2018 2017 2016 Occupancy% 96K 0K 174K 206K 208K 2020 2019 2018 2017 2016 Annual Revenue
  • 28. REVENUE, OCCUPANCY AND OPPORTUNITY LOSS ANALYSIS 100% 100% 100% 100% 100% 2020 2019 2018 2017 2016 Occupancy% 5M 5M 5M 5M 5M 2020 2019 2018 2017 2016 Annual Revenue IAD Building Year 2020 2019 2018 2017 2016 Revenue growth/decline% Vs 2016 0% 0% 0% 0% Annual Revenue 5,460,840 5,460,840 5,460,840 5,460,840 5,460,840 Occupancy% 100% 100% 100% 100% 100% Opportunity Loss - - - - - Avg. monthly rent growth/decline % Vs 2016 0% 0% 0% 0% Average Monthly Rent 5,460,840 5,460,840 5,460,840 5,460,840 5,460,840 Vacant no. of Units - - - - - Total days vacant in year - - - - - Average days vacant in a year - - - - -
  • 29. REVENUE, OCCUPANCY AND OPPORTUNITY LOSS ANALYSIS 97.5% 100.0% 100.0% 100.0% 100.0% 2020 2019 2018 2017 2016 Occupancy% 11M 17M 17M 17M 17M 2020 2019 2018 2017 2016 Annual Revenue IPW1 Warehouse Year 2020 2019 2018 2017 2016 Revenue growth/decline% Vs 2016 -37% 0% 0% 0% Annual Revenue 10,800,202 17,048,256 17,048,256 17,048,256 17,048,256 Occupancy% 97.5% 100.0% 100.0% 100.0% 100.0% Opportunity Loss 232,310 - - - - Avg. monthly rent growth/decline % Vs 2016 -31% 0% 0% 0% Average Monthly Rent in SQM 35.5 51.7 51.7 51.7 51.7 Vacant Area in SQM 13,753 - - - - Total days vacant in year 15 - - - - Average days vacant in a year 7.5 - - - -
  • 30. REVENUE, OCCUPANCY AND OPPORTUNITY LOSS ANALYSIS 100.0% 100.0% 100.0% 100.0% 100.0% 2020 2019 2018 2017 2016 Occupancy% 4M 5M 7M 8M 8M 2020 2019 2018 2017 2016 Annual Revenue ST39 Labour Accommodations Year 2020 2019 2018 2017 2016 Revenue growth/decline% Vs 2016 -54% -33% -16% -1% Annual Revenue 3,564,000 5,173,005 6,560,000 7,683,000 7,776,000 Occupancy% 100.0% 100.0% 100.0% 100.0% 100.0% Opportunity Loss - - - - - Avg. monthly rent growth/decline % Vs 2016 -54% -33% -16% -1% Average Monthly Rent 1,100 1,597 2,025 2,371 2,400 Vacant no. of Units - - - - - Total days vacant in year - - - - - Average days vacant in a year - - - - -
  • 31. REVENUE, OCCUPANCY AND OPPORTUNITY LOSS ANALYSIS 98.1% 99.0% 97.5% 81.1% 100.0% 2020 2019 2018 2017 2016 Occupancy% 4M 5M 7M 8M 8M 2020 2019 2018 2017 2016 Annual Revenue ST39 Warehouse Year 2020 2019 2018 2017 2016 Revenue growth/decline% Vs 2016 -30% -21% -18% -23% Annual Revenue 4,039,748 4,525,922 4,728,415 4,433,816 5,741,387 Occupancy% 98.1% 99.0% 97.5% 81.1% 100.0% Opportunity Loss 70,157 44,321 112,952 789,409 Avg. monthly rent growth/decline % Vs 2016 -28% -20% -16% -5% Average Monthly Rent 34,334 38,100 40,414 45,577 47,845 Vacant no. of Units (each unit SQM 730) 2 1 3 5 - Total days vacant in year 61 37 85 648 - Average days vacant in a year 30 32 30 130 -
  • 32. REVENUE, OCCUPANCY AND OPPORTUNITY LOSS ANALYSIS 100.0% 100.0% 100.0% 100.0% 75.0% 2020 2019 2018 2017 2016 Occupancy% 106K 103K 100K 96K 79K 2020 2019 2018 2017 2016 Annual Revenue ST39 Cafeteria Year 2020 2019 2018 2017 2016 Revenue growth/decline% Vs 2016 34% 31% 26% 22% Annual Revenue 105,600 103,488 99,584 96,000 79,000 Occupancy% 100.0% 100.0% 100.0% 100.0% 75.0% Opportunity Loss 24,000 Avg. monthly rent growth/decline % Vs 2016 0% -2% -5% -9% Average Monthly Rent 8,800 8,624 8,299 8,000 8,778 Vacant no. of Unit 1 Total days vacant in year 90 Average days vacant in a year - - - - 90
  • 33. REVENUE, OCCUPANCY AND OPPORTUNITY LOSS ANALYSIS 97.0% 97.3% 85.9% 99.1% 54.0% 2020 2019 2018 2017 2016 Occupancy% 2M 2M 2M 3M 2M 2020 2019 2018 2017 2016 Annual Revenue ST38 Labour Accommodations Year 2020 2019 2018 2017 2016 Revenue growth/decline% Vs 2016 26% 31% 57% 87% Annual Revenue 1,971,676 2,046,010 2,448,600 2,924,700 1,561,120 Occupancy% 97.0% 97.3% 85.9% 99.1% 54.0% Opportunity Loss 61,612 73,035 412,982 26,991 1,386,000 Avg. monthly rent growth/decline % Vs 2016 -14% -11% -3% 0% Average Monthly Rent 1,284 1,328 1,449 1,500 1,500 Vacant no. of Units 5 5 24 2 77 Total days vacant in year 1,440 1,650 8,550 540 27,720 Average days vacant in a year 283 360 360 360 358
  • 34. REVENUE, OCCUPANCY AND OPPORTUNITY LOSS ANALYSIS ST38 Store Year 2020 2019 2018 2017 2016 Revenue growth/decline% Vs 2017 980% 1050% 1100% Annual Revenue 302,400 322,000 336,000 28,000 Occupancy% 100.0% 100.0% 100.0% 100.0% Opportunity Loss - - - - Avg. monthly rent growth/decline % Vs 2016 -10% -4% 0% Average Monthly Rent 25,200 26,833 28,000 28,000 Vacant no. of Units - - - - Total days vacant in year Average days vacant in a year - - - - - 100.0% 100.0% 100.0% 100.0% 2020 2019 2018 2017 2016 Occupancy% 302K 322K 336K 28K 2020 2019 2018 2017 2016 Annual Revenue
  • 35. REVENUE, OCCUPANCY AND OPPORTUNITY LOSS ANALYSIS ST11 Labour Accommodations Year 2020 2019 2018 2017 2016 Revenue growth/decline% Vs 2016 -28% -12% Annual Revenue 2,257,411 2,750,040 3,127,580 - - Occupancy% 96.7% 95.0% 96.5% Opportunity Loss 77,842 144,739 108,034 - - Avg. monthly rent growth/decline % Vs 2016 -28% -11% Average Monthly Rent 1,081 1,340 1,500 - - Vacant no. of Units 6 9 6 - - Total days vacant in year 2,160 3,240 2,160 - - Average days vacant in a year 360.0 360 360 - - 96.7% 95.0% 96.5% 2020 2019 2018 2017 2016 Occupancy% 2M 3M 3M 2020 2019 2018 2017 2016 Annual Revenue
  • 36. REVENUE, OCCUPANCY AND OPPORTUNITY LOSS ANALYSIS ST02 Cold Stores Year 2020 2019 Revenue growth/decline% Vs 2019 -8% Annual Revenue 10,390,699 11,312,048 Occupancy% 86.0% 78.5% Opportunity Loss 483,288 1,657,179 86.0% 78.5% 2020 2019 Occupancy% 10M 11M 2020 2019 Annual Revenue
  • 37. DEBTS LOSS ANALYSIS 75,000 - 74,903 - 107,200 106,000 363,103 0.19% 0.00% 0.17% 0.00% 0.25% 0.28% 0.22% 2015 2016 2017 2018 2019 2020 Total Bad debts % on external revenue For year, 2021 and future years our target to review each customer persona very carefully and know their capability to pay rent on time to avoid any type doubt full debts. Ensure timely collection as per SOP and agreements signed by both parties. Strong follow up and timely escalation to management for any doubtful debts. Constant follow up with legal for ensure timely submission of case against default customers Year 2015 2016 2017 2018 2019 2020 Total Bad debts 75,000 - 74,903 - 107,200 106,000 363,103 % on external revenue 0.19% 0.00% 0.17% 0.00% 0.25% 0.28% 0.22% Total External Revenue 39,474,848 43,280,420 43,212,991 38,377,092 164,345,351
  • 38. SWOT ANALYSIS WEKNESSES THREATS Strengths Weaknesses • Generally good locations at key sites, basically residential properties are near to schools, hospitals and malls • Good reputation for maintenance and responsiveness with existing tenants • Offer villa-apartments with benefits of a small-to-medium sized gated community • Offer warehouses with value-added benefits of offices/showrooms and beside labour accommodations • Not much branding • Major neighboring villa competitor in Abu Hamour has much better facilities • Spex and design above 13 years old for Residential properties • Bulk residential tenants can vacate resulting in sudden drop in occupancy • IPW1 Warehouses have restriction due to limitation of power Opportunities Threats • Build on existing good reputation • Build closer communities within the compound making it emotionally harder for tenants to vacate • Enhance maintenance service and response • Enhance properties facilities to make more attractive to new tenants and existing tenant • Retain 80% of tenant which is better for organization. • Noticeable Market over supply 80,000 units (villas, apartments) including neighboring villas • In past six months, approx. 2,250 apartments and 700 villas added and majority of these units Lusail, The Pearl and West Bay • External factors and events lowering demand/economic growth • Due to no. of layoff in jobs, more tenants are vacating than new tenants are coming.
  • 39. LEASING STRATEGY Achieve 100% target of revenue Achieve 98% occupancy overall Identify opportunities to improve the customer journey Quarterly update to higher management on market updates Establish contacts and build relationship Classify properties in 3-4 categories Nail down to fit in prevailing market
  • 40. LEASING STRATEGY • Achieve 100% target of revenue and maintain 98% occupancy overall properties o As expected, market will lift in year 2021 since FIFA is nearing. Hence our Leasing strategy to retain 75% of existing customer and target new customers as per business plan. o Overall target occupancy 98% across all residential and commercial properties (except Cold stores) in year 2021 and 2 years forward. o Specific to Cold stores, our target to focus on multiple customers who can pay premium price considering priced location of GUC cold stores. • Identify opportunities to improve the customer journey o Asses each single customer who visit our property and target them to convert into real customers by understanding their needs and settling them to available properties with us. • Nail down to fit in prevailing market o Quarterly review and identify, how we fit in market (through detailed SWOT analysis)
  • 41. LEASING STRATEGY • Classify properties in 3-4 categories o Break down our properties into 3-4 classifications based on layout, size and location. Accordingly, need to target customers to achieve business plan target. • Establish contacts and build relationship o Asses each and every single customer who visit our property and target them to convert into real customers by understanding their needs and settling them to available properties available with us • Establish contacts and build relationship o Focus on Exceptional Communication. Timely, efficient communication should be a priority. Maintain a Positive Attitude. ... • Quarterly update to higher management on market updates o Regular updates on bench market rate, new competitors, new stocks added in Qatar real estate markets. Accordingly update it to higher management for review and assessments
  • 42. MARKETING STRATEGY (THROUGH ONLINE MEDIA) From past 5 years, we are using “Property finder” real estate portal and observed most effective source to promote GUC properties and each to large number of customers. We spent QAR 44K for annual subscriptions Qatar living classified is 2nd best source to promote GUC properties and reach to maximum number of customers. We spent QAR 15K for annual subscriptions We use social media source also to promote GUC properties and generate leads and reach to large number of customers. We spent approx. Amount of QAR 20K on social media
  • 43. MARKETING STRATEGY (THROUGH VARIOUS SOURCES) Specific to commercial properties, as on when required, we promote GUC properties by giving ad. on GULF TIMES We spent approx. amount QAR 10K per year. We lease our property with the help of Real estate agent as well. Approx. QAR80K per year we pay as real estate agent fee We use several way to promote our properties by way of banner ads., pamphlet. Advertising board on building Approx. QAR 15K per year, we spent to use
  • 44. MARKETING STRATEGY (YEAR 2020 AND PAST 4 YEARS COST) Categories Act-20 Act-19 Act-18 Act-17 Act-16 Print advertisement 7,155 6,599 50,252 18,832 9,909 Online advertisement 69,372 67,244 66,413 114,492 73,372 Real Estate Brokerage 72,071 98,820 97,833 103,750 78,500 Total 148,599 172,663 214,498 237,074 161,781 Increase/(Decrease)% -14% -20% -10% 47% 148,599 172,663 214,498 237,074 161,781 -14% -20% -10% 47% ACT-20 ACT-19 ACT-18 ACT-17 ACT-16 Total marketing cost Increase/(Decrease)%
  • 45. MARKETING STRATEGY (YEAR 2021 AND 2 YEARS FORWARD) For year, 2021 and 2 years forward, we will be continuing same platform aggressively to promote GUC commercial and residential properties to reach large number of potential customers and convert them into real customers
  • 46. LEASING DEPARTMENT PROCESS IMPROVEMENT AND IMPLEMENTATION PLAN 1 2 3 Lease agreements 100% renewals before expiry of Lease contracts 0% Erros in Lease agreements 100% compliance in collection documents as per SOP Rent Colletions Specific to Cold stores, ensure to collect PDC as rental and undated deposit as security 100% ensure, Cheques are A/C payee, no. error in cheque. 100% timely collections Approvals/Esclations Ensure wherever any deviation, prior approval must be obtained Ensure, wherever required, it must be esclated to GM and CEO Ensure all obtained approvals are attached with records and kept properly for audit purpose Leasing process Develop better presentation skill by way of communications Learn presentation skills in power points, excel. Keep upto date, with latest market trends, geo political knowledge
  • 47. LEASING DEPARTMENT PROCESS IMPROVEMENT AND IMPLEMENTATION PLAN 1 2 3 Identify risk Always be vigilant to understand and identify risk associated with our property or customers Maintian risk register to update higher management on specific interval. Plan and follow up until, risk is mitigated and close Learn and keep upto date yourself with policies and SOP On regular interval, please review Corporate policy On regular basis, please reading Leasing SOP Suggest, if any changes required in policies and SOP More foruce on customer perosnal profile Improve focuse on customer persona profile Know customer interst, carrer, about family member Must know cabilites of customer to pay monthly rent Property Improvement Suggestion As and often visit, competitors property To know their facilites, Keep suggesting maintenance department for improvement plan as per customer feedback Keep knowledge about latest change and design in real estate portfolio
  • 48. 7,381,638 6,483,722 5,180,692 4,854,237 4,444,503 82.7% 78.0% 72.5% 72.3% 71.2% 2016 2017 2018 2019 2020 EBITDA EBITDA % 8.0% 8.7% 7.4% 7.1% 6.5% 2016 2017 2018 2019 2020 NET YIELD % ON ASSETS MARKET VALUE ( L +B) FINANCIAL PERFORMANCE OF CASCADE I COMPOUND -20% -25% -27% -27% 93M 75M 70M 68M 68M 2016 2017 2018 2019 2020 Growth/Decline Vs 2016 (Land+Build) Market value for land & Building for year 2020 is considered based on year 2019 since latest number are not available Cascade I 2016 2017 2018 2019 2020 Building Cost 21,569,056 15,821,565 14,555,840 14,636,364 14,636,364 LandCost 71,342,600 58,752,432 55,395,096 53,628,143 53,628,143 (Land+Build) 92,911,656 74,573,996 69,950,935 68,264,507 68,264,507 Growth/Decline Vs 2016 -20% -25% -27% -27% Growth/Decline Vs LY -20% -6% -2% 0%
  • 49. 3,907,412 3,594,186 2,713,832 2,695,719 2,515,307 82.6% 77.9% 69.0% 71.9% 71.1% 2016 2017 2018 2019 2020 EBITDA EBITDA % 7.3% 8.3% 6.7% 6.8% 6.4% 2016 2017 2018 2019 2020 NET YIELD % ON ASSETS MARKET VALUE (L+B) FINANCIAL PERFORMANCE OF CASCADE II COMPOUND -19% -24% -26% -26% 53M 43M 41M 39M 39M 2016 2017 2018 2019 2020 Growth/Decline Vs 2016 (Land+Build) Market value for land & Building for year 2020 is considered based on year 2019 since latest number are not available Cascade II 2016 2017 2018 2019 2020 Building Cost 12,108,944 9,178,435 8,444,160 8,363,636 8,363,636 LandCost 41,387,400 34,083,568 32,135,904 31,110,857 31,110,857 (Land+Build) 53,496,344 43,262,004 40,580,065 39,474,493 39,474,493 Growth/Decline Vs 2016 -19% -24% -26% -26% Growth/Decline Vs LY -19% -6% -3% 0%
  • 50. 2,981,981 2,531,334 2,145,462 1,787,261 1,698,453 82.8% 76.8% 72.3% 66.6% 67.6% 2016 2017 2018 2019 2020 EBITDA EBITDA % 8.2% 8.7% 7.4% 6.4% 6.1% 2016 2017 2018 2019 2020 NET YIELD % ON ASSETS MARKET VALUE (L+B) FINANCIAL PERFORMANCE OF RUBY COMPOUND -17% -20% -24% -24% 37M 30M 29M 28M 28M 2016 2017 2018 2019 2020 Growth/Decline Vs 2016 (Land+Build) Market value for land & Building for year 2020 is considered based on year 2019 since latest number are not available Ruby 2016 2017 2018 2019 2020 Building Cost 7,859,100 6,817,000 5,500,000 5,500,000 5,500,000 LandCost 28,695,000 23,593,000 23,593,000 22,318,000 22,318,000 (Land+Build) 36,554,100 30,410,000 29,093,000 27,818,000 27,818,000 Growth/Decline Vs 2016 -17% -20% -24% -24% Growth/Decline Vs LY -17% -4% -4% 0%
  • 51. 1,992,822 1,666,770 1,492,845 1,238,198 1,132,545 82.7% 76.4% 72.1% 64.9% 63.7% 2016 2017 2018 2019 2020 EBITDA EBITDA % 7.9% 7.7% 6.9% 5.9% 5.4% 2016 2017 2018 2019 2020 NET YIELD % ON ASSETS MARKET VALUE (L+B) FINANCIAL PERFORMANCE OF SAPPHIRE COMPOUND -20% -20% -23% -23% 27M 22M 22M 21M 21M 2016 2017 2018 2019 2020 Growth/Decline Vs 2016 (Land+Build) Market value for land & Building for year 2020 is considered based on year 2019 since latest number are not available Sapphire 2016 2017 2018 2019 2020 Building Cost 6,817,200 5,000,000 5,000,000 5,000,000 5,000,000 Land Cost 20,363,000 16,743,000 16,743,000 15,838,000 15,838,000 (Land+Build) 27,180,200 21,743,000 21,743,000 20,838,000 20,838,000 Growth/Decline Vs 2016 -20% -20% -23% -23% Growth/Decline Vs LY -20% 0% -4% 0%
  • 52. 3,450,540 2,899,996 2,414,017 2,097,484 1,852,748 81.7% 76.8% 69.7% 67.5% 65.6% 2016 2017 2018 2019 2020 EBITDA EBITDA % 7.5% 7.5% 6.4% 5.8% 5.2% 2016 2017 2018 2019 2020 NET YIELD % ON ASSETS MARKET VALUE (L+B) FINANCIAL PERFORMANCE OF DIAMOND COMPOUND -18% -20% -23% -23% 47M 39M 38M 36M 36M 2016 2017 2018 2019 2020 Growth/Decline Vs 2016 (Land+Build) Market value for land & Building for year 2020 is considered based on year 2019 since latest number are not available Diamond 2016 2017 2018 2019 2020 Building Cost 9,999,825 8,200,000 7,200,000 7,200,000 7,200,000 LandCost 36,949,000 30,380,000 30,380,000 28,738,000 28,738,000 (Land+Build) 46,948,825 38,580,000 37,580,000 35,938,000 35,938,000 Growth/DeclineVs 2016 -18% -20% -23% -23% Growth/DeclineVs LY -18% -3% -4% 0%
  • 53. FINANCIAL PERFORMANCE OF PEARL GARDEN COMPOUND 5.8% 4.4% 3.8% 3.6% 3.0% 2016 2017 2018 2019 2020 NET YIELD % ON ASSETS MARKET VALUE (L+B) 1,814,928 1,282,672 1,055,235 952,539 789,414 83.0% 61.6% 54.5% 51.8% 47.7% 2016 2017 2018 2019 2020 EBITDA EBITDA % -7% -11% -17% -17% 31M 29M 28M 26M 26M 2016 2017 2018 2019 2020 Growth/Decline Vs 2016 (Land+Build) Market value for land & Building for year 2020 is considered based on year 2019 since latest number are not available Pearl Garden 2,016 2,017 2,018 2,019 2,020 Building Cost 6,922,996 5,978,951 5,978,951 5,349,588 5,349,588 Land Cost 24,529,741 23,303,254 22,076,767 20,850,280 20,850,280 (Land+Build) 31,452,737 29,282,205 28,055,718 26,199,867 26,199,867 Growth/Decline Vs 2016 -7% -11% -17% -17% Growth/Decline Vs LY -7% -4% -7% 0%
  • 54. FINANCIAL PERFORMANCE OF TWIN VILLAS 5.5% 6.2% 4.9% 2.6% 2.6% 2016 2017 2018 2019 2020 NET YIELD % ON ASSETS MARKET VALUE (L+B) 333,610 326,046 256,893 135,262 136,703 83.6% 79.3% 68.0% 70.4% 71.2% 2016 2017 2018 2019 2020 EBITDA EBITDA % -13% -14% -14% -14% 6M 5M 5M 5M 5M 2016 2017 2018 2019 2020 Growth/Decline Vs 2016 (Land+Build) Market value for land & Building for year 2020 is considered based on year 2019 since latest number are not available Twin Villa 2016 2017 2018 2019 2020 Building Cost 1,224,000 1,000,000 900,000 900,000 900,000 LandCost 4,839,000 4,301,000 4,301,000 4,301,000 4,301,000 (Land+Build) 6,063,000 5,301,000 5,201,000 5,201,000 5,201,000 Growth/Decline Vs 2016 -13% -14% -14% -14% Growth/Decline Vs LY -13% -2% 0% 0%
  • 55. FINANCIAL PERFORMANCE OF EWAAN COMPOUND 11,592,112 2,876,716 5,712,551 7,472,806 7,715,573 83.8% 74.3% 69.9% 78.3% 79.0% 2016 2017 2018 2019 2020 EBITDA EBITDA % 4.0% 1.2% 2.4% 3.2% 3.4% 2016 2017 2018 2019 2020 NET YIELD % ON ASSETS MARKET VALUE (L+B) -16% -18% -21% -21% 291M 243M 238M 230M 230M 2016 2017 2018 2019 2020 Growth/Decline Vs 2016 (Land+Build) Market value for land & Building for year 2020 is considered based on year 2019 since latest number are not available Ewan 2016 2017 2018 2019 2020 Building Cost 65,580,000 50,000,000 45,000,000 45,000,000 45,000,000 LandCost 225,600,000 193,371,000 193,371,000 185,314,000 185,314,000 (Land+Build) 291,180,000 243,371,000 238,371,000 230,314,000 230,314,000 Growth/Decline Vs 2016 -16% -18% -21% -21% Growth/Decline Vs LY -16% -2% -3% 0%
  • 56. 1,189,929 938,058 861,369 607,835 747,169 84.1% 72.1% 69.1% 52.8% 69.9% 2016 2017 2018 2019 2020 EBITDA EBITDA % FINANCIAL PERFORMANCE OF NAJMA FLATS 4.8% 3.8% 4.0% 3.1% 3.8% 2016 2017 2018 2019 2020 NET YIELD % ON ASSETS MARKET VALUE (L+B) 0% -14% -20% -20% 25M 25M 21M 20M 20M 2016 2017 2018 2019 2020 Growth/Decline Vs 2016 (Land+Build) Market value for land & Building for year 2020 is considered based on year 2019 since latest number are not available Najma Flat 2016 2017 2018 2019 2020 Building Cost 4,756,000 4,756,000 2,395,460 2,096,040 2,096,040 LandCost 20,147,000 20,147,000 18,962,000 17,777,000 17,777,000 (Land+Build) 24,903,000 24,903,000 21,357,460 19,873,040 19,873,040 Growth/Decline Vs 2016 0% -14% -20% -20% Growth/Decline Vs LY 0% -14% -7% 0%
  • 57. FINANCIAL PERFORMANCE OF IAD (C RING OFFICE) 4,927,520 4,474,525 4,846,343 4,988,358 4,871,946 90.2% 81.9% 88.7% 91.3% 89.2% 2016 2017 2018 2019 2020 EBITDA EBITDA % 3.5% 3.9% 4.4% 4.7% 4.6% 2016 2017 2018 2019 2020 NET YIELD % ON ASSETS MARKET VALUE (L+B) -19% -22% -24% -24% 141M 114M 110M 106M 106M 2016 2017 2018 2019 2020 Growth/Decline Vs 2016 (Land+Build) Market value for land & Building for year 2020 is considered based on year 2019 since latest number are not available IAD Building 2016 2017 2018 2019 2020 Building Cost 13,443,760 13,443,760 9,777,325 8,555,171 8,555,171 Land Cost 127,459,000 100,146,000 100,146,000 97,870,000 97,870,000 (Land+Build) 140,902,760 113,589,760 109,923,325 106,425,171 106,425,171 Growth/Decline Vs 2016 -19% -22% -24% -24% Growth/Decline Vs LY -19% -3% -3% 0%
  • 58. FINANCIAL PERFORMANCE OF ST39 PROPERTIES 11,506,239 10,122,886 8,604,298 6,129,293 5,589,315 84.7% 82.9% 75.6% 62.8% 72.5% 2016 2017 2018 2019 2020 EBITDA EBITDA % 12.2% 12.9% 11.5% 8.8% 8.0% 2016 2017 2018 2019 2020 NET YIELD % ON ASSETS MARKET VALUE (L+B) Market value for land & Book value of Building for year 2020 is considered based on year 2019 since latest number are not available ST39 Projects 2016 2017 2018 2019 2020 Building Cost 35,904,130 35,904,130 35,904,130 35,904,130 35,904,130 Land Cost 58,126,000 42,625,000 38,750,000 33,907,000 33,907,000 (Land+Build) 94,030,130 78,529,130 74,654,130 69,811,130 69,811,130 Growth/Decline Vs 2016 1% -4% -11% -11% Growth/Decline Vs LY -16% -5% -6% 0% -24% -31% -37% -37% 94M 79M 75M 70M 70M 2016 2017 2018 2019 2020 Growth/Decline Vs 2016 (Land+Build)
  • 59. 12,688,725 13,819,179 13,406,947 16,127,095 8,107,241 74.4% 81.1% 78.6% 81.3% 75.1% 2016 2017 2018 2019 2020 EBITDA EBITDA % FINANCIAL PERFORMANCE OF IPW1 STORES 9.0% 11.8% 12.0% 15.1% 7.6% 2016 2017 2018 2019 2020 NET YIELD % ON ASSETS MARKET VALUE (L+B) Market value for land & Book value of Building for year 2020 is considered based on year 2019 since latest number are not available IPW1 2,016 2,017 2,018 2,019 2,020 Building Cost 43,320,375 43,320,375 43,320,375 43,320,375 43,320,375 Land Cost (SQM46K) 97,848,925 73,386,944 68,494,348 63,601,751 63,601,751 (Land+Build) 141,169,300 116,707,319 111,814,723 106,922,126 106,922,126 Growth/Decline Vs 2016 -3% -7% -12% -12% Growth/Decline Vs LY -17% -4% -4% 0% -24% -31% -37% -37% 141M 117M 112M 107M 107M 2016 2017 2018 2019 2020 Growth/Decline Vs 2016 (Land+Build)
  • 60. 1,739,750 1,399,595 1,243,728 1,517,506 58.9% 48.2% 45.3% 55.7% 2017 2018 2019 2020 EBITDA EBITDA % FINANCIAL PERFORMANCE OF ST38 PROPERTIES 6.7% 5.7% 5.3% 6.5% 2017 2018 2019 2020 NET YIELD % ON ASSETS MARKET VALUE (L+B) Market value for land & Book value of Building for year 2020 is considered based on year 2019 since latest number are not available ST38 2016 2017 2018 2019 2020 Building Cost 13,111,614 13,111,614 13,111,614 13,111,614 13,111,614 LandCost 15,545,799 12,664,064 11,515,327 10,363,688 10,363,688 (Land+Build) 28,657,413 25,775,678 24,626,941 23,475,302 23,475,302 Growth/Decline Vs 2017 10% 5% 0% 0% Growth/Decline Vs LY -10% -4% -5% 0% -24% -31% -37% -37% 29M 26M 25M 23M 23M 2016 2017 2018 2019 2020 Growth/Decline Vs 2016 (Land+Build)
  • 61. 6,189,502 7,124,858 55.5% 66.7% 2019 2020 EBITDA EBITDA % FINANCIAL PERFORMANCE OF ST02 COLD STORES 7.2% 8.3% 2019 2020 NET YIELD % ON ASSETS MARKET VALUE (L+B) 0% 0% 0 0 0 88M 88M 2016 2017 2018 2019 2020 Growth/Decline Vs 2019 (Land+Build) ST02 Cold Stores 2,016 2,017 2,018 2,019 2,020 Building Cost 61,186,809 61,186,809 Land Cost 26,974,200 26,974,200 (Land+Build) - - - 88,161,009 88,161,009 Growth/Decline Vs 2019 0% 0% Growth/Decline Vs LY 0% 0%
  • 62. Cost of Operation (Electricity and water cost) Electricity and water cost analysis 2016 2017 2018 2019 2020 Occupancy% 96.3% 86.9% 95.5% 97.1% 95.8% Residential Properties 1,171,729 1,288,098 1,471,879 1,700,063 1,544,780 Increase/Decrease in cost % 9.9% 14.3% 15.5% -9.1% Increase in Kahramaa Tariff 31.0% Occupancy% 100.0% 100.0% 100.0% 100.0% 100.0% ST39 Properties 1,197,113 960,640 1,448,005 1,668,033 1,320,335 Increase/Decrease in cost % -19.8% 50.7% 15.2% -20.8% Increase in Kahramaa Tariff 31.0% Occupancy% 99.1% 85.9% 97.3% 97.0% ST38 Properties 673,133 613,870 618,351 509,576 Increase/Decrease in % -8.8% 0.7% -17.6% Increase in Kahramaa Tariff 31.0% Occupancy% 100.0% 100.0% 100.0% 100.0% 97.5% IPW1 Properties 1,008,902 1,060,894 1,211,133 1,078,676 1,212,583 Increase/Decrease in % 5.2% 14.2% -10.9% 12.4% Occupancy% 96.5% 95.0% 96.7% ST11 Labour Accommod 475,267 376,459 386,853 Increase/Decrease in % -20.8% 2.8% Increase in Kahramaa Tariff Occupancy% 73.8% 80.0% Cold Stores 727,266 784,652 Increase/Decrease in % 7.9% Increase in Kahramaa Tariff Total 3,377,744 3,982,765 5,220,155 6,168,847 5,758,777
  • 63. Cost of Operation (Electricity and water cost) 0 1,197,113 960,640 1,448,005 1,668,033 1,320,335 673,133 613,870 618,351 509,576 0 1,008,902 1,060,894 1,211,133 1,078,676 1,212,583 1 0 0 727,266 784,652 2016 2017 2018 2019 2020 Residential Properties ST39 Properties ST38 Properties IPW1 Properties ST11 Labour Accommod Cold Stores Cold Stores
  • 64. Maintenance Cost analysis Maintenance Cost analysis 2016 2017 2018 2019 2020 Occupancy% 96.3% 86.9% 95.5% 97.1% 95.8% Residential Properties 1,645,765 2,293,618 2,811,448 2,296,459 3,386,489 % of Revenue 4% 7% 8% 6% 9.71% Increase/Decrease in cost % 39.4% 22.6% -18.3% 47.5% Occupancy% 100.0% 100.0% 100.0% 100.0% 100.0% ST39 Properties 112,071 150,944 229,175 1,131,720 400,388 % of Revenue 1% 1% 2% 12% 5.2% Increase/Decrease in cost % 34.7% 51.8% 393.8% -64.6% Occupancy% 40.0% 99.1% 85.9% 97.3% 97.0% ST38 Properties 51,375 78,736 220,203 169,590 243,396 % of Revenue 3% 3% 8% 7% 11% Increase/Decrease in % 53.3% 179.7% -23.0% 43.5% Occupancy% 100.0% 100.0% 100.0% 100.0% 97.5% IPW1 Properties 1,414,991 1,065,381 941,640 768,417 451,527 % of Revenue 8% 6% 6% 5% 4% Increase/Decrease in % -24.7% -11.6% -18.4% -41.2% Occupancy% 96.5% 95.0% 96.7% ST11 Labour Accommod 268,556 260,604 112,882 % of Revenue 9% 9% 6% Increase/Decrease in % -3.0% -56.7% Occupancy% 73.8% 80.0% Cold Stores 1,274,577 1,101,506 % of Revenue 11% 10.3% Increase/Decrease in % -13.6% Total 3,224,201 3,588,679 4,471,021 5,901,367 5,696,188
  • 65. Maintenance Cost analysis 2016 2017 2018 2019 2020 Residential Properties 1.65 2.29 2.81 2.29 3.39 ST39 Properties 0.11 0.15 0.23 1.13 0.40 ST38 Properties 0.05 0.08 0.22 0.17 0.24 IPW1 Properties 1.41 1.07 0.94 0.77 0.45 ST11 Labour Accommod 0.27 0.26 0.12 Cold Stores 1.27 1.10 - 0.50 1.00 1.50 2.00 2.50 3.00 3.50 4.00 Amount in Million
  • 66. Maintenance Cost analysis (Cost reduction plan to be implemented) 1. Quality control – We need to ensure that we are using better quality material and workmanship in order to avoid recuring cost. 2. Warranty/Guarantee- We shall go for materials and service wherever we avail maximum warranty and guarantee without incurring any additional cost. 3. Automation-It is suggested wherever possible, we need to bring automation. (Like, we can add cleaning machine 4. Robust Plan preventive maintenance-We shall ensure PPM is fully implemented and all minor issue is arrested in advance before any machinery get breakdown. 5. Corrective Action- We shall ensure all corrective maintenance to be done as soon it is identified to avoid major cost. 6. Outsourcing work- We shall identify work, which we can be outsourced without adding extra cost as compared to work done internally. 7. Productivity- We shall focus to increase productivity of existing team, will trained them for multitasking job.
  • 67. Cost of Operations (Electricity and water cost reduction in year 2021 and future) 1. Switch100 % to LED to conserve electricity 2. Switch to energy star appliances 3. Plan preventive maintenance schedule to be complied 100% 4. Identifying high usage meter, frequently complain to Kahramaa to replace new meter 5. Those tenants, there electricity and water usage is abnormal higher than other tenants, will be reported abnormal usage. If consumption is not reduced, then additional premium rent will be charged at the time of renewal. 6. To reduce water, if we found any abnormalities to specific water meter, we will investigate on immediate basis for leakage.
  • 68. Finance Department Strategy for the year 2021 and 2 years forward 1. Finance Department –Restructure plan 2. Negotiations and cost control initiative 3. Risk identification and mitigation plan 4. Working capital reduction plan 5. Ensure business plan is achieved 6. Resource productivity measurement initiatives and review mechanism 7. Plan / Roadmap for robust Information system setup and rolling out the MIS with Insights and analytics 8. Continuous improvement areas 9. Policy Compliance Gap Assessment and improvement plan with milestones
  • 69. Finance Department Restructure Plan STAGE 01 •Identify slow performance employee STAGE 02 •Communicate the plan to staff and management STAGE 03 •Perform skill assessment and detailed analysis STAGE 04 •Review and Plan correction STAGE 05 •Execute for replacement plan The identification of slow performance from GUC finance team is already initiated.
  • 70. Negotiations and cost control initiative Working Price review of valid contracts and renewal contracts • For all valid contracts and contracts due for renewal, price will be reviewed by comparing with other service providers. • Accordingly, stiff price negotiations will be done with existing service provider or new service provider. Price comparison with every single item with last purchase • Every single purchase order/service order price will be compared with last purchase. • If we observed if any major increased, then price will be renegotiated . Internal Cost estimations for any major maintenance work • For any major work, there will be internal estimation will be done before we float tender. • We shall ensure, all contractors are renegotiated till GM level.
  • 71. Negotiations and cost control initiative Working Budgetary control • We shall coordinate, every single line items are covered in budgeted cost for the year 2021 and 2 years ahead. • Accordingly, stiff price negotiations will be done and ensure that cost should not surplus budgeted value. Warranty or Guarantee • Every single job, where cost will be above QAR 100K, we shall ensure warranty or guarantee is provided by supplier or contractor.. • As much possible, we shall collect guarantee cheque against retention money or warranty coverage. Variance Log will be maintained • Finance team will maintain report for savings or deficit for every single purchase order or service order.
  • 72. Negotiations and cost control initiative Working Inventory review and physical count • Finance team shall conduct physical verification on every six months and make report for any variance found during physical count. • Finance team shall review trend of usage of material to identify any abnormal usage us any line item. Overtime cost review and control • We shall do monthly comparison in order to track overtime cost increase and decrease. • Accordingly, we shall raise concern to related department to initiate overtime cost. Maintenance cost track assets wise • We shall track wherever possible to track the record of cost for all major assets in order to evaluate capability and replacement plan.
  • 73. Negotiations and cost control initiative Working Capex Cost Control • Finance team ensure, every assets are requested for replacement is fully justified by life of usage, existing appearance, condition of assets. • Finance team shall prepare feasibility study for CAPEX wherever applicable. Accordingly recommend for Capex acquision plan. Comparison of Projects actual performance vs feasibility • Every year, project performance reports will be updated and submitted to management for review. • Accordingly, learning and improvement plan will be recommended to project department. Asses Risk factors • Wherever identical, we shall assess risk and future associated cost. Same will be communicated to management about risk and future associated cost. Also, it will be updated to avoid these risk, what would be current cost.
  • 74. Risk Identification and mitigation plan Work on mitigation plan • Finance team will inform related department to start working on mitigation plan and will keep coordination until it is closed. Risk report to management • Upon identification of risk, immediately. Detailed report will be submitted to management with mitigation plan Risk identification • Finance team shall maintain risk register. • Whenever any type of risk is identified. It will be recorded whether it is related operational, leasing, finance etc.
  • 75. Working Management Cycle Inventory Accounts payable Service Invoice Accounts Receivable Cash
  • 76. Working Capital management plan Working capital management initiatives •All advance payment supplier will be converted to credit supplier. •All existing credit supplier will be renegotiated for credit days. As per SOP, only 3 months inventory will be kept in stock. However, Finance team will reassess the fast moving and slow-moving items and plan accordingly. ` All Cold stores customers will be covered through Post dated cheques and undated deposit. Ontime invoice will be ensure to avoid delay in collection. For any return cheques, immediately legal case will be initiated and parallelly stiff follow up will be done. Ensure bad debts to be NIL, be reviewing customer personas and ability of payment and timely follow up against return cheques Transfer excess cash to Zad Holding after analyzing monthly working capital.
  • 77. Ensure business plan is achieved Obtain approval from management for revised rod map. Propose revised road map to achieve business plan Coordinate with related department head on monthly basis to update on deficit Monthly review of Business plan and variance analysis
  • 78. Resource productivity measurement initiatives and review mechanism Working  At present, there is no specific tool to review resource productivity measurement.  As a service industry, its totally depend on complaint type whether it is major or minor.  From year 2021, we will set up tool based on various KPI to capture productivity of each employee working under Supervisor/manager.  On every quarter, same will be reviewed managers along with supervisor.  Final reports will be submitted to HR and Finance and General Manager
  • 79. Roadmap for robust Information system setup and rolling out the MIS with Insights and analytics STAGE 01 •Addition more experienced team and Trained existing for timely updating of data with accuracy STAGE 02 •Segregate specific MIS reporting to each team member. STAGE 03 •Review and revision by Finance head STAGE 04 •Addition of Risk register as part of Existing MIS STAGE 05 •Revisit every quarter and workout on tool and templet to cover detailed MIS in robust form. This is to be noted, our existing ERP system, doesn’t support for various report required for management. Hence, there will be dependence on MS office for reporting which is time consuming until we create robust tool in Excel.
  • 80. Continuous improvement plan Quality Leasing  Leasing SOP to be revised  Communication and presentation skills for Leasing team Cold Store  WMS to be implemented for Cold Store  Communication and presentation skills for cold store team Maintenance  Maintenance SOP to be revised  Communication and presentation skill to be developed among maintenance Engineers/supervisor approval Finance  Finance SOP to be revised and updated on quarterly basis  Timely reporting  Develop information to improve decision making
  • 81. Continuous Improvement Plan Below areas need to be improved on continues basis which are essentially required to achieve organization objective. 1. Corporate policy and SOP revisit again and again to comply 100% 2. Timely MIS Reporting Process 3. Decision making and approval process 4. Internal Communications Process 5. Record Keeping Process 6. Training Process 7. Internal Audit Process
  • 82. Policy compliance GAP assessment and improvement plan with miles stores Roadmap for robust Information system setup and rolling out the MIS with Insights and analytics  Gap analysis is required on quarterly basis to improve business processes and identify gap between planed and actual performance. This need to be done on consistent basis to recognize which processes need improvement.  Policy not complied: 1. Most of the place, we are following corporate policy however, physical verification of assets is not done as per policy on annual basis. However, we are conducting whenever any tenant vacate the property. 2. Sometimes, we are unable to go for multiple quotes as items are being purchased on existing colour code, similarly and other specification. 3. Many times customer request to delay their cheques for 1 or 2 days due to delay in their salary. However, we insist Leasing department to obtain approval from General Manager. 4. There are some exceptions, however we obtain management approval to fill these gaps by justifying with reasons.
  • 84. Fire Protection system improvement 1) Solving smoke detectors issue for GUC Cold Store by modifying Fire Alarm system as per the Qcdd norms, in alignment with the end user and the Owners objective. 2) Identifying the Fire Fighting pipe water leakage point at St 39 Labor accommodation and warehouse sand rectifying the issue to have proper and healthy Fire Fighting system. 3) Installation of the separate alarm system for all Fire Fighting Pump room accessories like water overflow alarm, Jockey Pump and Electrical Pump Working alarm in the Guard Room. 4) Conducting semi annually Fire Safety Drill to enhance safety awareness to tenants, maintenance team about the Fire safety and Fire extinguishing process and protocol to avoid the Fire risk. 5) Maintaining 100% compliance for complete fire protection system for all site as per the Qcdd standards and regulations.
  • 85. MEP Services Improvement 1. Improving the GUC Cold Store Site Electromechanical Panels, devices safety with the installation of the under and over Voltage shunt trip. 2. Upgrading St 11 IPW site Electrical LV Panel and getting the required authorities' approval to avoid rental Diesel Generators and Diesel Supply cost. 3. Enhancing the Abu hamour properties by replacing old Split Ac Units with new Units and using the old but working Acs in other acceptable areas like Labor accommodation building, warehouses etc.
  • 86. MEP Services Improvement 5. Improving site services like installations of the CCTV Cameras, improvement in the lighting system, Air conditioning unit's new installation etc. 6. Looking for new machines and latest technology for the regular maintenance works like online monitoring system of GUC Cold Store temp. panels to reduce the manpower cost. 7. Continuous monitoring of the electricity and water cost and identifying wastage of water due to leakage and rectifying leakage. As well identifying problematic electric meters and complaining to Kahramaa. 8. Continuous upgrading with latest Govt. authorities' regulations for services and implementing the same at the site in accordance with the end user and the owner's objective.
  • 87. Since the residential building getting older ( above 13 years) whereas our competitors building is 5-6 years old. Hence to we have identified specific areas, which need to be improved in year 2021 and 2 years forward to maintain occupancy and keep attractive potential customers. GUC Property-Improvement and beautification plan in year 2021 and 2 years forward
  • 88. Thanks Gulf United Real Estate Investment Co.