Analytics4Action Evaluation Framework: A Review of Evidence-Based Learning Analytics Interventions at the Open University UK - Part 2 (Examples and Results)
•Download as PPTX, PDF•
1 like•344 views

Rienties, B et al 2015 Analytics4Action Evaluation Framework: A Review of Evidence-Based Learning Analytics Interventions at the Open University UK. Journal of Interactive Media in Education, X(X): X, pp. 1–11, DOI: http://dx.doi.org/10.5334/jime.az

Recommended
Recommended
More Related Content
What's hot
What's hot (20)
Similar to Analytics4Action Evaluation Framework: A Review of Evidence-Based Learning Analytics Interventions at the Open University UK - Part 2 (Examples and Results)
Similar to Analytics4Action Evaluation Framework: A Review of Evidence-Based Learning Analytics Interventions at the Open University UK - Part 2 (Examples and Results) (20)
Recently uploaded
Recently uploaded (20)
Analytics4Action Evaluation Framework: A Review of Evidence-Based Learning Analytics Interventions at the Open University UK - Part 2 (Examples and Results)
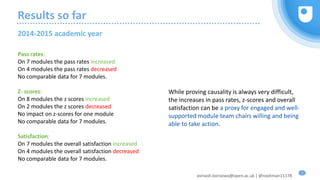
- 1. avinash.boroowa@open.ac.uk | @nashman11178 Results so far Pass rates: On 7 modules the pass rates increased On 4 modules the pass rates decreased No comparable data for 7 modules. Z- scores: On 8 modules the z scores increased On 2 modules the z scores decreased No impact on z-scores for one module No comparable data for 7 modules. Satisfaction: On 7 modules the overall satisfaction increased On 4 modules the overall satisfaction decreased No comparable data for 7 modules. 2014-2015 academic year 1 While proving causality is always very difficult, the increases in pass rates, z-scores and overall satisfaction can be a proxy for engaged and well- supported module team chairs willing and being able to take action.
- 2. avinash.boroowa@open.ac.uk | @nashman11178 A224 Inside music – an example 2 2012J 2013J 2014J 2015J TMA01 92 94 94 97 TMA02 87 88 87 91 TMA03 83 83 84 83 TMA04 74 74 73 TMA05 73 71 71 TMA06 67 64 67 Drops 2012J 2013J 2014J 2015J TMA 1-2 5 6 7 6 TMA 2-3 4 5 3 8 TMA 3-4 9 9 11 TMA 4-5 1 3 2 TMA 5-6 6 7 4 Analytics 4 Action TMA Submissions 0 20 40 60 80 100 120 TMA01 TMA02 TMA03 TMA04 TMA05 TMA06 % of TMA Submissions 2012J 2013J 2014J 2015J 0 2 4 6 8 10 12 TMA 1-2 TMA 2-3 TMA 3-4 TMA 4-5 TMA 5-6 TMA Submission % Drop off between TMAs 2012J 2013J 2014J 2015J Reviewing the TMA data revealed a possible issue between TMAs 03 and 04. The data suggested a significant drop in students submitting TMA04 (11% on the 2014J presentation)
- 3. avinash.boroowa@open.ac.uk | @nashman11178 3 The data also suggested retention was an issue between TMA03 and TMA05. 12% formal withdrawal in this period. A224 Inside music – an example
- 4. avinash.boroowa@open.ac.uk | @nashman11178 4 Investigation of the data showed low engagement with structured content activities 17.22 -17.26 Proposed Action: Rework the content in these activities. A224 Inside music – an example
- 5. avinash.boroowa@open.ac.uk | @nashman11178 5 Data suggests that roughly a quarter of students registered on A224 15J are studying 120 credits. Further investigation required to track their success. Proposed Action: To better advise these students at registration.
- 6. avinash.boroowa@open.ac.uk | @nashman11178 The Problem ● Previous presentations over 500 students registered at start ● Steady attrition means that the two previous presentations had ● Completion rates of 67% and 69% ● Pass rates of 63% and 65% ● 30% of students with lower than A level - PEQs ● High concurrency with other modules (30%) ● Based on feedback, the feeling was that students new to OU study weren’t adequately prepared for what it is to study 30/60 credits. L192 Bon départ: beginners' French 6 The Solution ● Module website opens 3 weeks before start. In those 3 weeks students were offered induction sessions on 1. Materials 2. Tutorials 3. Support 4. Drop-in session for ad-hoc queries ● Rationale: to set the right expectations in the minds of students - what it is to study 30 credits/60 credits ● Targeted at students new to the OU
- 7. avinash.boroowa@open.ac.uk | @nashman11178 The outcomes L192 Bon départ: beginners' French 7 Session attendance Number % Attended session 133 20.37% Did not attend session 520 79.63% Grand Total 653 100.00% Individual session attendance N % Session A - Materials 97 14.85% Session B – Tutorials and OU Live 85 13.02% Session C - Support 53 8.12% Drop-in session 31 4.75% Attended introductory session Did not attend introductory session Total Categories N % N % N % Remained registered at start 131 98.50% 461 88.65% 592 90.66% Withdrew before start 2 1.50% 59 11.35% 61 9.34% Grand Total 133 100.00% 520 100.00% 653 100.00% Withdrawals before module start
- 8. avinash.boroowa@open.ac.uk | @nashman11178 The outcomes L192 Bon départ: beginners' French 8 Attended introductory session Did not attend introductory session Total Categories N % N % N % Registered 119 89.47% 384 73.85% 503 77.03% Withdrawn 14 10.53% 136 26.15% 150 22.97% Grand Total 133 100.00% 520 100.00% 653 100.00% Withdrawals as at 03/03/2016 Attended introductory session Did not attend introductory session Total Categories N % N % N % Submitted TMA1 129 98.47% 411 89.15% 540 91.22% Submitted TMA2 120 91.60% 370 80.26% 490 82.77% Submitted TMA3 109 83.21% 295 63.99% 404 68.24% Grand Total 131 100.00% 460 100.00% 592 100.00% Assignment Submission Rates
- 9. avinash.boroowa@open.ac.uk | @nashman11178 The outcomes L192 Bon départ: beginners' French 9 Attended introductory session Did not attend introductory session Total Average score of TMA 1 87.59 82.15 83.45 Average score of TMA 2 80.25 73.98 75.51 Average score of TMA 3 84.59 78.71 80.29 Average Assessment Scores • Overall significant correlations between attendance and subsequent retention and performance • Number of modules in concurrent study – the group that did not attend the induction session have registered on more modules (in both terms of modules and credits) than those who did - it may be a lack of time that caused them not to engage in the induction session • Proportion of new/continuing students – the group that did not attend the induction session has significantly higher proportion of continuing students. On the whole, it looks like new students were the ones who mostly benefited.
- 11. avinash.boroowa@open.ac.uk | @nashman11178 Evaluating the use of the A4A Framework Technology Acceptance Model (TAM1) 11 ● Explains why a user accepts or rejects a technology. ● Perceived usefulness and perceived ease of use influence intentions to use and actual behaviour. ● Identify what factors explain future intentions to use the innovation and actual usage behaviour The Technology Acceptance Model, version 1. (Davis, Bagozzi & Warshaw 1989)
- 12. avinash.boroowa@open.ac.uk | @nashman11178 Feedback from Data Source Briefing Workshops Perceived usefulness (PU) ● Using the data tools will improve the delivery of the module. ● Using the data tools will increase my productivity. ● Using the data tools will enhance the effectiveness of the teaching on the module. Perceived ease-of-use (PEOU) ● Learning to operate data tools is easy for me. ● I find it easy to get the data tools to do what I want them to do. ● I find the data tools easy to use. Based on Technology Acceptance Model (TAM1) 12 Perceived training requirement ● I expect most staff will need formal training on the data tools Satisfaction with Workshop ● The instructors were enthusiastic in the data briefing. ● The instructors provided clear instructions on what to do. ● Overall, I am satsified with the workshop.
- 18. avinash.boroowa@open.ac.uk | @nashman11178 Feedback from Data Support Meetings Perceived usefulness (PU) ● Using the data tools from the support meeting will enhance the effectiveness of the teaching on the module. ● Using the data tools from the support meeting will improve the delivery of my module. ● Using the data tools from the support meeting will increase my productivity. Perceived ease-of-use (PEOU) ● I find it easy to get the data tools used in the support meetings to do what I want them to do. ● I find the tools used in the support meeting easy to use. ● Learning to operate the data tools used in the support meeting is easy for me. Based on Technology Acceptance Model (TAM1) 18 Perceived training requirement ● Based upon my experience with the data tools used in the support meeting, I expect that most staff will need formal training to use these tools. Satisfaction with Workshop ● The facilitators helped me identify an issue, or an action, that could be taken on my module. ● The facilitators provided a clear interpretation of my module's data. ● The facilitators were enthusiastic in the support meeting. ● Overall, I am satisfied with the support meeting.
- 24. avinash.boroowa@open.ac.uk | @nashman11178 Are there any questions? For further details please contact: ● Avinash Boroowa – avinash.boroowa@open.ac.uk ¦ @nashman11178 ● Bart Rienties – bart.rienties@open.ac.uk ¦ @DrBartRienties ● Dr. Christothea Herodotu – christothea.herodotu@open.ac.uk
- 25. avinash.boroowa@open.ac.uk | @nashman11178 References Agudo-Peregrina, Á. F., Iglesias-Pradas, S., Conde-González, M. Á., & Hernández-García, Á. (2014). Can we predict success from log data in VLEs? Classification of interactions for learning analytics and their relation with performance in VLE-supported F2F and online learning. Computers in Human Behavior, 31(February), 542- 550. doi: 10.1016/j.chb.2013.05.031 Anderson, T., Rourke, L., Garrison, D., & Archer, W. (2001). Assessing teaching presence in a computer conferencing context. Journal of Asynchronous Learning Networks, 5(2), 1-17. Arbaugh, J. B. (2014). System, scholar, or students? Which most influences online MBA course effectiveness? Journal of Computer Assisted Learning, 30(4), 349- 362. doi: 10.1111/jcal.12048 Arnold, K. E., & Pistilli, M. D. (2012). Course signals at Purdue: using learning analytics to increase student success. Paper presented at the Proceedings of the 2nd International Conference on Learning Analytics and Knowledge. Ashby, A. (2004). Monitoring student retention in the Open University: definition, measurement, interpretation and action. Open Learning: The Journal of Open, Distance and e-Learning, 19(1), 65-77. doi: 10.1080/0268051042000177854 Calvert, C. E. (2014). Developing a model and applications for probabilities of student success: a case study of predictive analytics. Open Learning: The Journal of Open, Distance and e-Learning, 29(2), 160-173. doi: 10.1080/02680513.2014.931805 Cleveland-Innes, M., & Campbell, P. (2012). Emotional presence, learning, and the online learning environment. The International Review of Research in Open and Distance Learning, 13(4), 269-292. Clow, D., Cross, S., Ferguson, R., & Rienties, B. (2014). Evidence Hub Review. Milton Keynes: LACE Project. Collins, A., Joseph, D., & Bielaczyc, K. (2004). Design Research: Theoretical and Methodological Issues. The journal of the learning sciences, 13(1), 15-42. Conde, M. Á., & Hernández-García, Á. (2015). Learning analytics for educational decision making. Computers in Human Behavior, 47, 1-3. doi: http://dx.doi.org/10.1016/j.chb.2014.12.034 Conole, G. (2012). Designing for Learning in an Open World. Dordrecht: Springer. Cross, S., Galley, R., Brasher, A., & Weller, M. (2012). Final Project Report of the OULDI-JISC Project: Challenge and Change in Curriculum Design Process, Communities, Visualisation and Practice. York: JISC. Ferguson, R. (2012). Learning analytics: drivers, developments and challenges. International Journal of Technology Enhanced Learning, 4(5), 304-317. doi: 10.1504/ijtel.2012.051816 Ferguson, R., & Buckingham Shum, S. (2012). Social learning analytics: five approaches. Paper presented at the Proceedings of the 2nd International Conference on Learning Analytics and Knowledge, Vancouver, British Columbia, Canada. Garrison, D., Anderson, T., & Archer, W. (2000). Critical inquiry in a text-based environment: Computer conferencing in higher education The Internet and Higher Education, 2(2), 87-105. doi: 10.1016/S1096-7516(00)00016-6 Garrison, D., & Arbaugh, J. B. (2007). Researching the community of inquiry framework: Review, issues, and future directions. The Internet and Higher Education, 10(3), 157-172. doi: DOI: 10.1016/j.iheduc.2007.04.001 25
- 26. avinash.boroowa@open.ac.uk | @nashman11178 References Gasevic, D., Zouaq, A., & Janzen, R. (2013). “Choose your classmates, your GPA is at stake!”: The association of cross-class social ties and academic performance. American Behavioral Scientist, 57(10), 1460-1479. doi: 10.1177/0002764213479362 González-Torres, A., García-Peñalvo, F. J., & Therón, R. (2013). Human–computer interaction in evolutionary visual software analytics. Computers in Human Behavior, 29(2), 486-495. doi: 10.1016/j.chb.2012.01.013 Hattie, J. (2009). Visible Learning: A synthesis of over 800 meta-analyses relating to achievement. New York: Routledge. Hess, F. M., & Saxberg, B. (2013). Breakthrough Leadership in the Digital Age: Using Learning Science to Reboot Schooling. Thousand Oaks: Corwin Press. Inkelaar, T., & Simpson, O. (2015). Challenging the ‘distance education deficit’ through ‘motivational emails’. Open Learning: The Journal of Open, Distance and e- Learning, 1-12. doi: 10.1080/02680513.2015.1055718 Isherwood, M. C. (2009). Developing on-line Learning Aids for M150 Students COLMSCT Final Report. Milton Keynes, UK: The Open University UK. Jordan, S. (2014). Computer-marked assessment as learning analytics. Paper presented at the CALRG Annual Conference, Milton Keynes, UK. McMillan, J. H., & Schumacher, S. (2014). Research in education: Evidence-based inquiry. Harlow: Pearson Higher Ed. Papamitsiou, Z., & Economides, A. (2014). Learning Analytics and Educational Data Mining in Practice: A Systematic Literature Review of Empirical Evidence. Educational Technology & Society, 17(4), 49–64. Richardson, J. T. E. (2012). The attainment of White and ethnic minority students in distance education. Assessment & Evaluation in Higher Education, 37(4), 393- 408. doi: 10.1080/02602938.2010.534767 Rienties, B., & Alden Rivers, B. (2014). Measuring and Understanding Learner Emotions: Evidence and Prospects LACE review papers (Vol. 1). Milton Keynes: LACE. Rienties, B., Cross, S., & Zdrahal, Z. (2016). Implementing a Learning Analytics Intervention and Evaluation Framework: what works? In B. Motidyang & R. Butson (Eds.), Big Data and Learning Analytics in Higher Education Current Theory and Practice. Heidelberg: Springer. Rienties, B., Giesbers, S., Lygo-Baker, S., Ma, S., & Rees, R. (2014). Why some teachers easily learn to use a new Virtual Learning Environment: a Technology Acceptance perspective. Interactive Learning Environments. doi: 10.1080/10494820.2014.881394 Rienties, B., Toetenel, L., & Bryan, A. (2015). “Scaling up” learning design: impact of learning design activities on LMS behavior and performance. Paper presented at the 5th Learning Analytics Knowledge conference, New York. Rienties, B., & Townsend, D. (2012). Integrating ICT in business education: using TPACK to reflect on two course redesigns. In P. Van den Bossche, W. H. Gijselaers & R. G. Milter (Eds.), Learning at the Crossroads of Theory and Practice (Vol. 4, pp. 141-156). Dordrecht: Springer. Siroker, D., & Koomen, P. (2013). A/B Testing: The Most Powerful Way to Turn Clicks Into Customers. New Jersey: John Wiley & Sons. Slade, S., & Prinsloo, P. (2013). Learning Analytics: Ethical Issues and Dilemmas. American Behavioral Scientist, 57(10), 1510-1529. doi: 10.1177/0002764213479366 Slavin, R. E. (2002). Evidence-Based Education Policies: Transforming Educational Practice and Research. Educational Researcher, 31(7), 15-21. doi: 10.2307/3594400 Slavin, R. E. (2008). Perspectives on evidence-based research in education—What works? Issues in synthesizing educational program evaluations. Educational Researcher, 37(1), 5-14. doi: 10.3102/0013189X08314117 26
- 27. avinash.boroowa@open.ac.uk | @nashman11178 References Stenbom, S., Cleveland-Innes, M., & Hrastinski, S. (2014). Online Coaching as a Relationship of Inquiry: Mathematics, online help, and emotional presence. Paper presented at the Eden 2014, Oxford. Tempelaar, D. T., Rienties, B., & Giesbers, B. (2015). In search for the most informative data for feedback generation: Learning Analytics in a data-rich context. Computers in Human Behavior, 47, 157-167. doi: 10.1016/j.chb.2014.05.038 Tingle, R., & Cross, S. (2010). How do 'WP' students differ from others in their engagement with e-learning activities. Paper presented at the OU Widening Participation Conference, Milton Keynes, UK. https://latestendeavour.files.wordpress.com/2010/06/wp_students_engagment_with_elearning_poster_tinglecross2010.pdf Tobarra, L., Robles-Gómez, A., Ros, S., Hernández, R., & Caminero, A. C. (2014). Analyzing the students’ behavior and relevant topics in virtual learning communities. Computers in Human Behavior, 31(0), 659-669. doi: 10.1016/j.chb.2013.10.001 Torgerson, D. J., & Torgerson, C. (2008). Designing randomised trials in health, education and the social sciences: an introduction. London: Palgrave Macmillan. Whitelock, D., Richardson, J., Field, D., Van Labeke, N., & Pulman, S. (2014). Designing and Testing Visual representations of Draft Essays for Higher Education Students. Paper presented at the Learning Analytics Knoweldge conference 2014, Indianapolis. Wolff, A., Zdrahal, Z., Herrmannova, D., Kuzilek, J., & Hlosta, M. (2014). Developing predictive models for early detection of at-risk students on distance learning modules, Workshop: Machine Learning and Learning Analytics Paper presented at the Learning Analytics and Knowledge (2014), Indianapolis. Wolff, A., Zdrahal, Z., Nikolov, A., & Pantucek, M. (2013). Improving retention: predicting at-risk students by analysing clicking behaviour in a virtual learning environment. Paper presented at the Proceedings of the Third International Conference on Learning Analytics and Knowledge. 27
Editor's Notes
- L192 is a compulsory course in the Certificate in French (C33) L192 is an optional course in the BA/BSc (Honours) European Studies (B10) BA (Honours) Humanities (B03) BA (Honours) Modern Language Studies (B30) Certificate of Higher Education in Humanities (C98)
- The technology acceptance model (TAM) is an information systems theory that models how users come to accept and use a technology. The model suggests that when users are presented with a new technology, a number of factors influence their decision about how and when they will use it, notably: Perceived usefulness (PU) – This was defined by Fred Davis as "the degree to which a person believes that using a particular system would enhance his or her job performance". Perceived ease-of-use (PEOU) – Davis defined this as "the degree to which a person believes that using a particular system would be free from effort" (Davis 1989).