SlideShare a Scribd company logo
1 of 21
Download to read offline
Initiation of Coverage
April 17, 2019
Lead Analysts:
Sarah Merzen – smerzen@temple.edu
Christian Springer – christian.springer@temple.edu
Associate Analysts:
Sahil Ghayal – sahil.ghayal@temple.edu
Lana Mansour – lana.mansour@temple.edu
Austin Kane – austin.kane@temple.edu
INVESTMENT THESIS
• Despite its strong performance in the past two years, ATVI stock
dropped by 43.4% due to less than expected sales for Call of Duty: Black
Ops 4 along with weaker than expected retail demand in 4Q’18. In-game
purchases have been weak for ATVI in a number of key properties such
as Overwatch, Hearthstone, Call of Duty (CoD), and World of Warcraft.
• After announcing the new Call of Duty release, ATVI revealed “Diablo
Immortal” game going mobile which faced criticism from PC gamers on
Twitter. Investors overlooked the upcoming Call of Duty release and the
company’s initiative to go mobile and follow the industry trend sending
the stock down by 6.9%
• ATVI sales are up roughly 14.0% since 2016 and earnings per share are
up 25.0%. This is attributed to Activision Blizzard’s highly engaged core
audience globally that should serve as a sustainable foundation to build
on as it seeks to gain market dominance.
• ATVI leveraged industry trends such as growth for digital distribution
and in-game content sales. Activision’s entry to new mobile titles coupled
with altering its resource allocation towards products developments will
further expand the ATVI market share. The company formed a
subsidiary with Tencent to increase market share in Asia as it brings its
major franchises to smartphones.
• ATVI is currently trading at a NTM P/E multiple of 17.60x, a 13.4%
discount to its 1-year average NTM P/E of 19.96x despite its strong
performance in the last two fiscal years and outperformance in earnings.
We believe ATVI will reach its price target of $53.89 as the company
embarks on its concentrated push into mobile with Call of Duty globally
and evolves the games and content updates that will power the next
stages of its growth in 2019-2020.
COMPANY OVERVIEW
Activision Blizzard, Inc. (ATVI) is an international publisher of
interactive entertainment software products with its headquarters in
Santa Monica, CA. It develops content and services for the entertainment
industry and distributes its content and services on video game consoles,
personal computers, and mobile devices. In 2016, ATVI acquired King
Digital Entertainment for $5.8B. ATVI owns some of the world's top
game franchises, including World of Warcraft, Call of Duty (CoD),
Skylanders, StarCraft, and Diablo. ATVI owns licenses for Marvel
Enterprises characters including Spider-Man. ATVI expected next 2Q’19
earnings on May 2, 2019.
Activision Blizzard, Inc.
Exchange: NASDAQ | Ticker: ATVI | Target Price: $53.89
Key Statistics (US$ in M, except per share data)
Price (16 Apr) $45.06 52-Week Low $46.94
Exp. Return ~20% 52-Week High $47.68
Shares O/S 763 Div. Yield 0.78%
Market Cap $36,114 Ent. Value $34,560
One-Year Price Graph
Earnings (Adj.) / Revenue Surprise History
Quarters EPS Revenue Δ Price
1Q’18 9.83% 4.91% (2.30%)
2Q’18 15.82% (0.02%) (3.70%)
3Q’18 5.26% (0.27%) (12.39%)
4Q’18 0.16% (6.70%) 6.96%
Earnings Projections (Adj.)
Q1 Q2 Q3 Q4 FY
2016A $0.22 $0.35 $0.20 $0.27 $1.36
2017A 0.42 0.58 0.33 0.25 2.02
2018E 0.65 0.48 0.38 0.75 2.27
2019E 0.28 0.38 0.40 1.13 2.60
Source: Bloomberg, FactSet, CapIQ
The William C. Dunkelberg Owl Fund does and seeks to do business
with companies covered in its research reports. Thus, investors should be
aware that the fund may have a conflict of interest that could affect the
objectivity of this report. All prices are current as of the end of previous
trading session from date on which report was issued.
0 M
10 M
20 M
30 M
40 M
50 M
60 M
Apr-18 Jul-18 Oct-18 Jan-19 Apr-19
$30
$40
$50
$60
$70
$80
$90
Spring 2019
Electronic Gaming and Entertainment
Page 2
BSX BUSINESS OVERVIEW
Activision (35.96% of FY’18 Revenue):
Activision Publishing, Inc. is an ATVI segment specifically for the console
platforms. It delivers content through retail and digital channels, such as
full-game and in-game sales, along with licensing software to third-party
companies that distribute its products.
• In FY’18, Activision’s net revenues decreased 6.5% YoY due to lower
revenues from the Destiny franchise and lower revenues from Call of
Duty: Infinite Warfare. However, the decrease was offset by higher
revenues from Call of Duty: WWII and sales from the Spyro Reignited
Trilogy.
• In 2010, Activision began an exclusive relationship with Bungie. Inc. (“Bungie”) in order to publish the Destiny
franchise. Effective on December 31, 2018, Activision and Bungie have mutually agreed to terminate the relationship
related to this franchise from weak net revenues from Destiny. Activision no longer owns any rights or obligations
relating to the Destiny franchise which will positively impact the company and boost its margins.
• Activision’s main product franchise is Call of Duty which has been the number one console franchise for nine of the
last ten years despite the volatility in the game’s sales.
Blizzard (33.52% of FY’18 Revenue):
Blizzard Entertainment. Inc (“Blizzard”) is an ATVI segment specifically for the PC platform. Blizzard delivers its content
through channels such as subscriptions, full-game, and in-game sales, along with licensing software to third-party companies
that distribute Blizzard products. Blizzard’s main products include World of Warcraft, StarCraft, Diablo, Hearthstone, and
Overwatch.
• Blizzard maintains an online gaming service, Blizzard Battle.net, which promotes digital distribution of Blizzard and
select Activision content, online social connectivity, and the creation of user-generated content. It also includes the
activities of Overwatch League and Major League Gaming business.
• The increase of 7.1% in Blizzard’s net revenues from FY’17 at $2.14B to FY’18 at $2.29B was due to higher revenues
from World of Warcraft, driven by the release of World of Warcraft: Battle for Azeroth. The increase was offset by
lower revenues from Overwatch.
King (30.52% of FY’18 Revenue):
King Digital Entertainment (“King”) is an ATVI segment primarily for mobile platforms, such as Android and Apple, as
well as distributing on PC platforms via Facebook. While they are free to play, there are in-game purchases with virtual
currency or real currency, as well as in-game advertising for additional revenue. In 2015, ATVI acquired King for $5.9B.
• King had two of the top 10 highest-grossing titles in the U.S. mobile app stores for the last 21 quarters in a row,
according to App Annie Intelligence and internal estimates for the Apple App Store and the Google Play Store
combined.
• The increase of 4.4% in King’s net revenues from FY’17 at $1.89B to FY’18 at $2.09B was due to higher revenues
from the Candy Crush franchise, driven by the launch of Candy Crush Friends Saga, increased monetization, and in-
game advertisements.
• King’s main products include Candy Crush, Farm Heroes, Bubble Witch, Pet Rescue, and Alpha Betty Saga. In 2018,
Candy Crush players sending an average of $4.2mm a day.
Spring 2019
Electronic Gaming and Entertainment
Page 3
INDUSTRY OVERVIEW
Games Going Mobile
• King video game industry is worth more than it has ever been. Its revenue in 2018 was $43.8B, largely in part to hugely
popular games such as Call of Duty and Fortnite.
• Gaming on mobile has grown, 25.5% YoY in 2018 representing 51.0% of the global games market. The industry
continues to benefit from additional players entering the market as interactive entertainment becomes more common
across age groups and as more developing regions gain access to this form of entertainment.
• Further, the wide adoption of smartphones globally and the free-to-play business model on those platforms has
increased the total addressable audience for gaming significantly by introducing gaming to new age groups and new
regions, allowing gaming to occur more widely outside the home. Mobile gaming is estimated to be larger than console
and PC gaming and continues to grow.
Cost of Development Rising
• It is self-evident that the cost of video game development is almost always rising. The games get more complicated,
and users demand larger and larger worlds, particularly in titles like World of Warcraft and Call of Duty (CoD), where
Activision Blizzard thrives. Activision Blizzard and Take-Two Interactive’s operating expenses have surged as they
spent heavily to produce new games last fall. At Electronic Arts, expenses are growing more slowly, but that company
has been relying more on its classic games to help hold costs down.
• Activision Blizzard thrives on console games, which are competing with PC games as well as mobile device games.
Console games are in the process of transitioning to cloud gaming, which would allow consumers to pay a price,
ranging from $10-$30 per month, to connect to a server run by the company. In comparison, PC cloud gaming cost
$20 per year. Cloud gaming would allow the company that owns the game to update the games easier, as well as give
the user access to multiple games for the price, compared to paying a larger fee for one game.
Why High Costs Matter?
• The upside to increased spending in video game development is that the returns can be enormous if the company’s
user base is big enough. It does not cost much to add an incremental user, resulting in video game companies to
generate high margins if they have scale.
• The difficulty Activision and other game makers face today are that they need to design their games to reach profitable
scale with the available users in each of those sub-markets. The scale a game can reach is constrained by the size of the
given market, and they vary widely.
• According to Statista, there are about 2.5B smartphone users in the world today, around 150mm modern gaming
consoles, and fewer than 10mm high-end gaming PCs sold each year (although the market is growing quickly). In other
words, the market you're serving with a given game determines the kind of game you can make, and how much you
need to charge for it.
• There have been a number of models that have worked over the years in video games. PC and console games used to
regularly sell for over $50 up front, and there were many ways for developers to pick up additional revenue by allowing
gamers to buy upgrades after the initial purchase.
• This model works even if just 1mm people buy a game because the revenue per user is very high. On the other end of
the spectrum, mobile games are often free to download, instead of relying for most of their revenue on the sales of
often inexpensive add-ons and upgrades - a model that can work because of the much larger scale achievable in the
mobile market.
• High costs are significant, especially in a transition period for a company and have resulted in Activision Blizzard laying
off of 800 employees, about 8.0% of staff. This is not specific of Activision Blizzard, but it is demonstrated throughout
the industry as other companies such as ArenaNet, Valve, GOG and Electronic Arts have all also announced layoffs
in order to cut costs.
Spring 2019
Electronic Gaming and Entertainment
Page 4
ATVI Timeline
08/20 ↓
ATVI beat 2Q’18 EPS and revenue street estimates by 15.8% surprise rate. However, shares dropped by
3.8% as ATVI only missed FY’19 guidance by $0.01 and we believe investors’ reaction was inflated and
surpassed 2Q’18 success.
09/11 ↑
ATVI stocks appreciated by 8.7%, highest intraday since early 2017, and surpassed its rival EA by “Call of
Duty: Black Ops 4” anticipation and continued momentum for Overwatch League. The new release was
already being praised by gamers and critics and could be a Fortnite killer.
10/15 ↓
Video game stocks declined as the Russell 3000 Electronic Entertainment Index slumps as much as 3.5%.
ATVI (5.0%), TCEHY (5.3%), TTWO (3.5%), EA (2.0%), and JD (2.7%).
10/18 ↓
ATVI stock fell 9.0% after announcing “slow” Call of Duty: Black Ops 4 sales. However, the company
worldwide sales exceeded $500mm or 8mm units sold in the first three days. We believe this fear of slow
sales if overblown as sales have increased in the weekend after the launch and only missed estimates slightly.
Investors based their sentiments on the opening week sales and disregarded the CoD successful history.
11/05 ↓
ATVI shares stumbled by 6.9% after criticism on “Diablo Immortal”, a mobile game that met criticism from
PC gamers on Twitter. We believe this sell-off is unjustified as this is the company’s first initiative to enter
the mobile game market based on the recent shift in consumers appreciating mobile games. In addition,
most of the game critics were PC gamers who we believe are not representative of the mobile gaming
industry.
11/09 ↓
ATVI stock sold off by 7.9% after 3Q’18 earnings despite outperforming quarterly EPS expectations and
in-line revenue due to less than expected guidance of next quarter EPS by $0.04. ATVI slid by 15.0% the
next day as investors are concerned that the upcoming CoD is losing player engagement. However, we
believe investors overshadowed CoD increase of Monthly Active Users (MAU) by 3.0% and net booking
exceeding ATVI outlook by $43mm.
01/08 ↑
ATVI stock rallied by 16.0% after Christmas from Free-to-play options for Black Ops 4 which unlocked
significant value for PC that represent the most successful segment.
01/11 ↓
ATVI announced selling its unprofitable Destiny game to Bungie Inc. resulting in the stock plunging by
13.0% in early trading. However, this decision should be appreciated as it could free up resources for stronger
and new titles.
02/12 ↓
ATVI announced cutting 8.9% of staff as part of restructuring plan companywide in order to increase game
developers focus on most popular titles after the slow growth in in-game monetization resulting in the stock
decline of 6.8% which we view as a positive shift in aiming to focus on core businesses.
Spring 2019
Electronic Gaming and Entertainment
Page 5
UNDERVALUATION & THESIS:
• ATVI is currently trading at a NTM P/E multiple of 17.60x, a 13.4% discount to its 1-year average NTM P/E
of 19.96x despite its strong performance in the last two fiscal years and its outperforming earnings. ATVI stock
dropped by 43.4% from its highest record due to investors’ concerns about the slow Call of Duty launch in the
opening weak and criticism from the “Diablo Immortal” game going mobile. We deem the majority of the drop
be unjustified given the company’s initiative to follow the gaming industry trend in mobile gaming and transition
to live-services development in future projects.
• In October, the stock appreciated by 8.7% attributing the highest intraday since FY’17 from consumers’ praise
of the upcoming Call of Duty: Black Ops 4 and the growth in Overwatch League. However, one month later,
the stock stumbled by 9.0% after the company announced a “slow” Call of Duty: Black Ops 4 sales in the opening
week. We believe this fear of slow sales is inflated as the company sold above 8mm units generating above
$500mm in revenue in three days only. Investors based their sentiments on the opening week sales and
disregarded the CoD successful history.
• In November, Activision launched its first mobile game “Diablo Immortal” in an initiative to follow the industry
trend in shifting to mobile games. However, the game faced criticism on Twitter in #NotMyDiablo dropping the
stock by 7.2%. We believe this drop is unwarranted as most of the opponents are PC gamers, not mobile gamers,
and the main reason behind their negative reproach is the expecting a new PC game instead of a mobile game. In
addition, this was the company’s first shot in entering the massive global mobile gaming market.
• Moving forward, Activision’s two largest opportunities in the next 12-24 months are development of new mobile
titles and improving trends for in-game spending. The company is altering its resource allocation and
development approach to address these areas. Management’s goal is to create better content for its biggest
franchises more quickly. ATVI has a strong portfolio of key franchises, though many appear to be suffering from
fatigue.
• Updating its franchises such as Call of Duty into a live-services game model will increase MAUs due to reduced
costs for players and will therefore contribute to increasing revenue to $7.67B in FY’20. Additionally, refreshing
and adding more content amidst industry-wide transformations including GaaS and Mobile gaming will increase
ATVI’s earnings and send shares back to fair value.
Spring 2019
Electronic Gaming and Entertainment
Page 6
CATALYSTS & DRIVERS:
Call of Duty Taking the Fight to PUBG and Fortnite:
Call of Duty Mobile:
• In coordination with Tencent’s Timi Studio, Activision revealed Call of Duty: Mobile will be released in previously
unannounced regions, including North America, South America, Europe, and others later this year. Call of Duty:
Mobile will be a free-to-play, first-person action game on IOS and Android devices, integrating characters, maps,
modes, and weapons throughout the entire Call of Duty Franchise.
• Consumers of the Call of Duty Mobile app will fight head-to-head with other online players in fan-favorite modes such
as Team Deathmatch, Search and Destroy, and Free-For-All and maps including Nuketown, Crash, and Hijacked.
• With Call of Duty’s limited presence in the Smartphone Global Video Game Market, worth 51.0% of the Global
Games Market or $137.9B, and the industry transitioning toward mobile gaming, approximately 30.0% of ATVI’s
revenue in 2018, ATVI has a promising opportunity for significant growth with a projected 11.0% CAGR from FY’18
to FY’21 in the Mobile Gaming Industry.
• Call of Duty: Mobile is key for ATVI as even if the Call of Duty: Mobile title were to generate $500mm in
revenue, it would result in FY’20 EPS to increase by $0.25 or 9.0%, snapping ATVI out of its current slide.
Forecasts for FY’20 show a 6.0% YoY revenue growth, with potential tailwinds from the explosive growth in the
mobile industry.
Headwind to Tailwind:
• In FY’18, free-to-play games such as Candy Crush Saga were massive hits in the gaming industry. Free-to-Play games
generate all their revenue from microtransactions or advertisements. Microtransactions are in-game purchases in which
consumers purchase small items that add to the game cosmetically or enhance gameplay.
• In the Mobile Gaming Industry, Call of Duty has a limited presence. Previously, it has come out with other mobile
games (Call of Duty: Black Ops - Zombies, Call of Duty: Strike Team, Call of Duty: Zombies, and Call of Duty: Heros),
but nothing like Call of Duty: Mobile has been released.
• Unlike the previous games, Call of Duty: Mobile is a free-to-play, first-person shooter game that resembles the co-op
gameplay from the console Call of Duty games that keep players engaged and encourages them to buy the next edition
annually.
• Through the addition of Call of Duty: Mobile, ATVI will not be losing market share in the Video Game Industry
to free-to-play titles and have a slowing microtransaction headwind. Instead, it will have expanded into the
free-to-play category, converting its slowing microtransaction headwind into a tailwind.
Growth in China
• Tencent Holdings is a Chinese conglomerate specializing in internet-based technology and entertainment. Its
subsidiaries include Epic Games, makers of Fortnite; Riot Games, makers of League of Legends; Supercell, makers
of Clash Royale; and Miniclip, makers of 8 Ball Pool.
• Activision and Tencent announced launching Call of Duty Mobile to the world’s largest gaming market in
China. This partnership will attract tens of millions of loyal fans in China. Tencent’s game platform and
operational expertise to run massive multiplayer online games that can provide strong support to deliver the
immersive and highly interactive game experience to Chinese consumers.
• Mobile-game sales growth picked up recently from a strong year-ago comparison in China and Japan. China should
remain a tailwind to global market growth for the remainder of 2019 now that the freeze on new-game approvals is
thawing. China will account for more than a quarter of all global game revenues by 2020, reaching an estimated $40B.
Mobile is the dominant force in that country, and it will generate ~61.0% of revenues in 2019, growing to ~70.0% of
the market by 2021.
• In 2015, Tencent and ATVI had also partnered to launch Call of Duty Online on PC, which is a free-to-play, first
person shooter like Call of Duty: Mobile. It is estimated its revenue was ~$281.3mm, all from microtransactions.
Spring 2019
Electronic Gaming and Entertainment
Page 7
Games as a Service (GaaS):
Squeezing cash from players
• The Video game industry should keep generating cash flow as a large portion of revenue as developers expand their
largest franchises and leverage the live-services model of game development. The rise of in-game microtransactions
and digital expansion packs is enabling developers to extend the revenue tail of large premium games with in-game
purchase mechanics which also streamline the process.
• The evolution in the videogame industry is helping to drive higher, more recurring cash flows in an industry historically
known for more volatile revenue streams. Dominant game-makers such as Activision have the highest cash flow
margins of 22.1% due to economies of scale and their ability to successfully leverage the coming growth in
the live-services game development model. This is congruent to the expected revenue growth in the video game
industry, represented by a CAGR of 8.0% up to 2023.
• The central paradox of gaming is how all the biggest and most profitable games are free-to-play. Major developers
including EA (maker of world-famous title Apex Legends) are transitioning to a Fortnite-style development cadence
where new content is delivered each week, and ATVI is now testing its run at the free-to-play model with Call of Duty
(CoD). So even if we don't get a Free-to-Play announcement in 2019, ATVI is clearly moving in this direction but in a
methodical, measured way inspiring confidence that its crown-jewel franchises like CoD are being managed
thoughtfully
• Treyarch, the developer that operates under ATVI, released its first in game attempt at a free to play battle royale mode
– as an extension to Call of Duty: Black Ops 4; “Blackout” closely resembles the Fortnite-style play, and was originally
released exclusive on Black Ops 4. If Blackout went permanently free its user base would drastically increase, offset by
fewer full-price sales. As a permanently free service, Blackout revenues would grow much larger than today and the
mode would serve as a large entry point into the franchise. This revenue boost would be offset by pressure on the full-
price $60 business. COD does not disclose specifics but states that it roughly sells ~20mm units per year, for ~$900mm
in sales. If Blackout mode generates ~$300mm in annual revenue, ATVI’s next $60 release would potentially only have
to sell 13mm units to meet its FY’20 revenue goal (compared to the disappointing 14.3mm units sold for COD Black
Ops 4).
• With ownership of major franchises such as Call of Duty, World of Warcraft and Candy Crush, Activision Blizzard is
most optimally-positioned relative to peers in taking advantage of the forthcoming growth in the industry. The
concentration of retail revenues among key titles has continued. For example, the Call of Duty, Candy Crush, and
World of Warcraft franchises, collectively, accounted for 58.0% of consolidated net revenues—and a significantly
higher percentage of operating income for 2018.
Opportunities for Player Investment
• Consumers are increasingly connected to the company’s games through consoles, PCs, and mobile devices. This allows
the company to offer additional digital player investment opportunities directly to consumers on a year-round basis. In
addition to purchasing full games or subscriptions, players can partake in purchasing incremental “in-game content”
including larger downloadable content (DLC) or smaller content, via microtransactions.
• These digital revenue streams tend to be more recurring and have relatively higher profit margins. If executed
properly, additional player investment can increase engagement as it provides more frequent and incremental
content for players. ATVI is best-positioned to take advantage of the industry’s opportunity to grow new forms of
player investment through gaming subscriptions, eSports, and in-game transactions.
• Activision Blizzard is organizing a league for its Overwatch game, one of the company’s fastest growing additions to
its portfolio of world-famous games. Overwatch reached 30mm players and $1.0B in revenue within a year of its
release. The league is one of the several emerging organizations based on video games as a spectator sport. The
Overwatch league has attracted high profile investors including the owner of the New England Patriots Robert Kraft,
which solidifies the company’s ambitions to create a professional eSports league that rivals’ sports leagues such as the
NFL, which will generate increasing profit in years to come.
Spring 2019
Electronic Gaming and Entertainment
Page 8
PEER GROUP ANALYSIS
Electronic Arts Inc. (EA US):
Electronic Arts Inc. develops, publishes, and distributes digital interactive entertainment worldwide. EA has
over 300 million users around the world, across systems such as internet-connected consoles, PCs, and mobile
devices. Electronic Arts is headquartered in Redwood City, California, and does business across the world, led
by consumers in the United States, Canada, and Japan. The rest of the world uses EA Swiss Sarl, which is a sub
department of Electronic Arts that processes payments for the rest of the world not listed above. Electronic
Arts has leading games that are both licensed and its own. The licensed games are Madden, FIFA, and Star Wars,
while its own are Battlefield, Mass Effect, and The Sims. Electronic Arts has segments, which include digital,
packaged games, and live services. FIFA is the top selling game and it brings in about 11.0% of the company’s
total revenue. In FY’18, EA reported net revenue of $5.15B.
Take-Two Interactive Software Inc. (TTWO US)
Take-Two Interactive Software, Inc. develops, markets, distributes, and publishes interactive software games
and accessories, for consoles, handheld gaming systems, and PCs. Take-Two products are sold through physical
retail, digital services, and cloud streaming services. About half of Take-Two’s products are sold in the United
States, and GameStop alone accounts for 20.0% of sales. Take-Two has noticeable subsidiary company’s such
as Rockstar Games and 2K Games, which sell games such as Grand Theft Auto and NBA 2K respectively. Take-
Two has a wide reach across the globe, with 14 studios around the world. Take-Two maintains sales in a
multitude of countries around the globe but has had limited success in Asia/Pacific with the region bringing in
less than 10.0% of sales. Take-Two thrives in console game sales, which resulted in about 83.0% of its revenue,
with the rest coming from games from PCs and other gaming devices. Take-Two Interactive Software Inc. had
$2.0B in FY’18 revenue, which increased from $1.9B in FY’17.
Nintendo Co., LTD (7974 JP):
Nintendo Co., LTD. Globally develops, manufactures, and sells video game hardware and software products for
in home entertainment, as well as home-game products such as cards. Nintendo sells the leading video game
console, the Nintendo Wii, as well as leading handheld devices in the Nintendo DS, which began in 2004.
Nintendo has introduced a no-glasses 3-D version of its handheld device, the Nintendo 3DS which launched in
2011, as well as a follow up version of the Wii, the Wii U, which allows the players to use a controller with a
touch screen, in order to enhance game play. Nintendo is a Japanese company, headquartered in Kyoto, Japan.
Although Nintendo is headquartered in Japan, it has a strong presence around the world which has resulted in
$1.06B in revenue.
Spring 2019
Electronic Gaming and Entertainment
Page 9
COMPS TABLE ANALYSIS
ATVI MOATS
RISKS TO INVESTMENT THESIS
Sales Concentration in Popular Games:
The concentration of retail revenues among key titles
has continued as a trend in the overall interactive
entertainment industry. The top 10 titles accounted
for 38.0% of sales in the U.S in 2018. Most
Activision’s revenues are derived from video games
based on popular franchises and these video games
have been responsible for high percentage of profits.
Diversified Geographic Presence:
Activision has an established presence in multiple
markets worldwide. The company has 500mm active
monthly users in 196 countries. The company's
presence across diverse geographies shields it against
risks associated with adverse economic trends in a
single region. it also provides it exposure to a large
addressable market enhancing revenue.
Piracy Threats:
ATVI faces a threat of its products to experience
piracy and unauthorized copying, and inadequate
intellectual property laws could help prevent the
company from enforcing the technologies. The
process of registering and protecting ATVI’s
copyrights, patents, and trademarks is expensive
while laws to protect its rights are not as strict
globally as they are in the United States.
Third-Party Platforms:
ATVI is highly reliant on its third-party platform
providers and distributors such as Sony and
Nintendo, ATVI’s revenues depend primarily on
the sales of their third-party’s consoles. The
company must be able to predict the success of
consoles in the marketplace and be able to support
the console’s systems with product development.
Market Valuation LTM Financial Statistics LTM Profitability Margins EV Multiples Price Multiples
Net
Equity Enterprise Sales Net EBITDA EBIT Income EV / NTM EV / EV / NTM NTM
Company Ticker Value Value Sales Growth (%) EBITDA Income (%) (%) (%) EBITDA EBITDA Sales P/E P/E P/S
Activision Blizzard Inc. ATVI 36,560 34,530 7,500 6.9% 3,000 1,770 44.9% 29.2% 24.4% 14.7x 12.4x 5.4x 21.7x 18.4x 4.8x
Nintendo Co LTD 7974 39,100 30,300 10,830 115.8% 2,000 2,340 26.5% 26.1% 17.2% - 9.2x 2.8x 21.0x 15.9x 3.6x
Electronic Arts inc. EA 29,850 26,380 5,290 6.3% 1,730 1,310 21.4% 18.8% 20.8% 15.8x 15.3x 5.5x 26.1x 23.1x 6.1x
Take-Two Interactive Softwre TTWO 10,790 9,110 2,580 0.7% 479 564 16.6% 4.2% 14.5% 15.3x 13.0x 3.1x 21.0x 19.3x 3.9x
Mean 29,075 25,080 6,550 32.4% 1,802 1,496 27.4% 19.6% 19.2% 15.3x 12.5x 4.2x 22.5x 19.2x 4.6x
Median 33,205 28,340 6,395 6.6% 1,865 1,540 24.0% 22.5% 19.0% 15.3x 12.7x 4.3x 21.4x 18.9x 4.4x
High 39,100 34,530 10,830 115.8% 3,000 2,340 44.9% 29.2% 24.4% 15.8x 15.3x 5.5x 26.1x 23.1x 6.1x
Low 10,790 9,110 2,580 0.7% 479 564 16.6% 4.2% 14.5% 14.7x 9.2x 2.8x 21.0x 15.9x 3.6x
General LTM Return on Investment LTM Leverage Ratios Coverage Ratios Credit Ratings
Dividend Tot. Debt / Tot. Debt / Tot. Debt / EBITDA / (EBITDA EBIT /
ROIC ROE ROA Yield Cap EBITDA Equity Int. Exp. -Cpx)/Int. Int. Exp.
Company Ticker Tax Rate Beta (%) (%) (%) (%) (%) (x) (%) (x) (x) (x) WACC Moody's S&P
Activision Blizzard Inc. ATVI 13.1% 1.87 13.7% 13.7% 9.9% 0.7% 19.0% 0.9x 23.5% 51.4x 49.8x 33.1x 7.9% Baa1 BBB+
Nintendo Co LTD 7974 29.9% 1.00 - 12.5% 9.6% 2.1% - - - - - - 10.5% N/A N/A
Electronic Arts inc. EA 28.1% 1.67 23.9% 30.1% 16.2% - 17.8% 0.6x 21.6% 25.8x 23.9x 22.0x 7.9% Baa1 BBB+
Take-Two Interactive Softwre TTWO - 1.64 19.8% 21.5% 9.1% - 0.5% - 0.5% - - - 8.7% N/A N/A
Mean 23.7% 1.55 19.1% 19.5% 11.2% 1.4% 12.4% 0.8x 15.2% 38.6x 36.9x 27.6x 8.8% - -
Median 28.1% 1.66 19.8% 17.6% 9.8% 1.4% 17.8% 0.8x 21.6% 38.6x 36.9x 27.6x 8.3% - -
High 29.9% 1.87 23.9% 30.1% 16.2% 2.1% 19.0% 0.9x 23.5% 51.4x 49.8x 33.1x 10.5% - -
Low 13.1% 1.00 13.7% 12.5% 9.1% 0.7% 0.5% 0.6x 0.5% 25.8x 23.9x 22.0x 7.9% - -
Spring 2019
Electronic Gaming and Entertainment
Page 10
Valuation Multiple Sensitivity Analysis (Returns of 15%-30% in Green)
Price Calculation: Average NTM P/E Multiple
17.96x 18.96x 19.96x 20.96x 21.96x
$1.77 $31.79 $33.56 $35.33 $37.10 $38.87
$2.02 $36.28 $38.30 $40.32 $42.34 $44.36
$2.27 $40.77 $43.04 $45.31 $47.58 $49.85
$2.52 $45.26 $47.78 $50.30 $52.82 $55.34
$2.77 $49.75 $52.52 $55.29 $58.06 $60.83
20.00x 21.00x 19.96x 23.00x 24.00x
$1.77 (29.5%) (25.5%) (21.6%) (17.7%) (13.7%)
$2.02 (19.5%) (15.0%) (10.5%) (6.0%) (1.6%)
$2.27 (9.5%) (4.5%) 0.6% 5.6% 10.6%
$2.52 0.4% 6.0% 11.6% 17.2% 22.8%
$2.77 10.4% 16.6% 22.7% 28.8% 35.0%
P/E Valuation LTM Multiple
P/E Valuation LTM Multiple Returns
17.96x 18.96x 19.96x 20.96x 21.96x
$2.20 $39.51 $41.71 $43.91 $46.11 $48.31
$2.45 $44.00 $46.45 $48.90 $51.35 $53.80
$2.70 $48.49 $51.19 $53.89 $56.59 $59.29
$2.95 $52.98 $55.93 $58.88 $61.83 $64.78
$3.20 $57.47 $60.67 $63.87 $67.07 $70.27
16.00x 17.00x 19.96x 19.00x 20.00x
$2.20 (12.3%) (7.4%) (2.5%) 2.3% 7.2%
$2.45 (2.3%) 3.1% 8.5% 14.0% 19.4%
$2.70 7.6% 13.6% 19.6% 25.6% 31.6%
$2.95 17.6% 24.1% 30.7% 37.2% 43.8%
$3.20 27.5% 34.6% 41.7% 48.9% 56.0%
P/E Valuation NTM Multiple
P/E Valuation NTM Multiple Returns
=
`
NTM EPS
$2.70 Target Price
$54.00NTM P/E
20.0x
=
`
% Upside
~20%
Spring 2019
Electronic Gaming and Entertainment
Page 11
FINANCIAL ANALYSIS
Revenue:
• Activision Blizzard total revenue began to decrease
Casual players abandoned the developer's Candy Crush
Saga and other supporting titles. But King Digital's
revenue appreciated 28.0% from 2016 to 2018 because
highly engaged players stayed with its games and per-user
spending increased.
• Revenues from digital online channels increased 6.0% to
$5.8B, or 77.0% of net revenues, as compared to $5.5B,
or 78.0% of net revenues in 2017. In 2018, consolidated
net revenues increased 7.0% to $7.5B and operating
income increased 52.0% to $2.0B as compared to net revenues of $7.0B and operating income of $1.3B YoY.
• The concentration of retail revenues among key titles has continued. For example, the CoD, Candy Crush, and World
of Warcraft franchises, collectively, accounted for 58.0% of consolidated net revenues—and a significantly higher
percentage of our operating income—for 2018.
Monthly Active Users (MAU):
• MAU is a metric that delineates the amount of
individuals over a period of a month who have interacted
with a specific game. Average MAU is calculated by
summing MAU in each month for a selected interval and
then dividing that aggregate sum by the amount of
months in the interval.
• Compared to 3Q’18, 4Q’18 average MAU rose 11mm or
3.0%. This surge is attributed to a 15.2% increase in
Activision’s average MAU from the release of Call of
Duty: Black Ops 4 in October 2018 and a 2.3% rise in
King’s average MAU due to the release of Candy Crush
Friends Saga in October 2018.
• Average MAU in 4Q’18 saw a 29mm or 8.0% drop YoY. This plummet in average MAU is attributed to a 7.6% decline
in King’s average MAU as a result of less engagement from users and a network outage. This outage occurred in 2Q’18
and affected players accessing King’s games and in-game transactions. Additionally, a 12.5% fall in Blizzard’s average
MAU occurred because of low MAU reported from Hearthstone and Overwatch.
Margins:
• The annual gross margin is likely to consistently widen
through 2021, reflecting benefits from the shift to digital
and the purchase of King. Gross margin improved over
the last couple of years as well.
• 4Q’18 gross margin expanded 270 bps year over year to
71.0%, from 68.3% in 4Q’17, which is attributable to the
ongoing digital shift, particularly with Call of Duty: Black
Ops 4 skewing more digital than prior iterations (40.0%
digital download vs. 30.0% last year). Gross margin came
in 140 bps ahead of analysts’ 69.6% expectation.
Spring 2019
Electronic Gaming and Entertainment
Page 12
FINANCIAL ANALYSIS
Earnings:
• ATVI is well positioned to deliver significant
outperformance in 2019 and outsized growth in 2020. A
flattish performance for Call of Duty units, King
outperformance, and mobile strength could drive FY’19
EPS closer to $2.40, well above guidance of $2.10, before
considering Call of Duty on mobile in China and a new
Call of Duty eSports league. A $2.70 EPS figure in 2020
is possible from multiple game releases that would
launch following the company’s “Transition year”.
• Significant growth for Call of Duty: Mobile and/or
Diablo Immortal in the West, a new World of Warcraft
expansion, a frontline Blizzard release, substantial King growth, and Call of Duty Blackout and/or Overwatch going
free-to-play.
• From FY’16-FY’19, the company maintained an average EPS surprise rate of +14.3% with a 4-year CAGR of ~11.0%.
ATVI reported 4Q’18 EPS of $1.29, beating street $1.23 estimates as well as the company’s guidance of $1.27. ATVI
reported $0.94 in 4Q’17. Despite +37.0% EPS growth in 4Q’18 and +14.0% for 2018, and exceeding both 4Q and
full-year guidance, the company is driven to beat its FY’19 guidance of $2.20, which we predict will exceed $2.25.
• ATVI managed to beat earnings per share estimates 8 of 8 times with a 5-year growth of 14.6% and we believe
the company will maintain this record.
Free Cash Flow / Capital Expenditure :
• In FY’18, cash flows from operating activities were
approximately $1.79B, a decrease of 19.0%, as compared
to $2.21B in 2017, however Activision Blizzard Cash Flow
from Operations for the quarter ending December 12,
2018 was $999mm, a 47.1% increase of $470mm YoY,
showing significant outperformance at the end of the year.
• Due to slower growth in the past fiscal year, ATVI’s FCF
margin of 22.8% dipped slightly below the Technology
index of 23.2%. However, as the current developments in
live-services roll out, the company’s FCF margin is
expected to rise to 28.3% in FY’20, above the Index’s
forward average of 23.7%.
• Although sales may decline 12.0% this year, the company can still generate $1.8B or more on free cash flow, giving it
flexibility to invest in new titles, platforms and geographic expansion. Activision will utilize its cash flow this year to
provide higher-quality games with more consistent updates. Additionally, the company plans to emphasize greater
clarity on promising new titles in 2020, which will reassure investors that ATVI can remain a leader in its industry
despite temporary slowdowns.
• Mobile Expansion of Call of Duty and other key franchises will contribute to generating free cash flow beyond
$2.04B in 2020.
• Capex is expected to increase from $29.7mm in 1Q’19 to $32.6mm in 4Q’19, right before dropping to $24.1mm in
1Q’20. Capex dropped to ~$131mm in 2018, as compared to ~$155mm in 2017. In 2019, total capital expenditures
of approximately ~$125mm will be made, primarily for leasehold improvements, computer hardware, and software
purchases.
Spring 2019
Electronic Gaming and Entertainment
Page 13
FINANCIAL ANALYSIS
Net Booking:
• Net bookings is equal to the net amount of physical or
digital goods and services sold in the selected period. This
amount encompasses merchandise, license fees, and
publisher incentives.
• Increased due to high net bookings reported from the in-
game events and features for the Candy Crush franchise
and the release of Destiny 2, Call of Duty:WWII, and Crash
Bandicoot N. Sane Trilogy.
• This net booking increase was slightly counteracted by
lower net bookings reported from Call of Duty: Infinite
Warfare and Overwatch. Additionally, no new release from
World of Warcraft and Skylanders in 2017 compared to 2016 when they announced World of Warcraft: Legion and
Skylanders Imaginators, respectively, resulted in lower net bookings.
• In FY’17-FY’18, Net booking increased by $106mm from $7.2B to $7.26B due to high net bookings reported from
the release of World of Warcraft: Battle for Azeroth and Spyro Reignited Trilogy. Moreover, the increase in both in-game
advertisements and monetization, and the release of Candy Crush Friends Saga raised net bookings.
• This net booking increase was slightly counteracted by lower net bookings reported by Call of Duty: Infinite Warfare and
Overwatch. No new release by the Destiny franchise after Destiny 2 also lowered net bookings in 2018.
Debt:
• On August 24, 2018, ATVI made a voluntary prepayment
of $990mm to fully payoff and extinguish its 2017 team
loan A by using available cash on hand.
• As of FY’18, ATVI had a long-term gross debt of $2.7B,
which decreased from $4.4B in FY’17.
• There has been a decrease of 30.1% in debt-to-equity
ratio from FY’16 to FY’18. The debt-to-equity ratio for
FY’18 is currently 23.5%, while in FY’17 it was 46.4%
and in FY’16 ATVI had a ratio of 53.6%. This decrease
shows that ATVI is considered an above-average
leverage company.
• ATVI has a high cash coverage, meaning that even
though the company may have high debt levels, it is able
to use its borrowings systematically to generate cash flow.
• The ratio of EBITDA to Net Interest in FY’18 is 22.3%,
which has increased from 16.7% in FY’17 and 13.0% in
FY’16. This is beneficial to the company due to making
it a safe investment as they are able to pay off their
interest.
• Moody’s: Baa1: S&P: BBB+
Spring 2019
Electronic Gaming and Entertainment
Page 14
MANAGEMENT
Robert A. Kotick, CEO of Activision Blizzard
Robert A. Kotick has been a director of Activision Blizzard since February 1991, following
his purchase of significant interest in the Company, which was then on the verge of
insolvency, and serves as our Chief Executive Officer. Mr. Kotick was our Chairman and
Chief Executive Officer from February 1991 until July 2008, when he became our President
and Chief Executive Officer. He served as our President from July 2008 until June 2017,
when Mr. Johnson began serving as our President and Chief Operating Officer. Mr. Kotick
is also a member of the board of directors of The Coca-Cola Company, a multinational
beverage corporation, and the boards of trustees for The Center for Early Education and
Harvard-Westlake School.
Collister Johnson, Presiden, and COO of Activision Blizzard
Collister Johnson has served as our President and Chief Operating Officer since June 2017.
From April 2016 until May 2017, he served as the chief operating officer and co-founder of
Altschool, a public benefit, education technology company, where he continues to serve on
the board of directors. Prior to joining Altschool, he held a number of positions of increasing
responsibility at our Company from 2008 to 2016, serving as the chief financial officer and
head of operations of Activision, one of our principal operating units, chief operating officer
of studios for Activision, and senior vice president and chief of staff to our Chief Executive
Officer. Mr. Johnson holds a B.A. degree in ethics, politics, and economics from Yale
University and an M.B.A. degree from Stanford University.
Dennis Durkin, CFO of Activision Blizzard and President of Emerging Brands
Dennis Durkin has served as our Chief Financial Officer and President of Emerging
Businesses since January 2019. Mr. Durkin joined the Company in March 2012 as our Chief
Financial Officer and served in that role until May 2017. He served as our Chief Corporate
Officer from 2017 until 2019. Prior to joining the Company in 2012, Mr. Durkin held several
positions of increasing responsibility at Microsoft, a computing software and hardware
manufacturer, most recently serving as the corporate vice president and chief operating and
financial officer of Microsoft's interactive entertainment business, which included the Xbox
console business. Before joining Microsoft, Mr. Durkin was a financial analyst at Alex. Brown
and Company. Mr. Durkin holds an M.B.A. degree from Harvard University.
Spring 2019
Electronic Gaming and Entertainment
Page 15
APPENDIX
ACTIVISION BLIZZARD VALUATION TABLE - ATVI
$mm except per share
General assumptions
Ticker ATVI
Share price as of last close $45.06
Dividend Yield 0.78%
Latest closing share price date 4/15/2019
Latest diluted share count 764
P/E Valuation LTM EPS Results NTM EPS Estimates
Period 1 EPS $0.65 $0.35
Period 2 EPS $0.49 $0.49
Period 3 EPS $0.38 $0.67
Period 4 EPS $0.75 $1.19
LTM / NTM EPS $2.27 $2.70
Current P/E Multiple 17.60x 17.60x
Target P/E multiple 19.96x 19.96x
Target Price $45.31 $53.89
Equity Return 0.55% 19.60%
Total Return 1.33% 20.38%
EV/EBITDA Valuation LTM EBITDA Results NTM EBITDA Estimates
Period 1 EBITDA $900 $632
Period 2 EBITDA $602 $473
Period 3 EBITDA $415 $444
Period 4 EBITDA $1,079 $1,314
LTM / NTM EBITDA $2,996 $2,863
Current EBITDA Multiple 11.19x 11.19x
Target EBITDA Multiple 13.91x 13.91x
Enterprise Value $41,674 $39,824
Total Debt $2,671 $2,671
Cash $4,225 $4,225
Equity Value $43,228 $41,378
Diluted Shares Outstanding 764 764
Share Price $56.58 $54.16
Equity Return 25.57% 20.20%
Total Return 26.35% 20.98%
Spring 2019
Electronic Gaming and Entertainment
Page 16
Exhibit 1: Activision segments and games
Spring 2019
Electronic Gaming and Entertainment
Page 17
Exhibit 2: Activision revenue by game
Spring 2019
Electronic Gaming and Entertainment
Page 18
Exhibit 3: Activision geographic map and 2017 statistics
Spring 2019
Electronic Gaming and Entertainment
Page 19
Exhibit 4: Activision comps analysis and top brands
Spring 2019
Electronic Gaming and Entertainment
Page 20
Exhibit 5: 2018 Global Games Market
Spring 2019
Electronic Gaming and Entertainment
Page 21
DISCLAIMER
This report is prepared strictly for educational purposes and should not be used as an actual investment guide. The
forward-looking statements contained herein are simply the author’s opinions. The writer does not own any
Activision Blizzard, Inc. (ATVI) stock.
TUIA STATEMENT
Established in honor of Professor William C. Dunkelberg, former Dean of the Fox School of Business, for
his tireless dedication to educating students in “real-world” principles of economics and business, the William
C. Dunkelberg (WCD) Owl Fund will ensure that future generations of students have exposure to a
challenging, practical learning experience. Managed by Fox School of Business graduate and undergraduate
students with oversight from its Board of Directors, the WCD Owl Fund’s goals are threefold:
• Provide students with hands-on investment management experience
• Enable students to work in a team-based setting in consultation with investment professionals.
• Connect student participants with nationally recognized money managers and financial institutions
Earnings from the fund will be reinvested net of fund expenses, which are primarily trading and auditing costs
and partial scholarships for student participants.

More Related Content

What's hot

Soul and Vibe Interactive Inc. Fact Sheet (ROTH Conference 2014)
Soul and Vibe Interactive Inc. Fact Sheet (ROTH Conference 2014)Soul and Vibe Interactive Inc. Fact Sheet (ROTH Conference 2014)
Soul and Vibe Interactive Inc. Fact Sheet (ROTH Conference 2014)Peter Anthony (Tony) Chiodo
 
Idea for innovators (1)
Idea for innovators (1)Idea for innovators (1)
Idea for innovators (1)purnansh1
 
Gamer 2.0, Exploring the use of Gaming, Community, & Social Media
Gamer 2.0, Exploring the use of Gaming, Community, & Social MediaGamer 2.0, Exploring the use of Gaming, Community, & Social Media
Gamer 2.0, Exploring the use of Gaming, Community, & Social MediaChris
 
Mini program games in China report by daxue consulting
Mini program games in China report by daxue consultingMini program games in China report by daxue consulting
Mini program games in China report by daxue consultingDaxue Consulting
 
The future of the gaming industry - Trends and scenarios
The future of the gaming industry - Trends and scenariosThe future of the gaming industry - Trends and scenarios
The future of the gaming industry - Trends and scenariosThanos Papadopoulos
 
Game of data: Data driven game design
Game of data: Data driven game designGame of data: Data driven game design
Game of data: Data driven game designMasih Alagheband
 
Forbes digital gaming report fall 2020_v2
Forbes digital gaming report fall 2020_v2Forbes digital gaming report fall 2020_v2
Forbes digital gaming report fall 2020_v2Sara Cody
 
Player Engagement and In-Game Advertising
Player Engagement and In-Game AdvertisingPlayer Engagement and In-Game Advertising
Player Engagement and In-Game AdvertisingTyler Pace
 
Advergaming Strategy Proposal
Advergaming Strategy ProposalAdvergaming Strategy Proposal
Advergaming Strategy ProposalBorislav Kiprin
 
Video game industry in india
Video game industry in indiaVideo game industry in india
Video game industry in indiaMelvin Babu
 
Global gaming outlook
Global gaming outlookGlobal gaming outlook
Global gaming outlookMarinet Ltd
 
Zapak Franchisee Program
Zapak Franchisee ProgramZapak Franchisee Program
Zapak Franchisee ProgramKaran Arya
 
Product Brochure: Global Digital Gaming Market 2019
Product Brochure: Global Digital Gaming Market 2019Product Brochure: Global Digital Gaming Market 2019
Product Brochure: Global Digital Gaming Market 2019yStats.com
 
Wavemaker express weekly #31 (2021)
Wavemaker express weekly #31 (2021)Wavemaker express weekly #31 (2021)
Wavemaker express weekly #31 (2021)Wavemaker Taiwan
 
SuperData Research eSportsBbrief
SuperData Research eSportsBbriefSuperData Research eSportsBbrief
SuperData Research eSportsBbriefSuperData
 
Mma mobile ecosystem_report_2018
Mma mobile ecosystem_report_2018Mma mobile ecosystem_report_2018
Mma mobile ecosystem_report_2018Social Samosa
 
Unlocking indonesia's esports potentials 2021
Unlocking indonesia's esports potentials 2021Unlocking indonesia's esports potentials 2021
Unlocking indonesia's esports potentials 2021Ossy Indra Wardhani
 

What's hot (20)

Soul and Vibe Interactive Inc. Fact Sheet (ROTH Conference 2014)
Soul and Vibe Interactive Inc. Fact Sheet (ROTH Conference 2014)Soul and Vibe Interactive Inc. Fact Sheet (ROTH Conference 2014)
Soul and Vibe Interactive Inc. Fact Sheet (ROTH Conference 2014)
 
Idea for innovators (1)
Idea for innovators (1)Idea for innovators (1)
Idea for innovators (1)
 
Gamer 2.0, Exploring the use of Gaming, Community, & Social Media
Gamer 2.0, Exploring the use of Gaming, Community, & Social MediaGamer 2.0, Exploring the use of Gaming, Community, & Social Media
Gamer 2.0, Exploring the use of Gaming, Community, & Social Media
 
Mini program games in China report by daxue consulting
Mini program games in China report by daxue consultingMini program games in China report by daxue consulting
Mini program games in China report by daxue consulting
 
The future of the gaming industry - Trends and scenarios
The future of the gaming industry - Trends and scenariosThe future of the gaming industry - Trends and scenarios
The future of the gaming industry - Trends and scenarios
 
Game of data: Data driven game design
Game of data: Data driven game designGame of data: Data driven game design
Game of data: Data driven game design
 
Forbes digital gaming report fall 2020_v2
Forbes digital gaming report fall 2020_v2Forbes digital gaming report fall 2020_v2
Forbes digital gaming report fall 2020_v2
 
Player Engagement and In-Game Advertising
Player Engagement and In-Game AdvertisingPlayer Engagement and In-Game Advertising
Player Engagement and In-Game Advertising
 
Advergaming Strategy Proposal
Advergaming Strategy ProposalAdvergaming Strategy Proposal
Advergaming Strategy Proposal
 
Zapak
ZapakZapak
Zapak
 
Video game industry in india
Video game industry in indiaVideo game industry in india
Video game industry in india
 
Global gaming outlook
Global gaming outlookGlobal gaming outlook
Global gaming outlook
 
Zapak Franchisee Program
Zapak Franchisee ProgramZapak Franchisee Program
Zapak Franchisee Program
 
Short Gamestop
Short Gamestop Short Gamestop
Short Gamestop
 
Product Brochure: Global Digital Gaming Market 2019
Product Brochure: Global Digital Gaming Market 2019Product Brochure: Global Digital Gaming Market 2019
Product Brochure: Global Digital Gaming Market 2019
 
Gamerista 2015 Scenarios for the Future of Digital Games - www.gamerista.net
Gamerista 2015 Scenarios for the Future of Digital Games -  www.gamerista.netGamerista 2015 Scenarios for the Future of Digital Games -  www.gamerista.net
Gamerista 2015 Scenarios for the Future of Digital Games - www.gamerista.net
 
Wavemaker express weekly #31 (2021)
Wavemaker express weekly #31 (2021)Wavemaker express weekly #31 (2021)
Wavemaker express weekly #31 (2021)
 
SuperData Research eSportsBbrief
SuperData Research eSportsBbriefSuperData Research eSportsBbrief
SuperData Research eSportsBbrief
 
Mma mobile ecosystem_report_2018
Mma mobile ecosystem_report_2018Mma mobile ecosystem_report_2018
Mma mobile ecosystem_report_2018
 
Unlocking indonesia's esports potentials 2021
Unlocking indonesia's esports potentials 2021Unlocking indonesia's esports potentials 2021
Unlocking indonesia's esports potentials 2021
 

Similar to Activision Blizzard, Inc. (ATVI) Initiating Coverage Report

Atvi Final Presentation
Atvi Final PresentationAtvi Final Presentation
Atvi Final PresentationCaneskid05
 
Pesquisa: 2024 NewzooPC & Console Gaming Report
Pesquisa: 2024 NewzooPC & Console Gaming ReportPesquisa: 2024 NewzooPC & Console Gaming Report
Pesquisa: 2024 NewzooPC & Console Gaming ReportPedro Zambarda de Araújo
 
GaaS Whitepaper 2011
GaaS Whitepaper 2011GaaS Whitepaper 2011
GaaS Whitepaper 2011Atul Bagga
 
Game Industry - trends
Game Industry - trendsGame Industry - trends
Game Industry - trendsVictory Media
 
Login 2011 Emerging Trends in GaaS
Login 2011 Emerging Trends in GaaSLogin 2011 Emerging Trends in GaaS
Login 2011 Emerging Trends in GaaSAtul Bagga
 
Forbes M+A Digital Gaming Report Spring 2020
Forbes M+A Digital Gaming Report Spring 2020Forbes M+A Digital Gaming Report Spring 2020
Forbes M+A Digital Gaming Report Spring 2020Sara Cody
 
Forbes M+A Digital Gaming Report Spring 2020
Forbes M+A Digital Gaming Report Spring 2020Forbes M+A Digital Gaming Report Spring 2020
Forbes M+A Digital Gaming Report Spring 2020JJLane
 
Data & trends 2014 the digital games industry in review joost van dreunen
Data & trends 2014 the digital games industry in review   joost van dreunenData & trends 2014 the digital games industry in review   joost van dreunen
Data & trends 2014 the digital games industry in review joost van dreunenMary Chan
 
State of Mobile Gaming - 2023
State of Mobile Gaming - 2023State of Mobile Gaming - 2023
State of Mobile Gaming - 2023digitalinasia
 
Examining Social Gaming for the Chinese Market | Kevin Li
Examining Social Gaming for the Chinese Market | Kevin LiExamining Social Gaming for the Chinese Market | Kevin Li
Examining Social Gaming for the Chinese Market | Kevin LiJessica Tams
 
GaaS Whitepaper 2009
GaaS Whitepaper 2009GaaS Whitepaper 2009
GaaS Whitepaper 2009Atul Bagga
 
Digitization in game industry act2: the cloud
Digitization in game industry act2: the cloudDigitization in game industry act2: the cloud
Digitization in game industry act2: the cloudIcônes Ecoles Créatives
 
2015_03_24 Final Research Report - Zynga (FINAL COPY) PDF
2015_03_24 Final Research Report - Zynga (FINAL COPY) PDF2015_03_24 Final Research Report - Zynga (FINAL COPY) PDF
2015_03_24 Final Research Report - Zynga (FINAL COPY) PDFCourtney Fenwick
 
Winter 2020 forbes digital gaming report
Winter 2020 forbes digital gaming reportWinter 2020 forbes digital gaming report
Winter 2020 forbes digital gaming reportSara Cody
 
Newzoo games esports_cloud_metaverse_trends_2022
Newzoo games esports_cloud_metaverse_trends_2022Newzoo games esports_cloud_metaverse_trends_2022
Newzoo games esports_cloud_metaverse_trends_2022digitalinasia
 
Game in progress new business models for the videogame industry
Game in progress new business models for the videogame industryGame in progress new business models for the videogame industry
Game in progress new business models for the videogame industryLuc Bourcier
 
Gaming and eSports for Brands
Gaming and eSports for BrandsGaming and eSports for Brands
Gaming and eSports for BrandsFalk Ebert
 

Similar to Activision Blizzard, Inc. (ATVI) Initiating Coverage Report (20)

Atvi Final Presentation
Atvi Final PresentationAtvi Final Presentation
Atvi Final Presentation
 
Pesquisa: 2024 NewzooPC & Console Gaming Report
Pesquisa: 2024 NewzooPC & Console Gaming ReportPesquisa: 2024 NewzooPC & Console Gaming Report
Pesquisa: 2024 NewzooPC & Console Gaming Report
 
Global digital gaming market 2017-2022
Global digital gaming market 2017-2022 Global digital gaming market 2017-2022
Global digital gaming market 2017-2022
 
Industria Gaming 2023
Industria Gaming 2023Industria Gaming 2023
Industria Gaming 2023
 
GaaS Whitepaper 2011
GaaS Whitepaper 2011GaaS Whitepaper 2011
GaaS Whitepaper 2011
 
Game Industry - trends
Game Industry - trendsGame Industry - trends
Game Industry - trends
 
Login 2011 Emerging Trends in GaaS
Login 2011 Emerging Trends in GaaSLogin 2011 Emerging Trends in GaaS
Login 2011 Emerging Trends in GaaS
 
Forbes M+A Digital Gaming Report Spring 2020
Forbes M+A Digital Gaming Report Spring 2020Forbes M+A Digital Gaming Report Spring 2020
Forbes M+A Digital Gaming Report Spring 2020
 
Forbes M+A Digital Gaming Report Spring 2020
Forbes M+A Digital Gaming Report Spring 2020Forbes M+A Digital Gaming Report Spring 2020
Forbes M+A Digital Gaming Report Spring 2020
 
Data & trends 2014 the digital games industry in review joost van dreunen
Data & trends 2014 the digital games industry in review   joost van dreunenData & trends 2014 the digital games industry in review   joost van dreunen
Data & trends 2014 the digital games industry in review joost van dreunen
 
State of Mobile Gaming - 2023
State of Mobile Gaming - 2023State of Mobile Gaming - 2023
State of Mobile Gaming - 2023
 
Presentation games complete
Presentation games completePresentation games complete
Presentation games complete
 
Examining Social Gaming for the Chinese Market | Kevin Li
Examining Social Gaming for the Chinese Market | Kevin LiExamining Social Gaming for the Chinese Market | Kevin Li
Examining Social Gaming for the Chinese Market | Kevin Li
 
GaaS Whitepaper 2009
GaaS Whitepaper 2009GaaS Whitepaper 2009
GaaS Whitepaper 2009
 
Digitization in game industry act2: the cloud
Digitization in game industry act2: the cloudDigitization in game industry act2: the cloud
Digitization in game industry act2: the cloud
 
2015_03_24 Final Research Report - Zynga (FINAL COPY) PDF
2015_03_24 Final Research Report - Zynga (FINAL COPY) PDF2015_03_24 Final Research Report - Zynga (FINAL COPY) PDF
2015_03_24 Final Research Report - Zynga (FINAL COPY) PDF
 
Winter 2020 forbes digital gaming report
Winter 2020 forbes digital gaming reportWinter 2020 forbes digital gaming report
Winter 2020 forbes digital gaming report
 
Newzoo games esports_cloud_metaverse_trends_2022
Newzoo games esports_cloud_metaverse_trends_2022Newzoo games esports_cloud_metaverse_trends_2022
Newzoo games esports_cloud_metaverse_trends_2022
 
Game in progress new business models for the videogame industry
Game in progress new business models for the videogame industryGame in progress new business models for the videogame industry
Game in progress new business models for the videogame industry
 
Gaming and eSports for Brands
Gaming and eSports for BrandsGaming and eSports for Brands
Gaming and eSports for Brands
 

Recently uploaded

Crayon Activity Handout For the Crayon A
Crayon Activity Handout For the Crayon ACrayon Activity Handout For the Crayon A
Crayon Activity Handout For the Crayon AUnboundStockton
 
“Oh GOSH! Reflecting on Hackteria's Collaborative Practices in a Global Do-It...
“Oh GOSH! Reflecting on Hackteria's Collaborative Practices in a Global Do-It...“Oh GOSH! Reflecting on Hackteria's Collaborative Practices in a Global Do-It...
“Oh GOSH! Reflecting on Hackteria's Collaborative Practices in a Global Do-It...Marc Dusseiller Dusjagr
 
Pharmacognosy Flower 3. Compositae 2023.pdf
Pharmacognosy Flower 3. Compositae 2023.pdfPharmacognosy Flower 3. Compositae 2023.pdf
Pharmacognosy Flower 3. Compositae 2023.pdfMahmoud M. Sallam
 
Enzyme, Pharmaceutical Aids, Miscellaneous Last Part of Chapter no 5th.pdf
Enzyme, Pharmaceutical Aids, Miscellaneous Last Part of Chapter no 5th.pdfEnzyme, Pharmaceutical Aids, Miscellaneous Last Part of Chapter no 5th.pdf
Enzyme, Pharmaceutical Aids, Miscellaneous Last Part of Chapter no 5th.pdfSumit Tiwari
 
Presiding Officer Training module 2024 lok sabha elections
Presiding Officer Training module 2024 lok sabha electionsPresiding Officer Training module 2024 lok sabha elections
Presiding Officer Training module 2024 lok sabha electionsanshu789521
 
Capitol Tech U Doctoral Presentation - April 2024.pptx
Capitol Tech U Doctoral Presentation - April 2024.pptxCapitol Tech U Doctoral Presentation - April 2024.pptx
Capitol Tech U Doctoral Presentation - April 2024.pptxCapitolTechU
 
Computed Fields and api Depends in the Odoo 17
Computed Fields and api Depends in the Odoo 17Computed Fields and api Depends in the Odoo 17
Computed Fields and api Depends in the Odoo 17Celine George
 
Employee wellbeing at the workplace.pptx
Employee wellbeing at the workplace.pptxEmployee wellbeing at the workplace.pptx
Employee wellbeing at the workplace.pptxNirmalaLoungPoorunde1
 
ECONOMIC CONTEXT - LONG FORM TV DRAMA - PPT
ECONOMIC CONTEXT - LONG FORM TV DRAMA - PPTECONOMIC CONTEXT - LONG FORM TV DRAMA - PPT
ECONOMIC CONTEXT - LONG FORM TV DRAMA - PPTiammrhaywood
 
Final demo Grade 9 for demo Plan dessert.pptx
Final demo Grade 9 for demo Plan dessert.pptxFinal demo Grade 9 for demo Plan dessert.pptx
Final demo Grade 9 for demo Plan dessert.pptxAvyJaneVismanos
 
Framing an Appropriate Research Question 6b9b26d93da94caf993c038d9efcdedb.pdf
Framing an Appropriate Research Question 6b9b26d93da94caf993c038d9efcdedb.pdfFraming an Appropriate Research Question 6b9b26d93da94caf993c038d9efcdedb.pdf
Framing an Appropriate Research Question 6b9b26d93da94caf993c038d9efcdedb.pdfUjwalaBharambe
 
How to Make a Pirate ship Primary Education.pptx
How to Make a Pirate ship Primary Education.pptxHow to Make a Pirate ship Primary Education.pptx
How to Make a Pirate ship Primary Education.pptxmanuelaromero2013
 
Introduction to AI in Higher Education_draft.pptx
Introduction to AI in Higher Education_draft.pptxIntroduction to AI in Higher Education_draft.pptx
Introduction to AI in Higher Education_draft.pptxpboyjonauth
 
Full Stack Web Development Course for Beginners
Full Stack Web Development Course  for BeginnersFull Stack Web Development Course  for Beginners
Full Stack Web Development Course for BeginnersSabitha Banu
 
DATA STRUCTURE AND ALGORITHM for beginners
DATA STRUCTURE AND ALGORITHM for beginnersDATA STRUCTURE AND ALGORITHM for beginners
DATA STRUCTURE AND ALGORITHM for beginnersSabitha Banu
 
Organic Name Reactions for the students and aspirants of Chemistry12th.pptx
Organic Name Reactions  for the students and aspirants of Chemistry12th.pptxOrganic Name Reactions  for the students and aspirants of Chemistry12th.pptx
Organic Name Reactions for the students and aspirants of Chemistry12th.pptxVS Mahajan Coaching Centre
 
Types of Journalistic Writing Grade 8.pptx
Types of Journalistic Writing Grade 8.pptxTypes of Journalistic Writing Grade 8.pptx
Types of Journalistic Writing Grade 8.pptxEyham Joco
 
ENGLISH 7_Q4_LESSON 2_ Employing a Variety of Strategies for Effective Interp...
ENGLISH 7_Q4_LESSON 2_ Employing a Variety of Strategies for Effective Interp...ENGLISH 7_Q4_LESSON 2_ Employing a Variety of Strategies for Effective Interp...
ENGLISH 7_Q4_LESSON 2_ Employing a Variety of Strategies for Effective Interp...JhezDiaz1
 

Recently uploaded (20)

Crayon Activity Handout For the Crayon A
Crayon Activity Handout For the Crayon ACrayon Activity Handout For the Crayon A
Crayon Activity Handout For the Crayon A
 
Model Call Girl in Tilak Nagar Delhi reach out to us at 🔝9953056974🔝
Model Call Girl in Tilak Nagar Delhi reach out to us at 🔝9953056974🔝Model Call Girl in Tilak Nagar Delhi reach out to us at 🔝9953056974🔝
Model Call Girl in Tilak Nagar Delhi reach out to us at 🔝9953056974🔝
 
“Oh GOSH! Reflecting on Hackteria's Collaborative Practices in a Global Do-It...
“Oh GOSH! Reflecting on Hackteria's Collaborative Practices in a Global Do-It...“Oh GOSH! Reflecting on Hackteria's Collaborative Practices in a Global Do-It...
“Oh GOSH! Reflecting on Hackteria's Collaborative Practices in a Global Do-It...
 
Pharmacognosy Flower 3. Compositae 2023.pdf
Pharmacognosy Flower 3. Compositae 2023.pdfPharmacognosy Flower 3. Compositae 2023.pdf
Pharmacognosy Flower 3. Compositae 2023.pdf
 
Enzyme, Pharmaceutical Aids, Miscellaneous Last Part of Chapter no 5th.pdf
Enzyme, Pharmaceutical Aids, Miscellaneous Last Part of Chapter no 5th.pdfEnzyme, Pharmaceutical Aids, Miscellaneous Last Part of Chapter no 5th.pdf
Enzyme, Pharmaceutical Aids, Miscellaneous Last Part of Chapter no 5th.pdf
 
Presiding Officer Training module 2024 lok sabha elections
Presiding Officer Training module 2024 lok sabha electionsPresiding Officer Training module 2024 lok sabha elections
Presiding Officer Training module 2024 lok sabha elections
 
Capitol Tech U Doctoral Presentation - April 2024.pptx
Capitol Tech U Doctoral Presentation - April 2024.pptxCapitol Tech U Doctoral Presentation - April 2024.pptx
Capitol Tech U Doctoral Presentation - April 2024.pptx
 
Computed Fields and api Depends in the Odoo 17
Computed Fields and api Depends in the Odoo 17Computed Fields and api Depends in the Odoo 17
Computed Fields and api Depends in the Odoo 17
 
TataKelola dan KamSiber Kecerdasan Buatan v022.pdf
TataKelola dan KamSiber Kecerdasan Buatan v022.pdfTataKelola dan KamSiber Kecerdasan Buatan v022.pdf
TataKelola dan KamSiber Kecerdasan Buatan v022.pdf
 
Employee wellbeing at the workplace.pptx
Employee wellbeing at the workplace.pptxEmployee wellbeing at the workplace.pptx
Employee wellbeing at the workplace.pptx
 
ECONOMIC CONTEXT - LONG FORM TV DRAMA - PPT
ECONOMIC CONTEXT - LONG FORM TV DRAMA - PPTECONOMIC CONTEXT - LONG FORM TV DRAMA - PPT
ECONOMIC CONTEXT - LONG FORM TV DRAMA - PPT
 
Final demo Grade 9 for demo Plan dessert.pptx
Final demo Grade 9 for demo Plan dessert.pptxFinal demo Grade 9 for demo Plan dessert.pptx
Final demo Grade 9 for demo Plan dessert.pptx
 
Framing an Appropriate Research Question 6b9b26d93da94caf993c038d9efcdedb.pdf
Framing an Appropriate Research Question 6b9b26d93da94caf993c038d9efcdedb.pdfFraming an Appropriate Research Question 6b9b26d93da94caf993c038d9efcdedb.pdf
Framing an Appropriate Research Question 6b9b26d93da94caf993c038d9efcdedb.pdf
 
How to Make a Pirate ship Primary Education.pptx
How to Make a Pirate ship Primary Education.pptxHow to Make a Pirate ship Primary Education.pptx
How to Make a Pirate ship Primary Education.pptx
 
Introduction to AI in Higher Education_draft.pptx
Introduction to AI in Higher Education_draft.pptxIntroduction to AI in Higher Education_draft.pptx
Introduction to AI in Higher Education_draft.pptx
 
Full Stack Web Development Course for Beginners
Full Stack Web Development Course  for BeginnersFull Stack Web Development Course  for Beginners
Full Stack Web Development Course for Beginners
 
DATA STRUCTURE AND ALGORITHM for beginners
DATA STRUCTURE AND ALGORITHM for beginnersDATA STRUCTURE AND ALGORITHM for beginners
DATA STRUCTURE AND ALGORITHM for beginners
 
Organic Name Reactions for the students and aspirants of Chemistry12th.pptx
Organic Name Reactions  for the students and aspirants of Chemistry12th.pptxOrganic Name Reactions  for the students and aspirants of Chemistry12th.pptx
Organic Name Reactions for the students and aspirants of Chemistry12th.pptx
 
Types of Journalistic Writing Grade 8.pptx
Types of Journalistic Writing Grade 8.pptxTypes of Journalistic Writing Grade 8.pptx
Types of Journalistic Writing Grade 8.pptx
 
ENGLISH 7_Q4_LESSON 2_ Employing a Variety of Strategies for Effective Interp...
ENGLISH 7_Q4_LESSON 2_ Employing a Variety of Strategies for Effective Interp...ENGLISH 7_Q4_LESSON 2_ Employing a Variety of Strategies for Effective Interp...
ENGLISH 7_Q4_LESSON 2_ Employing a Variety of Strategies for Effective Interp...
 

Activision Blizzard, Inc. (ATVI) Initiating Coverage Report

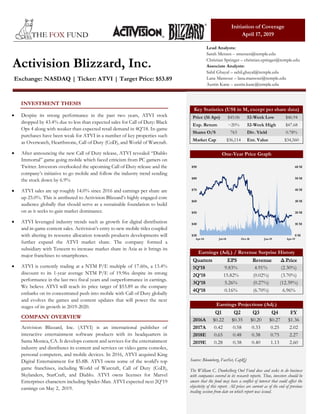
  • 1. Initiation of Coverage April 17, 2019 Lead Analysts: Sarah Merzen – smerzen@temple.edu Christian Springer – christian.springer@temple.edu Associate Analysts: Sahil Ghayal – sahil.ghayal@temple.edu Lana Mansour – lana.mansour@temple.edu Austin Kane – austin.kane@temple.edu INVESTMENT THESIS • Despite its strong performance in the past two years, ATVI stock dropped by 43.4% due to less than expected sales for Call of Duty: Black Ops 4 along with weaker than expected retail demand in 4Q’18. In-game purchases have been weak for ATVI in a number of key properties such as Overwatch, Hearthstone, Call of Duty (CoD), and World of Warcraft. • After announcing the new Call of Duty release, ATVI revealed “Diablo Immortal” game going mobile which faced criticism from PC gamers on Twitter. Investors overlooked the upcoming Call of Duty release and the company’s initiative to go mobile and follow the industry trend sending the stock down by 6.9% • ATVI sales are up roughly 14.0% since 2016 and earnings per share are up 25.0%. This is attributed to Activision Blizzard’s highly engaged core audience globally that should serve as a sustainable foundation to build on as it seeks to gain market dominance. • ATVI leveraged industry trends such as growth for digital distribution and in-game content sales. Activision’s entry to new mobile titles coupled with altering its resource allocation towards products developments will further expand the ATVI market share. The company formed a subsidiary with Tencent to increase market share in Asia as it brings its major franchises to smartphones. • ATVI is currently trading at a NTM P/E multiple of 17.60x, a 13.4% discount to its 1-year average NTM P/E of 19.96x despite its strong performance in the last two fiscal years and outperformance in earnings. We believe ATVI will reach its price target of $53.89 as the company embarks on its concentrated push into mobile with Call of Duty globally and evolves the games and content updates that will power the next stages of its growth in 2019-2020. COMPANY OVERVIEW Activision Blizzard, Inc. (ATVI) is an international publisher of interactive entertainment software products with its headquarters in Santa Monica, CA. It develops content and services for the entertainment industry and distributes its content and services on video game consoles, personal computers, and mobile devices. In 2016, ATVI acquired King Digital Entertainment for $5.8B. ATVI owns some of the world's top game franchises, including World of Warcraft, Call of Duty (CoD), Skylanders, StarCraft, and Diablo. ATVI owns licenses for Marvel Enterprises characters including Spider-Man. ATVI expected next 2Q’19 earnings on May 2, 2019. Activision Blizzard, Inc. Exchange: NASDAQ | Ticker: ATVI | Target Price: $53.89 Key Statistics (US$ in M, except per share data) Price (16 Apr) $45.06 52-Week Low $46.94 Exp. Return ~20% 52-Week High $47.68 Shares O/S 763 Div. Yield 0.78% Market Cap $36,114 Ent. Value $34,560 One-Year Price Graph Earnings (Adj.) / Revenue Surprise History Quarters EPS Revenue Δ Price 1Q’18 9.83% 4.91% (2.30%) 2Q’18 15.82% (0.02%) (3.70%) 3Q’18 5.26% (0.27%) (12.39%) 4Q’18 0.16% (6.70%) 6.96% Earnings Projections (Adj.) Q1 Q2 Q3 Q4 FY 2016A $0.22 $0.35 $0.20 $0.27 $1.36 2017A 0.42 0.58 0.33 0.25 2.02 2018E 0.65 0.48 0.38 0.75 2.27 2019E 0.28 0.38 0.40 1.13 2.60 Source: Bloomberg, FactSet, CapIQ The William C. Dunkelberg Owl Fund does and seeks to do business with companies covered in its research reports. Thus, investors should be aware that the fund may have a conflict of interest that could affect the objectivity of this report. All prices are current as of the end of previous trading session from date on which report was issued. 0 M 10 M 20 M 30 M 40 M 50 M 60 M Apr-18 Jul-18 Oct-18 Jan-19 Apr-19 $30 $40 $50 $60 $70 $80 $90
  • 2. Spring 2019 Electronic Gaming and Entertainment Page 2 BSX BUSINESS OVERVIEW Activision (35.96% of FY’18 Revenue): Activision Publishing, Inc. is an ATVI segment specifically for the console platforms. It delivers content through retail and digital channels, such as full-game and in-game sales, along with licensing software to third-party companies that distribute its products. • In FY’18, Activision’s net revenues decreased 6.5% YoY due to lower revenues from the Destiny franchise and lower revenues from Call of Duty: Infinite Warfare. However, the decrease was offset by higher revenues from Call of Duty: WWII and sales from the Spyro Reignited Trilogy. • In 2010, Activision began an exclusive relationship with Bungie. Inc. (“Bungie”) in order to publish the Destiny franchise. Effective on December 31, 2018, Activision and Bungie have mutually agreed to terminate the relationship related to this franchise from weak net revenues from Destiny. Activision no longer owns any rights or obligations relating to the Destiny franchise which will positively impact the company and boost its margins. • Activision’s main product franchise is Call of Duty which has been the number one console franchise for nine of the last ten years despite the volatility in the game’s sales. Blizzard (33.52% of FY’18 Revenue): Blizzard Entertainment. Inc (“Blizzard”) is an ATVI segment specifically for the PC platform. Blizzard delivers its content through channels such as subscriptions, full-game, and in-game sales, along with licensing software to third-party companies that distribute Blizzard products. Blizzard’s main products include World of Warcraft, StarCraft, Diablo, Hearthstone, and Overwatch. • Blizzard maintains an online gaming service, Blizzard Battle.net, which promotes digital distribution of Blizzard and select Activision content, online social connectivity, and the creation of user-generated content. It also includes the activities of Overwatch League and Major League Gaming business. • The increase of 7.1% in Blizzard’s net revenues from FY’17 at $2.14B to FY’18 at $2.29B was due to higher revenues from World of Warcraft, driven by the release of World of Warcraft: Battle for Azeroth. The increase was offset by lower revenues from Overwatch. King (30.52% of FY’18 Revenue): King Digital Entertainment (“King”) is an ATVI segment primarily for mobile platforms, such as Android and Apple, as well as distributing on PC platforms via Facebook. While they are free to play, there are in-game purchases with virtual currency or real currency, as well as in-game advertising for additional revenue. In 2015, ATVI acquired King for $5.9B. • King had two of the top 10 highest-grossing titles in the U.S. mobile app stores for the last 21 quarters in a row, according to App Annie Intelligence and internal estimates for the Apple App Store and the Google Play Store combined. • The increase of 4.4% in King’s net revenues from FY’17 at $1.89B to FY’18 at $2.09B was due to higher revenues from the Candy Crush franchise, driven by the launch of Candy Crush Friends Saga, increased monetization, and in- game advertisements. • King’s main products include Candy Crush, Farm Heroes, Bubble Witch, Pet Rescue, and Alpha Betty Saga. In 2018, Candy Crush players sending an average of $4.2mm a day.
  • 3. Spring 2019 Electronic Gaming and Entertainment Page 3 INDUSTRY OVERVIEW Games Going Mobile • King video game industry is worth more than it has ever been. Its revenue in 2018 was $43.8B, largely in part to hugely popular games such as Call of Duty and Fortnite. • Gaming on mobile has grown, 25.5% YoY in 2018 representing 51.0% of the global games market. The industry continues to benefit from additional players entering the market as interactive entertainment becomes more common across age groups and as more developing regions gain access to this form of entertainment. • Further, the wide adoption of smartphones globally and the free-to-play business model on those platforms has increased the total addressable audience for gaming significantly by introducing gaming to new age groups and new regions, allowing gaming to occur more widely outside the home. Mobile gaming is estimated to be larger than console and PC gaming and continues to grow. Cost of Development Rising • It is self-evident that the cost of video game development is almost always rising. The games get more complicated, and users demand larger and larger worlds, particularly in titles like World of Warcraft and Call of Duty (CoD), where Activision Blizzard thrives. Activision Blizzard and Take-Two Interactive’s operating expenses have surged as they spent heavily to produce new games last fall. At Electronic Arts, expenses are growing more slowly, but that company has been relying more on its classic games to help hold costs down. • Activision Blizzard thrives on console games, which are competing with PC games as well as mobile device games. Console games are in the process of transitioning to cloud gaming, which would allow consumers to pay a price, ranging from $10-$30 per month, to connect to a server run by the company. In comparison, PC cloud gaming cost $20 per year. Cloud gaming would allow the company that owns the game to update the games easier, as well as give the user access to multiple games for the price, compared to paying a larger fee for one game. Why High Costs Matter? • The upside to increased spending in video game development is that the returns can be enormous if the company’s user base is big enough. It does not cost much to add an incremental user, resulting in video game companies to generate high margins if they have scale. • The difficulty Activision and other game makers face today are that they need to design their games to reach profitable scale with the available users in each of those sub-markets. The scale a game can reach is constrained by the size of the given market, and they vary widely. • According to Statista, there are about 2.5B smartphone users in the world today, around 150mm modern gaming consoles, and fewer than 10mm high-end gaming PCs sold each year (although the market is growing quickly). In other words, the market you're serving with a given game determines the kind of game you can make, and how much you need to charge for it. • There have been a number of models that have worked over the years in video games. PC and console games used to regularly sell for over $50 up front, and there were many ways for developers to pick up additional revenue by allowing gamers to buy upgrades after the initial purchase. • This model works even if just 1mm people buy a game because the revenue per user is very high. On the other end of the spectrum, mobile games are often free to download, instead of relying for most of their revenue on the sales of often inexpensive add-ons and upgrades - a model that can work because of the much larger scale achievable in the mobile market. • High costs are significant, especially in a transition period for a company and have resulted in Activision Blizzard laying off of 800 employees, about 8.0% of staff. This is not specific of Activision Blizzard, but it is demonstrated throughout the industry as other companies such as ArenaNet, Valve, GOG and Electronic Arts have all also announced layoffs in order to cut costs.
  • 4. Spring 2019 Electronic Gaming and Entertainment Page 4 ATVI Timeline 08/20 ↓ ATVI beat 2Q’18 EPS and revenue street estimates by 15.8% surprise rate. However, shares dropped by 3.8% as ATVI only missed FY’19 guidance by $0.01 and we believe investors’ reaction was inflated and surpassed 2Q’18 success. 09/11 ↑ ATVI stocks appreciated by 8.7%, highest intraday since early 2017, and surpassed its rival EA by “Call of Duty: Black Ops 4” anticipation and continued momentum for Overwatch League. The new release was already being praised by gamers and critics and could be a Fortnite killer. 10/15 ↓ Video game stocks declined as the Russell 3000 Electronic Entertainment Index slumps as much as 3.5%. ATVI (5.0%), TCEHY (5.3%), TTWO (3.5%), EA (2.0%), and JD (2.7%). 10/18 ↓ ATVI stock fell 9.0% after announcing “slow” Call of Duty: Black Ops 4 sales. However, the company worldwide sales exceeded $500mm or 8mm units sold in the first three days. We believe this fear of slow sales if overblown as sales have increased in the weekend after the launch and only missed estimates slightly. Investors based their sentiments on the opening week sales and disregarded the CoD successful history. 11/05 ↓ ATVI shares stumbled by 6.9% after criticism on “Diablo Immortal”, a mobile game that met criticism from PC gamers on Twitter. We believe this sell-off is unjustified as this is the company’s first initiative to enter the mobile game market based on the recent shift in consumers appreciating mobile games. In addition, most of the game critics were PC gamers who we believe are not representative of the mobile gaming industry. 11/09 ↓ ATVI stock sold off by 7.9% after 3Q’18 earnings despite outperforming quarterly EPS expectations and in-line revenue due to less than expected guidance of next quarter EPS by $0.04. ATVI slid by 15.0% the next day as investors are concerned that the upcoming CoD is losing player engagement. However, we believe investors overshadowed CoD increase of Monthly Active Users (MAU) by 3.0% and net booking exceeding ATVI outlook by $43mm. 01/08 ↑ ATVI stock rallied by 16.0% after Christmas from Free-to-play options for Black Ops 4 which unlocked significant value for PC that represent the most successful segment. 01/11 ↓ ATVI announced selling its unprofitable Destiny game to Bungie Inc. resulting in the stock plunging by 13.0% in early trading. However, this decision should be appreciated as it could free up resources for stronger and new titles. 02/12 ↓ ATVI announced cutting 8.9% of staff as part of restructuring plan companywide in order to increase game developers focus on most popular titles after the slow growth in in-game monetization resulting in the stock decline of 6.8% which we view as a positive shift in aiming to focus on core businesses.
  • 5. Spring 2019 Electronic Gaming and Entertainment Page 5 UNDERVALUATION & THESIS: • ATVI is currently trading at a NTM P/E multiple of 17.60x, a 13.4% discount to its 1-year average NTM P/E of 19.96x despite its strong performance in the last two fiscal years and its outperforming earnings. ATVI stock dropped by 43.4% from its highest record due to investors’ concerns about the slow Call of Duty launch in the opening weak and criticism from the “Diablo Immortal” game going mobile. We deem the majority of the drop be unjustified given the company’s initiative to follow the gaming industry trend in mobile gaming and transition to live-services development in future projects. • In October, the stock appreciated by 8.7% attributing the highest intraday since FY’17 from consumers’ praise of the upcoming Call of Duty: Black Ops 4 and the growth in Overwatch League. However, one month later, the stock stumbled by 9.0% after the company announced a “slow” Call of Duty: Black Ops 4 sales in the opening week. We believe this fear of slow sales is inflated as the company sold above 8mm units generating above $500mm in revenue in three days only. Investors based their sentiments on the opening week sales and disregarded the CoD successful history. • In November, Activision launched its first mobile game “Diablo Immortal” in an initiative to follow the industry trend in shifting to mobile games. However, the game faced criticism on Twitter in #NotMyDiablo dropping the stock by 7.2%. We believe this drop is unwarranted as most of the opponents are PC gamers, not mobile gamers, and the main reason behind their negative reproach is the expecting a new PC game instead of a mobile game. In addition, this was the company’s first shot in entering the massive global mobile gaming market. • Moving forward, Activision’s two largest opportunities in the next 12-24 months are development of new mobile titles and improving trends for in-game spending. The company is altering its resource allocation and development approach to address these areas. Management’s goal is to create better content for its biggest franchises more quickly. ATVI has a strong portfolio of key franchises, though many appear to be suffering from fatigue. • Updating its franchises such as Call of Duty into a live-services game model will increase MAUs due to reduced costs for players and will therefore contribute to increasing revenue to $7.67B in FY’20. Additionally, refreshing and adding more content amidst industry-wide transformations including GaaS and Mobile gaming will increase ATVI’s earnings and send shares back to fair value.
  • 6. Spring 2019 Electronic Gaming and Entertainment Page 6 CATALYSTS & DRIVERS: Call of Duty Taking the Fight to PUBG and Fortnite: Call of Duty Mobile: • In coordination with Tencent’s Timi Studio, Activision revealed Call of Duty: Mobile will be released in previously unannounced regions, including North America, South America, Europe, and others later this year. Call of Duty: Mobile will be a free-to-play, first-person action game on IOS and Android devices, integrating characters, maps, modes, and weapons throughout the entire Call of Duty Franchise. • Consumers of the Call of Duty Mobile app will fight head-to-head with other online players in fan-favorite modes such as Team Deathmatch, Search and Destroy, and Free-For-All and maps including Nuketown, Crash, and Hijacked. • With Call of Duty’s limited presence in the Smartphone Global Video Game Market, worth 51.0% of the Global Games Market or $137.9B, and the industry transitioning toward mobile gaming, approximately 30.0% of ATVI’s revenue in 2018, ATVI has a promising opportunity for significant growth with a projected 11.0% CAGR from FY’18 to FY’21 in the Mobile Gaming Industry. • Call of Duty: Mobile is key for ATVI as even if the Call of Duty: Mobile title were to generate $500mm in revenue, it would result in FY’20 EPS to increase by $0.25 or 9.0%, snapping ATVI out of its current slide. Forecasts for FY’20 show a 6.0% YoY revenue growth, with potential tailwinds from the explosive growth in the mobile industry. Headwind to Tailwind: • In FY’18, free-to-play games such as Candy Crush Saga were massive hits in the gaming industry. Free-to-Play games generate all their revenue from microtransactions or advertisements. Microtransactions are in-game purchases in which consumers purchase small items that add to the game cosmetically or enhance gameplay. • In the Mobile Gaming Industry, Call of Duty has a limited presence. Previously, it has come out with other mobile games (Call of Duty: Black Ops - Zombies, Call of Duty: Strike Team, Call of Duty: Zombies, and Call of Duty: Heros), but nothing like Call of Duty: Mobile has been released. • Unlike the previous games, Call of Duty: Mobile is a free-to-play, first-person shooter game that resembles the co-op gameplay from the console Call of Duty games that keep players engaged and encourages them to buy the next edition annually. • Through the addition of Call of Duty: Mobile, ATVI will not be losing market share in the Video Game Industry to free-to-play titles and have a slowing microtransaction headwind. Instead, it will have expanded into the free-to-play category, converting its slowing microtransaction headwind into a tailwind. Growth in China • Tencent Holdings is a Chinese conglomerate specializing in internet-based technology and entertainment. Its subsidiaries include Epic Games, makers of Fortnite; Riot Games, makers of League of Legends; Supercell, makers of Clash Royale; and Miniclip, makers of 8 Ball Pool. • Activision and Tencent announced launching Call of Duty Mobile to the world’s largest gaming market in China. This partnership will attract tens of millions of loyal fans in China. Tencent’s game platform and operational expertise to run massive multiplayer online games that can provide strong support to deliver the immersive and highly interactive game experience to Chinese consumers. • Mobile-game sales growth picked up recently from a strong year-ago comparison in China and Japan. China should remain a tailwind to global market growth for the remainder of 2019 now that the freeze on new-game approvals is thawing. China will account for more than a quarter of all global game revenues by 2020, reaching an estimated $40B. Mobile is the dominant force in that country, and it will generate ~61.0% of revenues in 2019, growing to ~70.0% of the market by 2021. • In 2015, Tencent and ATVI had also partnered to launch Call of Duty Online on PC, which is a free-to-play, first person shooter like Call of Duty: Mobile. It is estimated its revenue was ~$281.3mm, all from microtransactions.
  • 7. Spring 2019 Electronic Gaming and Entertainment Page 7 Games as a Service (GaaS): Squeezing cash from players • The Video game industry should keep generating cash flow as a large portion of revenue as developers expand their largest franchises and leverage the live-services model of game development. The rise of in-game microtransactions and digital expansion packs is enabling developers to extend the revenue tail of large premium games with in-game purchase mechanics which also streamline the process. • The evolution in the videogame industry is helping to drive higher, more recurring cash flows in an industry historically known for more volatile revenue streams. Dominant game-makers such as Activision have the highest cash flow margins of 22.1% due to economies of scale and their ability to successfully leverage the coming growth in the live-services game development model. This is congruent to the expected revenue growth in the video game industry, represented by a CAGR of 8.0% up to 2023. • The central paradox of gaming is how all the biggest and most profitable games are free-to-play. Major developers including EA (maker of world-famous title Apex Legends) are transitioning to a Fortnite-style development cadence where new content is delivered each week, and ATVI is now testing its run at the free-to-play model with Call of Duty (CoD). So even if we don't get a Free-to-Play announcement in 2019, ATVI is clearly moving in this direction but in a methodical, measured way inspiring confidence that its crown-jewel franchises like CoD are being managed thoughtfully • Treyarch, the developer that operates under ATVI, released its first in game attempt at a free to play battle royale mode – as an extension to Call of Duty: Black Ops 4; “Blackout” closely resembles the Fortnite-style play, and was originally released exclusive on Black Ops 4. If Blackout went permanently free its user base would drastically increase, offset by fewer full-price sales. As a permanently free service, Blackout revenues would grow much larger than today and the mode would serve as a large entry point into the franchise. This revenue boost would be offset by pressure on the full- price $60 business. COD does not disclose specifics but states that it roughly sells ~20mm units per year, for ~$900mm in sales. If Blackout mode generates ~$300mm in annual revenue, ATVI’s next $60 release would potentially only have to sell 13mm units to meet its FY’20 revenue goal (compared to the disappointing 14.3mm units sold for COD Black Ops 4). • With ownership of major franchises such as Call of Duty, World of Warcraft and Candy Crush, Activision Blizzard is most optimally-positioned relative to peers in taking advantage of the forthcoming growth in the industry. The concentration of retail revenues among key titles has continued. For example, the Call of Duty, Candy Crush, and World of Warcraft franchises, collectively, accounted for 58.0% of consolidated net revenues—and a significantly higher percentage of operating income for 2018. Opportunities for Player Investment • Consumers are increasingly connected to the company’s games through consoles, PCs, and mobile devices. This allows the company to offer additional digital player investment opportunities directly to consumers on a year-round basis. In addition to purchasing full games or subscriptions, players can partake in purchasing incremental “in-game content” including larger downloadable content (DLC) or smaller content, via microtransactions. • These digital revenue streams tend to be more recurring and have relatively higher profit margins. If executed properly, additional player investment can increase engagement as it provides more frequent and incremental content for players. ATVI is best-positioned to take advantage of the industry’s opportunity to grow new forms of player investment through gaming subscriptions, eSports, and in-game transactions. • Activision Blizzard is organizing a league for its Overwatch game, one of the company’s fastest growing additions to its portfolio of world-famous games. Overwatch reached 30mm players and $1.0B in revenue within a year of its release. The league is one of the several emerging organizations based on video games as a spectator sport. The Overwatch league has attracted high profile investors including the owner of the New England Patriots Robert Kraft, which solidifies the company’s ambitions to create a professional eSports league that rivals’ sports leagues such as the NFL, which will generate increasing profit in years to come.
  • 8. Spring 2019 Electronic Gaming and Entertainment Page 8 PEER GROUP ANALYSIS Electronic Arts Inc. (EA US): Electronic Arts Inc. develops, publishes, and distributes digital interactive entertainment worldwide. EA has over 300 million users around the world, across systems such as internet-connected consoles, PCs, and mobile devices. Electronic Arts is headquartered in Redwood City, California, and does business across the world, led by consumers in the United States, Canada, and Japan. The rest of the world uses EA Swiss Sarl, which is a sub department of Electronic Arts that processes payments for the rest of the world not listed above. Electronic Arts has leading games that are both licensed and its own. The licensed games are Madden, FIFA, and Star Wars, while its own are Battlefield, Mass Effect, and The Sims. Electronic Arts has segments, which include digital, packaged games, and live services. FIFA is the top selling game and it brings in about 11.0% of the company’s total revenue. In FY’18, EA reported net revenue of $5.15B. Take-Two Interactive Software Inc. (TTWO US) Take-Two Interactive Software, Inc. develops, markets, distributes, and publishes interactive software games and accessories, for consoles, handheld gaming systems, and PCs. Take-Two products are sold through physical retail, digital services, and cloud streaming services. About half of Take-Two’s products are sold in the United States, and GameStop alone accounts for 20.0% of sales. Take-Two has noticeable subsidiary company’s such as Rockstar Games and 2K Games, which sell games such as Grand Theft Auto and NBA 2K respectively. Take- Two has a wide reach across the globe, with 14 studios around the world. Take-Two maintains sales in a multitude of countries around the globe but has had limited success in Asia/Pacific with the region bringing in less than 10.0% of sales. Take-Two thrives in console game sales, which resulted in about 83.0% of its revenue, with the rest coming from games from PCs and other gaming devices. Take-Two Interactive Software Inc. had $2.0B in FY’18 revenue, which increased from $1.9B in FY’17. Nintendo Co., LTD (7974 JP): Nintendo Co., LTD. Globally develops, manufactures, and sells video game hardware and software products for in home entertainment, as well as home-game products such as cards. Nintendo sells the leading video game console, the Nintendo Wii, as well as leading handheld devices in the Nintendo DS, which began in 2004. Nintendo has introduced a no-glasses 3-D version of its handheld device, the Nintendo 3DS which launched in 2011, as well as a follow up version of the Wii, the Wii U, which allows the players to use a controller with a touch screen, in order to enhance game play. Nintendo is a Japanese company, headquartered in Kyoto, Japan. Although Nintendo is headquartered in Japan, it has a strong presence around the world which has resulted in $1.06B in revenue.
  • 9. Spring 2019 Electronic Gaming and Entertainment Page 9 COMPS TABLE ANALYSIS ATVI MOATS RISKS TO INVESTMENT THESIS Sales Concentration in Popular Games: The concentration of retail revenues among key titles has continued as a trend in the overall interactive entertainment industry. The top 10 titles accounted for 38.0% of sales in the U.S in 2018. Most Activision’s revenues are derived from video games based on popular franchises and these video games have been responsible for high percentage of profits. Diversified Geographic Presence: Activision has an established presence in multiple markets worldwide. The company has 500mm active monthly users in 196 countries. The company's presence across diverse geographies shields it against risks associated with adverse economic trends in a single region. it also provides it exposure to a large addressable market enhancing revenue. Piracy Threats: ATVI faces a threat of its products to experience piracy and unauthorized copying, and inadequate intellectual property laws could help prevent the company from enforcing the technologies. The process of registering and protecting ATVI’s copyrights, patents, and trademarks is expensive while laws to protect its rights are not as strict globally as they are in the United States. Third-Party Platforms: ATVI is highly reliant on its third-party platform providers and distributors such as Sony and Nintendo, ATVI’s revenues depend primarily on the sales of their third-party’s consoles. The company must be able to predict the success of consoles in the marketplace and be able to support the console’s systems with product development. Market Valuation LTM Financial Statistics LTM Profitability Margins EV Multiples Price Multiples Net Equity Enterprise Sales Net EBITDA EBIT Income EV / NTM EV / EV / NTM NTM Company Ticker Value Value Sales Growth (%) EBITDA Income (%) (%) (%) EBITDA EBITDA Sales P/E P/E P/S Activision Blizzard Inc. ATVI 36,560 34,530 7,500 6.9% 3,000 1,770 44.9% 29.2% 24.4% 14.7x 12.4x 5.4x 21.7x 18.4x 4.8x Nintendo Co LTD 7974 39,100 30,300 10,830 115.8% 2,000 2,340 26.5% 26.1% 17.2% - 9.2x 2.8x 21.0x 15.9x 3.6x Electronic Arts inc. EA 29,850 26,380 5,290 6.3% 1,730 1,310 21.4% 18.8% 20.8% 15.8x 15.3x 5.5x 26.1x 23.1x 6.1x Take-Two Interactive Softwre TTWO 10,790 9,110 2,580 0.7% 479 564 16.6% 4.2% 14.5% 15.3x 13.0x 3.1x 21.0x 19.3x 3.9x Mean 29,075 25,080 6,550 32.4% 1,802 1,496 27.4% 19.6% 19.2% 15.3x 12.5x 4.2x 22.5x 19.2x 4.6x Median 33,205 28,340 6,395 6.6% 1,865 1,540 24.0% 22.5% 19.0% 15.3x 12.7x 4.3x 21.4x 18.9x 4.4x High 39,100 34,530 10,830 115.8% 3,000 2,340 44.9% 29.2% 24.4% 15.8x 15.3x 5.5x 26.1x 23.1x 6.1x Low 10,790 9,110 2,580 0.7% 479 564 16.6% 4.2% 14.5% 14.7x 9.2x 2.8x 21.0x 15.9x 3.6x General LTM Return on Investment LTM Leverage Ratios Coverage Ratios Credit Ratings Dividend Tot. Debt / Tot. Debt / Tot. Debt / EBITDA / (EBITDA EBIT / ROIC ROE ROA Yield Cap EBITDA Equity Int. Exp. -Cpx)/Int. Int. Exp. Company Ticker Tax Rate Beta (%) (%) (%) (%) (%) (x) (%) (x) (x) (x) WACC Moody's S&P Activision Blizzard Inc. ATVI 13.1% 1.87 13.7% 13.7% 9.9% 0.7% 19.0% 0.9x 23.5% 51.4x 49.8x 33.1x 7.9% Baa1 BBB+ Nintendo Co LTD 7974 29.9% 1.00 - 12.5% 9.6% 2.1% - - - - - - 10.5% N/A N/A Electronic Arts inc. EA 28.1% 1.67 23.9% 30.1% 16.2% - 17.8% 0.6x 21.6% 25.8x 23.9x 22.0x 7.9% Baa1 BBB+ Take-Two Interactive Softwre TTWO - 1.64 19.8% 21.5% 9.1% - 0.5% - 0.5% - - - 8.7% N/A N/A Mean 23.7% 1.55 19.1% 19.5% 11.2% 1.4% 12.4% 0.8x 15.2% 38.6x 36.9x 27.6x 8.8% - - Median 28.1% 1.66 19.8% 17.6% 9.8% 1.4% 17.8% 0.8x 21.6% 38.6x 36.9x 27.6x 8.3% - - High 29.9% 1.87 23.9% 30.1% 16.2% 2.1% 19.0% 0.9x 23.5% 51.4x 49.8x 33.1x 10.5% - - Low 13.1% 1.00 13.7% 12.5% 9.1% 0.7% 0.5% 0.6x 0.5% 25.8x 23.9x 22.0x 7.9% - -
  • 10. Spring 2019 Electronic Gaming and Entertainment Page 10 Valuation Multiple Sensitivity Analysis (Returns of 15%-30% in Green) Price Calculation: Average NTM P/E Multiple 17.96x 18.96x 19.96x 20.96x 21.96x $1.77 $31.79 $33.56 $35.33 $37.10 $38.87 $2.02 $36.28 $38.30 $40.32 $42.34 $44.36 $2.27 $40.77 $43.04 $45.31 $47.58 $49.85 $2.52 $45.26 $47.78 $50.30 $52.82 $55.34 $2.77 $49.75 $52.52 $55.29 $58.06 $60.83 20.00x 21.00x 19.96x 23.00x 24.00x $1.77 (29.5%) (25.5%) (21.6%) (17.7%) (13.7%) $2.02 (19.5%) (15.0%) (10.5%) (6.0%) (1.6%) $2.27 (9.5%) (4.5%) 0.6% 5.6% 10.6% $2.52 0.4% 6.0% 11.6% 17.2% 22.8% $2.77 10.4% 16.6% 22.7% 28.8% 35.0% P/E Valuation LTM Multiple P/E Valuation LTM Multiple Returns 17.96x 18.96x 19.96x 20.96x 21.96x $2.20 $39.51 $41.71 $43.91 $46.11 $48.31 $2.45 $44.00 $46.45 $48.90 $51.35 $53.80 $2.70 $48.49 $51.19 $53.89 $56.59 $59.29 $2.95 $52.98 $55.93 $58.88 $61.83 $64.78 $3.20 $57.47 $60.67 $63.87 $67.07 $70.27 16.00x 17.00x 19.96x 19.00x 20.00x $2.20 (12.3%) (7.4%) (2.5%) 2.3% 7.2% $2.45 (2.3%) 3.1% 8.5% 14.0% 19.4% $2.70 7.6% 13.6% 19.6% 25.6% 31.6% $2.95 17.6% 24.1% 30.7% 37.2% 43.8% $3.20 27.5% 34.6% 41.7% 48.9% 56.0% P/E Valuation NTM Multiple P/E Valuation NTM Multiple Returns = ` NTM EPS $2.70 Target Price $54.00NTM P/E 20.0x = ` % Upside ~20%
  • 11. Spring 2019 Electronic Gaming and Entertainment Page 11 FINANCIAL ANALYSIS Revenue: • Activision Blizzard total revenue began to decrease Casual players abandoned the developer's Candy Crush Saga and other supporting titles. But King Digital's revenue appreciated 28.0% from 2016 to 2018 because highly engaged players stayed with its games and per-user spending increased. • Revenues from digital online channels increased 6.0% to $5.8B, or 77.0% of net revenues, as compared to $5.5B, or 78.0% of net revenues in 2017. In 2018, consolidated net revenues increased 7.0% to $7.5B and operating income increased 52.0% to $2.0B as compared to net revenues of $7.0B and operating income of $1.3B YoY. • The concentration of retail revenues among key titles has continued. For example, the CoD, Candy Crush, and World of Warcraft franchises, collectively, accounted for 58.0% of consolidated net revenues—and a significantly higher percentage of our operating income—for 2018. Monthly Active Users (MAU): • MAU is a metric that delineates the amount of individuals over a period of a month who have interacted with a specific game. Average MAU is calculated by summing MAU in each month for a selected interval and then dividing that aggregate sum by the amount of months in the interval. • Compared to 3Q’18, 4Q’18 average MAU rose 11mm or 3.0%. This surge is attributed to a 15.2% increase in Activision’s average MAU from the release of Call of Duty: Black Ops 4 in October 2018 and a 2.3% rise in King’s average MAU due to the release of Candy Crush Friends Saga in October 2018. • Average MAU in 4Q’18 saw a 29mm or 8.0% drop YoY. This plummet in average MAU is attributed to a 7.6% decline in King’s average MAU as a result of less engagement from users and a network outage. This outage occurred in 2Q’18 and affected players accessing King’s games and in-game transactions. Additionally, a 12.5% fall in Blizzard’s average MAU occurred because of low MAU reported from Hearthstone and Overwatch. Margins: • The annual gross margin is likely to consistently widen through 2021, reflecting benefits from the shift to digital and the purchase of King. Gross margin improved over the last couple of years as well. • 4Q’18 gross margin expanded 270 bps year over year to 71.0%, from 68.3% in 4Q’17, which is attributable to the ongoing digital shift, particularly with Call of Duty: Black Ops 4 skewing more digital than prior iterations (40.0% digital download vs. 30.0% last year). Gross margin came in 140 bps ahead of analysts’ 69.6% expectation.
  • 12. Spring 2019 Electronic Gaming and Entertainment Page 12 FINANCIAL ANALYSIS Earnings: • ATVI is well positioned to deliver significant outperformance in 2019 and outsized growth in 2020. A flattish performance for Call of Duty units, King outperformance, and mobile strength could drive FY’19 EPS closer to $2.40, well above guidance of $2.10, before considering Call of Duty on mobile in China and a new Call of Duty eSports league. A $2.70 EPS figure in 2020 is possible from multiple game releases that would launch following the company’s “Transition year”. • Significant growth for Call of Duty: Mobile and/or Diablo Immortal in the West, a new World of Warcraft expansion, a frontline Blizzard release, substantial King growth, and Call of Duty Blackout and/or Overwatch going free-to-play. • From FY’16-FY’19, the company maintained an average EPS surprise rate of +14.3% with a 4-year CAGR of ~11.0%. ATVI reported 4Q’18 EPS of $1.29, beating street $1.23 estimates as well as the company’s guidance of $1.27. ATVI reported $0.94 in 4Q’17. Despite +37.0% EPS growth in 4Q’18 and +14.0% for 2018, and exceeding both 4Q and full-year guidance, the company is driven to beat its FY’19 guidance of $2.20, which we predict will exceed $2.25. • ATVI managed to beat earnings per share estimates 8 of 8 times with a 5-year growth of 14.6% and we believe the company will maintain this record. Free Cash Flow / Capital Expenditure : • In FY’18, cash flows from operating activities were approximately $1.79B, a decrease of 19.0%, as compared to $2.21B in 2017, however Activision Blizzard Cash Flow from Operations for the quarter ending December 12, 2018 was $999mm, a 47.1% increase of $470mm YoY, showing significant outperformance at the end of the year. • Due to slower growth in the past fiscal year, ATVI’s FCF margin of 22.8% dipped slightly below the Technology index of 23.2%. However, as the current developments in live-services roll out, the company’s FCF margin is expected to rise to 28.3% in FY’20, above the Index’s forward average of 23.7%. • Although sales may decline 12.0% this year, the company can still generate $1.8B or more on free cash flow, giving it flexibility to invest in new titles, platforms and geographic expansion. Activision will utilize its cash flow this year to provide higher-quality games with more consistent updates. Additionally, the company plans to emphasize greater clarity on promising new titles in 2020, which will reassure investors that ATVI can remain a leader in its industry despite temporary slowdowns. • Mobile Expansion of Call of Duty and other key franchises will contribute to generating free cash flow beyond $2.04B in 2020. • Capex is expected to increase from $29.7mm in 1Q’19 to $32.6mm in 4Q’19, right before dropping to $24.1mm in 1Q’20. Capex dropped to ~$131mm in 2018, as compared to ~$155mm in 2017. In 2019, total capital expenditures of approximately ~$125mm will be made, primarily for leasehold improvements, computer hardware, and software purchases.
  • 13. Spring 2019 Electronic Gaming and Entertainment Page 13 FINANCIAL ANALYSIS Net Booking: • Net bookings is equal to the net amount of physical or digital goods and services sold in the selected period. This amount encompasses merchandise, license fees, and publisher incentives. • Increased due to high net bookings reported from the in- game events and features for the Candy Crush franchise and the release of Destiny 2, Call of Duty:WWII, and Crash Bandicoot N. Sane Trilogy. • This net booking increase was slightly counteracted by lower net bookings reported from Call of Duty: Infinite Warfare and Overwatch. Additionally, no new release from World of Warcraft and Skylanders in 2017 compared to 2016 when they announced World of Warcraft: Legion and Skylanders Imaginators, respectively, resulted in lower net bookings. • In FY’17-FY’18, Net booking increased by $106mm from $7.2B to $7.26B due to high net bookings reported from the release of World of Warcraft: Battle for Azeroth and Spyro Reignited Trilogy. Moreover, the increase in both in-game advertisements and monetization, and the release of Candy Crush Friends Saga raised net bookings. • This net booking increase was slightly counteracted by lower net bookings reported by Call of Duty: Infinite Warfare and Overwatch. No new release by the Destiny franchise after Destiny 2 also lowered net bookings in 2018. Debt: • On August 24, 2018, ATVI made a voluntary prepayment of $990mm to fully payoff and extinguish its 2017 team loan A by using available cash on hand. • As of FY’18, ATVI had a long-term gross debt of $2.7B, which decreased from $4.4B in FY’17. • There has been a decrease of 30.1% in debt-to-equity ratio from FY’16 to FY’18. The debt-to-equity ratio for FY’18 is currently 23.5%, while in FY’17 it was 46.4% and in FY’16 ATVI had a ratio of 53.6%. This decrease shows that ATVI is considered an above-average leverage company. • ATVI has a high cash coverage, meaning that even though the company may have high debt levels, it is able to use its borrowings systematically to generate cash flow. • The ratio of EBITDA to Net Interest in FY’18 is 22.3%, which has increased from 16.7% in FY’17 and 13.0% in FY’16. This is beneficial to the company due to making it a safe investment as they are able to pay off their interest. • Moody’s: Baa1: S&P: BBB+
  • 14. Spring 2019 Electronic Gaming and Entertainment Page 14 MANAGEMENT Robert A. Kotick, CEO of Activision Blizzard Robert A. Kotick has been a director of Activision Blizzard since February 1991, following his purchase of significant interest in the Company, which was then on the verge of insolvency, and serves as our Chief Executive Officer. Mr. Kotick was our Chairman and Chief Executive Officer from February 1991 until July 2008, when he became our President and Chief Executive Officer. He served as our President from July 2008 until June 2017, when Mr. Johnson began serving as our President and Chief Operating Officer. Mr. Kotick is also a member of the board of directors of The Coca-Cola Company, a multinational beverage corporation, and the boards of trustees for The Center for Early Education and Harvard-Westlake School. Collister Johnson, Presiden, and COO of Activision Blizzard Collister Johnson has served as our President and Chief Operating Officer since June 2017. From April 2016 until May 2017, he served as the chief operating officer and co-founder of Altschool, a public benefit, education technology company, where he continues to serve on the board of directors. Prior to joining Altschool, he held a number of positions of increasing responsibility at our Company from 2008 to 2016, serving as the chief financial officer and head of operations of Activision, one of our principal operating units, chief operating officer of studios for Activision, and senior vice president and chief of staff to our Chief Executive Officer. Mr. Johnson holds a B.A. degree in ethics, politics, and economics from Yale University and an M.B.A. degree from Stanford University. Dennis Durkin, CFO of Activision Blizzard and President of Emerging Brands Dennis Durkin has served as our Chief Financial Officer and President of Emerging Businesses since January 2019. Mr. Durkin joined the Company in March 2012 as our Chief Financial Officer and served in that role until May 2017. He served as our Chief Corporate Officer from 2017 until 2019. Prior to joining the Company in 2012, Mr. Durkin held several positions of increasing responsibility at Microsoft, a computing software and hardware manufacturer, most recently serving as the corporate vice president and chief operating and financial officer of Microsoft's interactive entertainment business, which included the Xbox console business. Before joining Microsoft, Mr. Durkin was a financial analyst at Alex. Brown and Company. Mr. Durkin holds an M.B.A. degree from Harvard University.
  • 15. Spring 2019 Electronic Gaming and Entertainment Page 15 APPENDIX ACTIVISION BLIZZARD VALUATION TABLE - ATVI $mm except per share General assumptions Ticker ATVI Share price as of last close $45.06 Dividend Yield 0.78% Latest closing share price date 4/15/2019 Latest diluted share count 764 P/E Valuation LTM EPS Results NTM EPS Estimates Period 1 EPS $0.65 $0.35 Period 2 EPS $0.49 $0.49 Period 3 EPS $0.38 $0.67 Period 4 EPS $0.75 $1.19 LTM / NTM EPS $2.27 $2.70 Current P/E Multiple 17.60x 17.60x Target P/E multiple 19.96x 19.96x Target Price $45.31 $53.89 Equity Return 0.55% 19.60% Total Return 1.33% 20.38% EV/EBITDA Valuation LTM EBITDA Results NTM EBITDA Estimates Period 1 EBITDA $900 $632 Period 2 EBITDA $602 $473 Period 3 EBITDA $415 $444 Period 4 EBITDA $1,079 $1,314 LTM / NTM EBITDA $2,996 $2,863 Current EBITDA Multiple 11.19x 11.19x Target EBITDA Multiple 13.91x 13.91x Enterprise Value $41,674 $39,824 Total Debt $2,671 $2,671 Cash $4,225 $4,225 Equity Value $43,228 $41,378 Diluted Shares Outstanding 764 764 Share Price $56.58 $54.16 Equity Return 25.57% 20.20% Total Return 26.35% 20.98%
  • 16. Spring 2019 Electronic Gaming and Entertainment Page 16 Exhibit 1: Activision segments and games
  • 17. Spring 2019 Electronic Gaming and Entertainment Page 17 Exhibit 2: Activision revenue by game
  • 18. Spring 2019 Electronic Gaming and Entertainment Page 18 Exhibit 3: Activision geographic map and 2017 statistics
  • 19. Spring 2019 Electronic Gaming and Entertainment Page 19 Exhibit 4: Activision comps analysis and top brands
  • 20. Spring 2019 Electronic Gaming and Entertainment Page 20 Exhibit 5: 2018 Global Games Market
  • 21. Spring 2019 Electronic Gaming and Entertainment Page 21 DISCLAIMER This report is prepared strictly for educational purposes and should not be used as an actual investment guide. The forward-looking statements contained herein are simply the author’s opinions. The writer does not own any Activision Blizzard, Inc. (ATVI) stock. TUIA STATEMENT Established in honor of Professor William C. Dunkelberg, former Dean of the Fox School of Business, for his tireless dedication to educating students in “real-world” principles of economics and business, the William C. Dunkelberg (WCD) Owl Fund will ensure that future generations of students have exposure to a challenging, practical learning experience. Managed by Fox School of Business graduate and undergraduate students with oversight from its Board of Directors, the WCD Owl Fund’s goals are threefold: • Provide students with hands-on investment management experience • Enable students to work in a team-based setting in consultation with investment professionals. • Connect student participants with nationally recognized money managers and financial institutions Earnings from the fund will be reinvested net of fund expenses, which are primarily trading and auditing costs and partial scholarships for student participants.