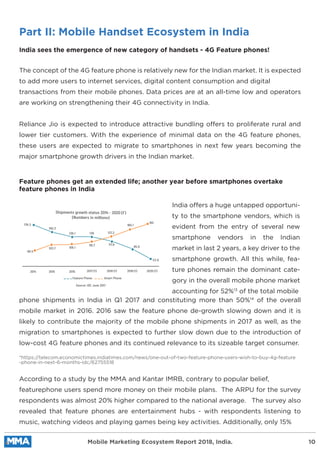
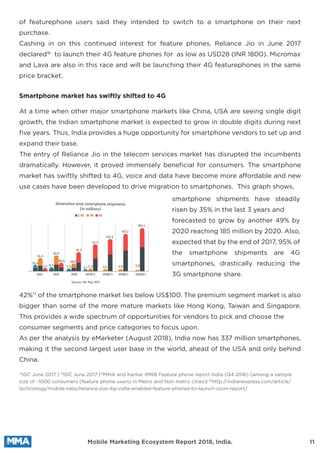
SlideShare a Scribd company logo
1 of 64
Download to read offline
MOBILE MARKETING
ECOSYSTEM REPORT
2018, INDIA
Foreword
Since the last time we saw you there have been dramatic shifts in multiple areas.
Demonetization in India saw massive uptake on digitization of payments, and Trump took
over the presidency in the US. In the same period, Reliance Jio changed the
Telecom ecosystem in India by adding 200+ million new mobile subscribers, shaping it’s
vision of “Internet for Every Indian”.
We also saw 4G in India becoming mainstream, on both network and smartphone tech
adoption, it completely dominated the market. 4G featurephone is an innovation
that will take the India market by storm and will stay for long.
Lower data cost caused massive growth in data consumption via mobile devices.
Gaming, OTT Video and Digital Audio platforms became the flag bearers of increasing
data traffic. India saw the launch of seven big OTT platforms in the last 2 years (namely
Netflix, Amazon Prime, Hotstar, Voot, Zee5, Sony Liv and Wynk). With the growing OTT
consumption and the need of vernacular content, we think in the next 5 years’
vernacular content users will grow 12X compared to 2X growth for English content
consumers.
Gaming is another category showing growth in India, as it caters to not only to
seasoned gamers, but also casual gamers like kids on their parents phones. Also,
by introducing relevant native ad formats like reward videos, gaming has become a top
contender for marketers to spend on.
In 2017, 70% of India’s digital advertising budget was spent on mobile, wherein
traditional FMCG and BFSI brands also saw uptake in something as advanced as
programmatic spend. In this report we give all marketers a quick peak on a basic guide
on how programmatic works and its pros and cons, and its future evolution. With the
second edition of the report, we bring you up-to date on the latest trends in data growth,
content play, programmatic, device status; how India is moving towards a new era of
mobile marketing, seeing rampant growth in both usage and spends. We hope you like
our? efforts and do share your feedback on what you want in the next report.
Happy Reading!
Table of Content
1: Key Trends and Insights Page 01
2: Part I: Reach of Mobile among Consumers in India Page 03
3: Part II: Mobile Handset Ecosystem in India Page 10
4: Part III: Basics of Programmatic Advertising Page 15
5. Part IV: Key Verticals driving the Mobile Advertising Page 23
a) Gaming Page 23
b) Vernacular Page 27
c) OTT Video Page 32
d) OTT Audio Page 43
6: Part V: Mobile Ad Spends in India Page 46
7: Appendix Page 48
8: MOSTT - Marketing Organization Structire Think Tank Page 51
9: SAVE Page 53
10: How Mobile Marketing Can Boost Brand Engagement Page 56
11: Smarties India 2018 Winners Page 59
12: MMA India Board Page 60
13: Objective & Methodology of Research Page 61
Acknowledgement (About Researchers and Contributors) Page 62
Disclaimer
Key Trends and Insights
The Jio Brigade!
Since its launch in August 2016, Jio added 200+ million users, representing 18% of the
mobile subscribers market in India. Jio helped establish 4G in India making it affordable
for people of all financial backgrounds. Competitive telecom brands had to decrease
their data costs by 40% so that their current customers don’t opt for/get a MNP (Mobile
Number Portability) to Jio. Being the first 4G network in India, Jio now holds 40% of the
broadband traffic in India and it will keep on growing exponentially.
4G now holds approximately 82% of the data payload in the country!
As 2G users decrease with every passing month, 3G and 4G will lead the mobile internet
path till 2019 before we see the launch of 5G. Since the launch of 4G in late 2015, the total
data payload grew 7.5x and 2.4x in 2016 and 2017 respectively.
The 4G monthly data consumption is 3.8x greater than 3G data usage. 4G will lead the
growth curve, although 3G will also continue to grow in the years to come.
Compared to Urban India, Rural India is bringing three times more people online!
India added 67 million mobile internet users in 2017,out of which 44 million were from
Rural India. Rural India’s mobile internet users saw a 19% YoY growth, almost triple the 6%
YOY growth Urban India. India will cross 500 million mobile internet users by the end of
2018, we foresee that this growth will be led by the rural populace.
OTT platforms majorly engulf data traffic!
OTT audio and video combined reach more than 200 million users in India. Video takes
the largest share of the pie of content consumed on mobile internet, projecting a growth
from 49% in 2016 to 75% in 2021. OTT players are creating original content and also
including international content, which is helping them gain newer audiences and increase
view time. Additionally, Indian YouTubers are creating great content that has also
increased video viewing in India. Growing time spent on these platforms has also led to
more advertising inventory. This also makes ads on video platforms more
receptive due to its good content value. The OTT market will keep on growing as good
content and good vernacular content is created for audiences from all regions.
Mobile Marketing Ecosystem Report 2018, India. 01
Mobile Gaming - the next big thing for Indian marketers!
Why gaming you ask? Because 84% of mobile subscribers have games on their devices.
Mobile gaming in India is high due to freemium games and free access and the segment
will continue growing at the rate of CAGR 87% till 2020. Interestingly, this boom occurred
with the help of female gamers who spent 70 mins a day playing games on their mobile
devices. 34% of Indian mobile gamers make in-app purchases, mostly paved by card and
strategy games. For marketers gaming is a platform which helps in reaching a varied
audience, that aren’t accessible anywhere else.
In the next 5 years Chat Application, Government Sites and Digital Payments will lead
to more vernacular content consumers online!
The Indian language internet users have grown from 42 million in 2011 to 234 million in
2016, a 4x growth, almost double from the 2x growth seen in the English language
internet users. This has happened due to major online platforms like e-commerce and
social media platforms launching their content in vernacular languages, reaching out to a
much bigger and diverse Indian audience. It is anticipated that vernacular language users
will increase 12 folds by 2021 and this will only be possible if OEMs create keyboards that
are available in all languages, as currently 70% of vernacular content consumers find it
tough to work with an English keyboard on their mobile device.
The average monthly mobile spends reduce!
The 4G data surge led people to use more data than voice. Furthermore, lower data
package costs helped reduce mobile spends. This led to a 21% drop in ARPU (Average
Revenue per User). We think in the coming years as more and more people use data to
make calls, voice spends will decrease as will the average mobile spends.
Featurephones are here to stay!
Contradicting all predictions, featurephone* shipments remained higher than smart-
phone shipments and they are equally an urban phenomenon as they are a rural one.
With featurephones equipped with better quality cameras, more RAM and storage space
at half the price of the smartphone, people prefer investing in them instead of a
smartphone. Soon Jio and Micromax will be launching a 4G featurephone that will cost
less than 2k. With these updates, featurephones are here to stay for the long term.
*The definition of featurephone is given in detail in the appendix
Mobile Marketing Ecosystem Report 2018, India. 02
Part I: Reach of Mobile among consumers in India
India ahead of China and expected to add over 200 Mn new subscribers by 2020
20%1
of the total mobile subscribers globally now reside in India. By 2020, 27% of new
subscribers added globally will be from India - making India the largest contributor
globally to the mobile economy, placing India significantly ahead of other emerging
economies such as Indonesia and Brazil, who contribute to less than 5% of new
subscriber growth.
Since the advent of Reliance Jio, India had added over 3 times2
more subscribers
compared to its subscriber growth since 2014. Subscriber growth came from both urban
and rural markets - with 53 million rural and 79 million urban new mobile
subscribers added during the period.
and also onboarded new mobile subscribers and turned many existing subscribers into
dual SIM users.
In the last 2 years there is minimal
decrease in the top three Telecom
players in India. With the incoming of
Jio, the top three Telecom players
rarely saw major impact (downturn)
on their numbers. Jio took it’s share
from the parent company Reliance
Reliance Jio gained a whopping
18% market share within 6 months of
launch; the Top 3 telcos continued to
grow too
Mobile Marketing Ecosystem Report 2018, India. 03
Access service provider-wise market shares in term of wireless subscribers
Bharti Airtel
30.5%
Vodafone
19.7%
Idea
18.9%
Reliance Jio
18.2%
BSNL
10.0%
TATA
2.4%
Mobile Subscribers in India ( in Millions)
Rural
944
551
392
562
418
980
579
432
1013
588
447
1035
662
465
1127
680
506
1186
668
499
1167
629
506
1131
Urban
Total
Dec 2014 Dec 2015June 2015 June 2016 Dec 2016 June 2017 Dec 2017 May 2018
Global markets by additional subcribers, 2016 -2020
Percentage of new subscribers globally
(Million)
India China Brazil Nigeria Indonesia USA Pakistan Mexico Bangladesh Ethopia
27%
206
155
35 27 23 18 18 16 16
10
21% 5% 4% 3% 2% 2% 2% 2% 1%
1
GSMA report 2017 I 2
TRAI June 2018
As anticipated, the Jio launch
significantly changed the dynamics of
the mobile consumer in India and made
data ubiquitous, specifically proliferat-
ing the rapid adoption of 4G data
subscriptions.
Since its inception in August 2016 Jio
has added almost 200 million3
mobile
Worldwide mobile internet users grew
by 9.2%5
in 2017, while India grew at over
double the rate at 22%. The pace of
growth in mobile internet users puts
India ahead of the other two major
economies, China and the US, which
saw a growth rate of 5.4% and 6.2%
respectively. India’s growing millennial
population and it being a developing
country are the main reasons behind
the mobile growth. This also creates
many opportunities for Indian market-
ers to explore mobile as a digital
medium more extensively.
There has been a rapid growth in the
subscribers and all subscribers are data users, using an average of 1GB2
data every month.
Jio users have been said to consume 100 Crore GB4
of data per month which is 50% more
than China and almost equal to the mobile data consumed by the entire US.
India continues to be the fastest growing mobile internet economy in the world
number of mobile internet users, in the past 2 years. We have added almost 1506
million new mobile internet users (2015-2017) and expect it to increase significantly in
2018. By the mid of 2018 it is estimated that India will reach nearly half a billion mobile
internet users.
3
TRAI Jan 2016/Jan 2017 | 4
http://telecom.economictimes.india-
times.com/news/thanks-to-reliance-jio-india-becomes-top-mobile-data-user/57269548 | 5
eMarketer Estimates/IAMAI
& Kantar IMRB Mobile Internet Report 2016 |6
IAMAI & Kantar IMRB Mobile Internet Report 2016
Mobile Marketing Ecosystem Report 2018, India. 04
June 2015 Dec 2015 June 2016 Dec 2016 June 2017 Dec 2017 May 2018
Telco wise subscribers ( in Millions)
230
162
172 176
190
196 196
214
205
160
123
81
33 0.18
72
99101109
185 193 199 204 212 212 222
243 255
Worldwide APAC
2016 2017 (E) 2018 (E)
China India US
Mobile Internet Users ( in Millions)
URBAN VS RURAL MOBILE SUBSCRIBERS (IN MILLION)
265
280
290
308
2500
2730
3059
1348
1476
1740
604 637 728
373 456 478
210 223 232
2016 2017 June 2018 (E)2015
306
373
458 478
Total Urban Rural
219 226
280 291
87
147
176 187
Mobile Marketing Ecosystem Report 2018, India. 05
The rise of several international and
local OTT players in the video and
music category (e.g. Netflix, Gaana,
Wynk, Hotstar, Voot, Amazon Prime
etc.) in 2016 gave an impetus for
driving data consumption in the
category, along with rapid drop in data
tariffs for consumers. Urban India data
spent on entertainment grew 58%7
YoY.
Networking and Communication continue to be a key category among mobile internet
users; Facebook user base increased by 22% YoY. Facebook in Q4 2016 saw double the
growth compared to the same period in 2015. David Wehner, CFO, Facebook in an
interview said the reason for this change was India giving free internet to their users
(by the new entrant Jio).
Comparing 2016 to 2017, 5 Telco circles showed almost double growth in Facebook user
penetration10: Delhi (2016 – 19% vs 2017 – 35%), Bihar (2016 – 5% to 2017 – 11%), Kolkata
(2016 – 25% vs 2017 – 45%), Maharashtra (2016 – 16% vs 2017 – 32%) and Assam
(2016 – 13% vs 2017 – 22%).
61%6
of mobile internet users in India are still from urban India, compared to 39% of users
from rural India. However, of the new users being added there has been a significant
growth from rural users, adding 100 million mobile internet users since 2015, a CAGR
(Compound Annual Growth Rate) of 29% .
Growth in mobile internet subscribers, specifically urban India, brings data usage
growth to newer areas beyond communication and social networking
7
IAMAI and Kantar IMRB Mobile Internet Report 2017 | 8
Facebook Ad Manager | 9
http://telecom.economictimes.
indiatimes.com/news/reliance-jios-free-data-makes-big-contribution-to-facebook-revenue-growth-in-q4/56931784 |
10MMA and GroupM Mobile Ecosystem Report India 2016 / Facebook Ad Manager
Purpose of Internet Access Urban vs Rural ( 2016 vs 2017)
2016 2017 2016 2017
Urban Rural
69% 68%
52%
85%
72%
82%
38% 34%
31%
60%
49%
58%
Communication Social Networking Entertainment
Source: Facebook Ad Manager (data as per June 2017)
The Indian telecom market witnessed
a paradigm shift in data consumption,
with 4G traffic capturing 82% share of
total data traffic in December 2017.
3G+4G contributed to 98%11
of the
total data payload in 20176
with a
150% YOY increase. Since, the 4G
launch in end of 2015, the 4G payload has grown 7.5x and 2.4x in 2016 and 2017
respectively.
4G data usage grew 144% in 2017!
Mobile Marketing Ecosystem Report 2018, India. 06
Pan-India mobile data usage - in petabytes PB per month, December’
2400
1900
900
300
200
100
0
Dec-13 Dec-14 Dec-15 Dec-16 Dec-17
3240
103
398823
2.4x
7.5x
Payload 2G
Payload 3G
Payload 4G
Total Payload
966
2,360
1,930
Y-o-Y Growth*
144%
135%
286%
-20%
128
82
47
44
85
49
28
21
46
35% of the total 4G subscribers (approximately 1 out of 3 4G subscribers) came from
rural territory.
Jio is credited with bringing 4G to India but Jio also should be credited for the ramping
up of the 4G network for incumbents like Airtel, Vodafone, and Idea. Consequently, while
Jio, being the 4G lead operator with 160 million subscribers (by end 2017), increased
122% (88 million) subscribers in the year 2017; incumbent mobile operators grew 457%
(64 million).
Falling data prices, bundled data
plans, better coverage footprint, off-
load of 4G on to 3G, and better
device availability have contributed
to growth of 3G payload.
44% of the mobile internet users in
India are 4G data users, out of which
Between 2016 and 2022, total mobile
data traffic is expected to grow CAGR
40%12
. By 2022, 97%12
of mobile data
will be consumed by smartphones.
Industry analysts predicted that 4G
consumption will reach 11GB/month
in 2022, however, this statistic was
reached in 2017.
11
Nokia MBIT Report 2016 | 12
Ericsson Mobility
Report – India, June 2017
Increase in 4G device penetration, aggressive 4G network rollout, lower data prices, and
development of video and locally relevant content creators have all contributed to the
rise of 4G traffic
80% are Jio users.
Exponential increase in data traffic is accompanied by a significant increase in data
consumption, with 4G usage reaching approx. 11GB/month
4G growth was led by Jio, but other Telcos benefitted as well!
Mobile Marketing Ecosystem Report 2018, India. 07
Data subscribers by technology in december 2017
182
134
96
2G 3G 4G
Average data usage/month (MB)
2G
3G
4G
11,048
10,604
2,970
2014 2015 2016 2017
216
680
220
753
849
259 320
3G-4G multiple
2017:3.6x
Further analysis points that Jio added 26% rural subscribers using 4G, incumbents added
53% of their 4G subscribers to the rural market. By the end of 2018, its estimated that
India will have 300 million 4G subscribers, of which 58 million will be using a 4G
featurephone and the remaining 81% of subscribers will be using 4G over a Smartphone.
Mobile Marketing Ecosystem Report 2018, India. 08
4G subscriber addition 2016 versus 2017
Urban versus Rural 4G subscriber addition 2017
Incumbents
Jio
Incumbents
Jio
4G subscriber Dec 2018: 238Mn
78Mn
160Mn
4.6x
1.2x
0% 10% 20% 30%
2016 2017
40% 50% 60% 70% 80% 90% 100%
0% 20% 40% 60%
Rural Urban
80% 100% 120% 140% 160% 180%
26% 74%
It is quite evident that average mobile
expenditure has been decreasing con-
tinuously from 2014. Previously in the
report we have learnt that this decrease
is due to increased affordability of
mobile data, which decreased from 2014
to 2016, with a marginal rise in 2017
owing to higher usage of mobile data.
Expenditure on Voice has been steadily
Since, last year we have seen a drastic
drop in ARPU across all age groups,
other than the <15 year group. The >45
year group , which was one of the most
prolific user of voice services last year
witnessed a significant drop. Much of
this drop can be attributed to changes
in mobile plans offered by service pro-
viders, which are more data centric with
very low costs for voice packages. Data
decreasing (at a CAGR of -32%) since 2013; and with the popularity of VOIP and video
chatting, the expenditure on voice services has decreased dramatically in recent times.
spend by the >45 year group has decreased given lower price of data packs and overall
usage saturation of the age group.
Older generation in India gets hooked to data usage, as voice ARPU decreases as
low as Rs.45 monthly!
11
Nokia MBIT Report 2016 |13
IAMAI and Kantar IMRB Mobile Internet Report 2016
Mobile Marketing Ecosystem Report 2018, India. 09
Average Mobile bill per month ( in INR)
275
349369
439
387
214
173
235 231 225
230
45
2017201620152014
Total Voice Data
2013
124129204
210
239 235
275
183
225
247
268
220
48
31
51 54 48
>45yrs35-44yrs25-34yrs15-24yrs<15yrs
2017
>45yrs35-44yrs25-34yrs15-24yrs<15yrs
2016
Data Voice Total
277
119
142
29
104
Mobile Bill: Agewise
166 195
314
358
377
552
231
256
298
322
268
India offers a huge untapped opportuni-
ty to the smartphone vendors, which is
evident from the entry of several new
smartphone vendors in the Indian
market in last 2 years, a key driver to the
smartphone growth. All this while, fea-
ture phones remain the dominant cate-
gory in the overall mobile phone market
accounting for 52%13
of the total mobile
The concept of the 4G feature phone is relatively new for the Indian market. It is expected
to add more users to internet services, digital content consumption and digital
transactions from their mobile phones. Data prices are at an all-time low and operators
are working on strengthening their 4G connectivity in India.
Reliance Jio is expected to introduce attractive bundling offers to proliferate rural and
lower tier customers. With the experience of minimal data on the 4G feature phones,
these users are expected to migrate to smartphones in next few years becoming the
major smartphone growth drivers in the Indian market.
phone shipments in India in Q1 2017 and constituting more than 50%14
of the overall
mobile market in 2016. 2016 saw the feature phone de-growth slowing down and it is
likely to contribute the majority of the mobile phone shipments in 2017 as well, as the
migration to smartphones is expected to further slow down due to the introduction of
low-cost 4G feature phones and its continued relevance to its sizeable target consumer.
According to a study by the MMA and Kantar IMRB, contrary to popular belief,
featurephone users spend more money on their mobile plans. The ARPU for the survey
respondents was almost 20% higher compared to the national average. The survey also
revealed that feature phones are entertainment hubs - with respondents listening to
music, watching videos and playing games being key activities. Additionally, only 15%
India sees the emergence of new category of handsets - 4G Feature phones!
Feature phones get an extended life; another year before smartphones overtake
feature phones in India
Part II: Mobile Handset Ecosystem in India
*https://telecom.economictimes.indiatimes.com/news/one-out-of-two-feature-phone-users-wish-to-buy-4g-feature
-phone-in-next-6-months-idc/62755518
Mobile Marketing Ecosystem Report 2018, India. 10
Shipments growth status 2014 - 2020 (F)
(Numbers in millions)
Source: IDC June 2017
53.8
85.9
117.9
136
185
160.1
137.2
116.7
109.1
2017 (f) 2018 (f) 2019 (f) 2020 (f)2015 20152014
Feature Phone Smart Phone
103.7
80.5
136.1
150.3
179.3
smartphone shipments have steadily
risen by 35% in the last 3 years and
forecasted to grow by another 49% by
2020 reaching 185 million by 2020. Also,
expected that by the end of 2017, 95% of
the smartphone shipments are 4G
smartphones, drastically reducing the
3G smartphone share.
of featurephone users said they intended to switch to a smartphone on their next
purchase.
Cashing in on this continued interest for feature phones, Reliance Jio in June 2017
declared16
to launch their 4G feature phones for as low as USD28 (INR 1800). Micromax
and Lava are also in this race and will be launching their 4G featurephones in the same
price bracket.
At a time when other major smartphone markets like China, USA are seeing single digit
growth, the Indian smartphone market is expected to grow in double digits during next
five years. Thus, India provides a huge opportunity for smartphone vendors to set up and
expand their base.
The entry of Reliance Jio in the telecom services market has disrupted the incumbents
dramatically. However, it proved immensely beneficial for consumers. The smartphone
market has swiftly shifted to 4G, voice and data have become more affordable and new
use cases have been developed to drive migration to smartphones. This graph shows,
42%17
of the smartphone market lies below US$100. The premium segment market is also
bigger than some of the more mature markets like Hong Kong, Taiwan and Singapore.
This provides a wide spectrum of opportunities for vendors to pick and choose the
consumer segments and price categories to focus upon.
As per the analysis by eMarketer (August 2018), India now has 337 million smartphones,
making it the second largest user base in the world, ahead of the USA and only behind
China.
Smartphone market has swiftly shifted to 4G
13
IDC June 2017 | 14
IDC June 2017 |15
MMA and Kantar IMRB Feature phone report India (Q4 2016) (among a sample
size of ~1000 consumers (feature phone users) in Metro and Non metro cities)| 16
http://indianexpress.com/article/
technology/mobile-tabs/reliance-jios-4g-volte-enabled-feature-phones-to-launch-soon-report/
Mobile Marketing Ecosystem Report 2018, India. 11
Generation wise smartphone shipments
(In millions)
Source: IDC May 2017
54.3
2014 2015 2016 2017(F) 2018(F) 2019(F) 2020(F)
63.9
30.5
3.7 9.3 2.3 0.1 5.3 3.5 2.9 2.6
28.6
78.3
2.5G 3G 4G
111.3
133.8
157.2
182.4
22.4
Q4 2017 saw many changes in-terms of
Handset shipments; it saw the maximum
growth compared to the same time in
the last 3 years. Additionally, Xiaomi
threw Samsung from the reigning
smartphone in India and became the
leader in shipments in Q4 2017. The
sales that were led by Xiaomi were
China based vendors like Xiaomi, Vivo, Oppo, Transsion now account for almost a 50%18
share of the smartphone market in India. They have been able to achieve this on the back
of their hi decibel ATL and clever BTL marketing spends, perceived better specifications
– price value, wide & deep retail level distribution and online exclusive models. India
based vendors were slow to react to the market shift to 4G Smartphones and combined
with intense competition from China based vendors, Indian brands faced challenges in
2016-17 in the smartphone market.
primarily replacements and upgrades where users shunned their existing Smartphones.
In Q1 201818
, Transsion made its debut in the top 5 handset manufacturers in India with
more than a three fold annual growth. The China based group has 4 brands under its
umbrella (namely - Itel, Tecno, Infinix and Spice). With its primary focus on offline chan-
nels, Itel and Tecno branded phones are doing well in the highly price sensitive India
market.
Xiaomi is changing the fabrication of the Indians smartphone industry
China based mobile phone vendors have successfully made inroads in the market via
both online and offline channels. LOVE (Lenovo. Oppo, Vivo, Xiaomi) v/s MILK (Micromax,
China based smartphones are growing as Indian manufacturers struggle
to become 4G first!
18
IDC May 2017 / IDC Q1 2018
Mobile Marketing Ecosystem Report 2018, India. 12
26%
25%
30%
7%
7%
5%
Handset brand manufacture’s market share in India (Q1 2018)
Xiaomi Samsung Oppo Vivo Trannssion Others
Intex, Lava, Karbonn)19
as popularly referenced for Chinese Vs Indian brands. Overall
LOVE brands have been mono-channel brands, offering great value for money with
aggressive marketing. The success in the transition to Omni-channel would be a key
factor for them to maintain their standing in the market with internal competition
intensifying. At the same time, what Oppo did a couple of years ago , has been recently
replicated by Vivo considerably and such marketing strategies have had a direct bearing
on the market standings. The biggest challenge for LOVE brands would be to sustain
such a campaign through all the quarters and at the same time, not enter each other's ’
territories resulting in internal competition. Initially affecting the Indian brands’ market
share, they now begin to enter into each other’s market share.
Quarter on quarter we are witnessing the MILK (Micromax-Intex-Lava-Karbonn) brands
not being able to leverage any of the anchors they enjoyed over the years. Be it
establishing themselves across the country or becoming the first choice for first time
mobile (Feature as well as Smart) users, the brands have not been able to support a
consumer’s journey. While they could not have matching marketing campaigns as their
Chinese counterparts and preferred to ‘wait’ till they (India) burnt their money, their grip
on the market became weak impacting their market standings. The success of itel and
Xiaomi brands, which are not aggressively marketing by spending crores, are case
studies for MILK brands to take cues from on how to manage visibility. It is high time for
MILK brands to strengthen their digital presence, not only from the selling perspective
but also from the angle of influencing youth, which directly or indirectly, are responsible
for two out of three Smartphone sales in India.
‘Make in India’ has provided the right impetus to the mobile manufacturing in the country.
Approximately, 65%19
of phones sold in India are assembled in India, in 2017, the share
would touch 90%. India is fast emerging as the new manufacturing hub for the Mobile
Phones and components with 40 brands already manufacturing in India, made possible
Mobile Marketing Ecosystem Report 2018, India. 13
Leading smartphone OEMs by price brand
Below 4K
Intex Technologies
4K - 8K
Samsung India Electronics
8K- 10K
Vivo Mobile India
15K- 20K
Samsung India Electronics
10K- 15K
Rising Star Mobile India
Above 20K
Hong Fu Jin Precision Electronics
01
02
03
04
05
06
by relatively lower labor costs, government push and incentives for local manufacturing
coupled with high differential duties on import . In the next few years, Indian vendors are
expected to start exporting devices to South-East Asia and African countries from their
manufacturing operations.
Android in the last 2 years has been
able to maintain its kingship in the OS
market in India, with average of 96%21
market share. What is interesting is
that iOS sees a jump in Q4 every year
and has managed to slightly increase
its market share in the past year.
Android continues to be the most preferred OS choice of India
iPhone may be less than 3%21
of the smartphone market in India, but it is expected to
reach a 10mn active user base in India in 2018 (it stands at 8.9 mn active users as of
December 2017). Though, there are already many OEM brands that have surpassed this
milestone like Samsung who has 120 mn and Xiaomi who has 28 mn active users as of end
2017; Apple has done exceptionally well in a price sensitive market like India where 56%
of the Smartphones sold are still sub Rs. 10,000.
21
IDC June 2017 |21
http://www.cxotoday.com/story/smarphone-sales-hit-due-to-demonetization-idc/ / CMR Research
Apple, though slowly, is growing in India!
Mobile Marketing Ecosystem Report 2018, India. 14
Smartphone OS Share
2017 01
2016 04
2016 03
2016 02
2016 01
2015 04
2015 03
2015 02
2015 01
86% 88% 90%
Android iOS Tizen Windows Phone
92% 94% 96% 98% 100%
Source: IDC June 2017
2.2%
1.2% 1.3%
3.3% 1.5%
0.3%97%
97%
97%
97%
97% 0.9% 0.6% 1.34%
95% 3.2% 1.2% 0.66%
95%
2.2%
2.5%
0.5%
0.5%
0.03%
0.22%
94%
94% 1.7% 2.3% 4.28%
1.8% 1.1% 3.01%
The advertising industry is on a march toward automation. Plenty of advertisers today are
buying digital ads without speaking to a single human at a media company, and print and
TV ads might not be far behind. Automated, or programmatic, buying is growing not only
because it makes ad transactions more efficient but because it can make them more
effective, as long as the right data is applied.
Programmatic is no longer a buzzword, many agencies, and evolved advertisers
(including e-commerce, auto and FMCG) have dabbled (read budget) on DSP platforms
and retargeting platforms. A pure programmatic buy would help a marketer to cap the
frequency of exposure of their campaign across publishers and let them transparently
manage the media buys across a list of publishers. Layer this with data and they have
created an audience buying campaign which, can also be used for retargeting to an
audience set.
growing in India, big and traditional business players like Pepsi, Ford and L’Oréal have
shifted over 50% of their digital budgets to programmatic advertising.
In this section we talk about the basics of ad serving, at what level programmatic comes
into the picture, effectiveness of programmatic for stakeholders, the current state of
programmatic in India as well as case studies of brands on the frontline of programmatic.
India is still in nascent stages of
programmatic adoption relative to more
digitally mature Asia-Pacific markets
like Australia and Japan. According to a
Forrester Study, programmatic buying
adoption for India is at 38% compared
to the overall APAC adoption rate of 41%
. That said, adoption is poised to pick up
in the next 24 months as 52% of
marketers in India are either planning to
adopt or currently evaluating whether
to adopt programmatic buying. Also, in
India maximum programmatic spends
(92%) on mobile are done on mobile
app inventory.
Part III: Programmatic Ecosystem in India
Even though programmatic is still
Mobile Marketing Ecosystem Report 2018, India. 15
While India is still in the early stage of adoption compared to digitally mature Asia-Pacific
markets like Australia and Japan, it has quickly ramped up the programmatic space.
According to a recent study, India ranks near the top globally in terms of growth for
programmatic ad spending1
.
India is in the state of Programmatic evolution, saw 81% growth in 2017
Switzerland
India
Finland
Australia
Italy
China
Sweden
Spain
Germany
Japan
Russia
France
US
Denmark
Canada
UK
$46.00
$116.20
$43.60
$508.70
$297.70
$3,854.30
$168.80
$197.10
$631.90
$1,981.70
$119.20
$649.80
$24,224.00
$218.80
$878.70
$3,697.80
$100.80 119.00% $227.70 126.00%
$210.60 81.30% $371.70 76.40%
$95.20 118.30% $149.80 57.40%
$776.40 52.60% $1,213.40 56.30%
$412.00 38.40% $587.50 42.60%
$6,038.20 56.70% $8,526.70 41.20%
$338.60 100.50% $456.20 34.70%
$263.90 33.90% $348.00 31.90%
$853.30 35.00% $1.082.8 26.90%
$2,703.90 36.40% $3,390.40 25.40%
$159.10 33.50% $197.90 24.40%
$821.30 26.40% $1,011.60 23.20%
$30,928.30 27.70% $38.035.6 23.00%
$294.80 34.80% $360.20 22.20%
$1,094.40 24.50% $1,324.00 21.00%
$4,436.90 20.00% $5,259.80 18.50%
2016 2017 % change 2018 % change
Mobile Marketing Ecosystem Report 2018, India. 16
Source: Onaudience.com, "Global Data Market Size 2016-2018," Feb 19, 2018
Netherlands
New Zealand
Worldwide
$425.80 $643.30 51.10% $717.80 11.60%
$26.30 $30.40 15.40% $33.60 10.70%
$40,915.30 $54,470.80 33.10% $69,513.50 27.60%
An interesting point specifically for programmatic in India is its propensity towards
guaranteed buys. It is poised to be one of the top markets for programmatic guaranteed
- with penetration projected to reach 17% in 2020 based on a Boston Consulting Group
study, on par with that of Australia or China. This may be due to prominent publishers
who are driving uptake of programmatic buys and a concern with ad fraud, which drives
spend from direct traditional buys to programmatic guaranteed. This is a promising
trend, given how India has had most of ad spends in direct budgets.
Source: Boston Consulting Group, 2018
https://www.bcg.com/publications/2018/rise-programmatic-guaranteed-advertising-asia-pacific.aspx
India at power with China in terms of Programmatic Guarantee buys
Mobile Marketing Ecosystem Report 2018, India. 17
Currently, marketers in India tend to approach programmatic as a direct response driver,
accessing mostly remnant long-tail inventory. As marketers grow more savvy, they will
understand its value for brand campaigns with the ability to purchase premium
audiences and inventory. Likewise for publishers, while there has been encouraging
movement by publishers to offer access to more of their inventory via programmatic
(e.g. TrueCaller with roadblock inventory and Saavn with audio inventory ), there are still
legacy publishers who view programmatic primarily as a means to move cheap or unsold
inventory. The trend towards transacting more premium inventory via programmatic is
expected to accelerate programmatic adoption within the market, with prominent
advertisers such as Ford India transiting majority of direct deals to transact
programmatically .
Programmatic allows publishers to maximize their earnings from their inventory by:
https://www.thinkwithgoogle.com/intl/en-apac/tools-research/-
programmatic/about-time-consolidate-ad-buys-get-more-from-teams-media/
http://www.forbesindia.com/article/special/saavn-launches-pro-
grammatic-audio-advertising-in-india/45717/1
https://www.thinkwithgoogle.com/intl/en-apac/tools-research/-
programmatic/about-time-consolidate-ad-buys-get-more-from-teams-media/
Identifying and selling each impression uniquely as compared to a block of
impressions. This allows each impression to be sold at the maximum value, in turn
maximizing the yield of overall inventory
increasing the value of the remnant inventory, as each impression is sold for the value
of the visitor as against the time slot / placement. Suddenly the impressions which
were difficult to sell start looking premium to advertisers as they are targeting
visitors
helping publishers to control the pricing for their inventory using business rules,
allowing them to offer differential and / or premium pricing based on the
requirements and niche audience
also helping publishers to gauge what is selling on a real time basis, which segment
of users is getting higher value and what content are these users consuming on their
sites. Thus allowing them to improvise and tweak their publishing strategies based on
demand
creating private marketplaces which can help a publisher create an exclusive club of
bidding advertisers and to be a part of this club, advertisers can be pushed to spend
either a minimum threshold or an over premium floor price
Why programmatic for publishers?
Mobile Marketing Ecosystem Report 2018, India. 18
Programmatic buying is nothing but an efficient method of buying from an advertiser’s
perspective.
It reduces the need for manual operations across the board and hence helps in
reducing the related cost
Why programmatic for advertisers?
Allows the advertiser to buy only the relevant inventory, by giving them an
opportunity to evaluate each impression before making a buying decision (read
audience buying) across publishers. It also helps them to cap the number of
Mobile Marketing Ecosystem Report 2018, India. 19
exposures of a campaign to each user across publishers, further increasing the
reach of a campaign within the same budget
It also allows a unique window for a advertiser/publisher to look into the audience
and content profile to which their campaign is getting exposed, enabling them to
understand the segments and content which are converting, even better
With programmatic method, it is easier to optimise a campaign based on
conversion and viewable impression data. However, the auto optimizations are done
through platforms with integrated machine learning algorithms and is not available
across the DSPs
Agencies have been asked this question several times and it is hard for the agency to
differentiate its value in an open exchange buying method. However, the might of an
agency is highlighted in the programmatic direct and programmatic guaranteed models.
With programmatic guaranteed and programmatic direct, agencies can influence the
buying price towards the lower end of the spectrum (read floor price) which is
beneficial for the advertisers and at the same time can allocate a larger chunk of
spends towards deserving publishers
Agencies are also benefited by the transparency layer available within the
programmatic buying platforms and the granular level data, helping them to analyze
and optimise their buys
Programmatic / automation reduces the operational flak from the system e.g. it’s
faster to take the campaign live, real time reports etc
Why programmatic for agencies?
Whenever a publisher’s ad server would receive an ad request, it would start calling a
predefined list of ad networks, SSPs for filling in the inventory. The list is prioritized by the
publisher, either manually or dynamically, based on the yield (return) being generated by
each respective network for relevant campaigns. The first network/SSP in the hierarchy
to respond with a bid (highest within that SSPs environment) which is higher than the
floor price is accepted as the winning bid. This is called as waterfall model.
Types of Bidding – Waterfall model
Mobile Marketing Ecosystem Report 2018, India. 20
Types of Bidding – Header bidding (the publisher side optimization)
The limitation of the waterfall model is that there is a missed opportunity in accepting the
first acceptable bid. The networks lower in the funnel of the waterfall model end up
evaluating only impressions which have not already been bought and cannot see
impressions for which they were willing to pay higher money but being lower in the funnel
could not evaluate. Hence loss of an earning potential for the publishers.
To overcome this problem of the waterfall model, the header bidding was introduced. The
header bidding script, once integrated in the publisher inventory, contains all the relevant
information of each ad unit on the page. As soon as the page starts loading on the user's
Mobile Marketing Ecosystem Report 2018, India. 21
The waterfall model for programmatic buy
Typical Publisher
Premium Direct
Premium Programmatic
Open Programmatic
Standard Direct
Sponsorship
Custom Executions
High CPMYield
Direct Demand
Non Standard
HighVolume
Guaranteed Delivery
Prioritized Remnant
Repackaged Media
Undifferentiated Media
Demand-Supply imbalance
ContextTargeting
AudienceTargeting
ROS & RON
PMP
SSP
Ad Nets
Technology
High
HighLow
Low
Price
Priority
Predictability
Targeting
Efficiency
Accessibility
Direct
RTB
Automated
Semi - Automated
Manual
Workflow
Programatic Direct
Direct
Orders
Programmatic
Orders
Preferred Deals
Deal ID
Private Auctions
Open Auctions
browser, the header bidding scripts
present in the header of the page
starts an auction and fires request to
all the exchanges simultaneously. This
allows a publisher to add more bidders
to the auction of the inventory,
increasing the chances of getting
higher fill rates and better pricing. This
is also important for advertisers, as it
allows networks and exchanges to have ‘first lookup’ of each impressions allowing the
opportunity to be able to bid for the relevant impressions.
There is general optimism around programmatic adoption and maturation in India,
affirmed by encouraging results from both the demand and supply side as publishers
offer more sophisticated and premium ad buys while advertisers move more spend
towards programmatic.
However, there are still obstructions to overcome for mainstream programmatic adoption
such as the prevalence of direct deals in the market and the perception of programmatic
inventory as the channel reserved for transacting low-value inventory. There is also
demand to harness richer data/audience segments by publishers to bring more value for
advertisers, something which is not yet the norm in the India market.
Future trends and challenges for programmatic in India
6
https://assets.kpmg.com/content/dam/kpmg/in/pdf/2017/01/Digital-the-new-normal-marketing.pdf |
7
https://www.thedrum.com/news/2017/07/25/programmatic-moving-beyond-the-buzzword-india-buy-
and-sell-side-adoption-matures |
8
http://www.forbesindia.com/article/special/saavn-launches-programmatic-audio-advertising-in-india/
45717/1 |
9
https://www.thehindubusinessline.com/info-tech/programmatic-tech-set-to-steer-digital-advertising/
article10027030.ece
Mobile Marketing Ecosystem Report 2018, India. 22
Waterfall Auction Header Auctionvs.
$ 2.00 floor
Below Floor
Request
Passback
Request
Partner #1
Partner #2
Partner #3
Partner #4
Winning Floor
Not Called
Not Called
BID
$1.50
BID
$2.20
BID
$3.00
BID
$2.40
$ 2.00 floor
Below Foor
Partner #1
Partner #2
Partner #3
Partner #4
Losing Bid
Winning Bid
Losing Bid
BID
$1.50
BID
$2.20
BID
$3.00
BID
$2.40
Mobile Gaming in India is dominated by
freemium games. 2016 saw a 200%23
increase in gaming app revenue, which
will grow at a CAGR of 87% till 2020,
crossing the USD 1 billion mark. The
Indian gaming market is booming, with
maximum growth (in both downloads
and revenues) driven by Google Play, as
proliferation of low-cost Android
devices across lower-tier Indian cities continues to soar. In the last 2 years , game
downloads in India has doubled, with Google Play generating 13 times23
more downloads
compared to App Store.
In the last 2 years there has been an increase of 80%23
in app store revenue from games.
Whilst iOS constituted to less than a tenth of game downloads, iOS gamers contributed
around 70%23
of the revenue, as iOS was the more premium segment of the market. On
the contrary in 2016, Google Play revenue grew to match iOS as the majority Android
users started spending on games. This trend is expected to grow as more and more
premium users delve in high-end Android phones. Similarly, a CAGR of 48%23
growth in
mobile app download will be seen by 2020.
By 2020, mobile gaming app consumer spend to reach 1 billion USD
Part IV: Key Verticals driving the Mobile Advertising
(A) Mobile Gaming
Mobile Marketing Ecosystem Report 2018, India. 23
Downloads
Games Downloads
iOS and Google Play Combied, India
Q2 2014 Q2 2015
0 M
100 M
200 M
300 M
400 M
Google Play
iOS
Q2 2016
2.1x
2015
08
18
28
116% Growth
38
Downloads
48
58
68
2016F
Source: App Anne
Mobile Games Forecast - Annual Downloads
India
2020F
5 year CAGR: 48%
2015
$0.08
$0.58
$1.08
$1.58
200% Growth
Revenues
2016F
Source: App Apple
Mobile Games Forecast - Annual App Store Consumer Spend
India
2020F
5 year CAGR: 87%
Download growth can be observed across nearly all gaming categories on Google Play in
India, as its emerging user base continues experimenting with different types of games.
However, Q2 2016 highlighted a shift in India’s gaming behavior, with a significant
increase in time spent on immersive strategy games versus casual games compared to
the same quarter in the previous year. While convincing users to spend money on games
remains a challenge in India, two categories stand out for solid improvements in
monetization: strategy and social card games. The latter has been able to ride on the
success of mobile adaptations of traditional Teen Patti card games.
Strategy and Social Card Games Drive Monetization!
Gaming has grown to be more popular than entertainment, news, social media and
other general apps. 9 out of 10 users24
have games on their phones regardless of their
gender or the price of the phone. 59%24
mobile gamers in India are Millennials.
For consumers the madness in gaming is just getting better - more engaged users on
mobile gaming apps
24
Tune India Gaming 2016
Mobile Marketing Ecosystem Report 2018, India. 24
Top 5 Games Categories by Time Spent
India, Android Phone
Top 5 Games Categories by Revenue
India, Google Play
0 50 100
Indexed Revenue
Strategy
1.7x
0.8x
2.9x
1.3x
1.2x
Casual
Action
Sports
Social Card
150 200
Source: App Anne
0 50 100
Indexed Revenue
Strategy
1.8x
1.9x
1.4x
1.1x
1.3x
1.3x
Casual
Action
Sports
Social Card
150 200
Source: App Anne
Q2 2015 Q2 2016 Q2 2015 Q2 2016
84% of mobile subscribers have games on their devices
37% have more than 3 games on their phone.
Almost 9 in 10 indian smartphone owners play games weekly
A whopping 57% prefer single player games
1 in 10 people play the same game regularly for over a year
There are a few facts that we can start off with,
which are a clear indication of the madness that is gaming!24
India is in the top 25%25
of countries
globally for mobile user retention. After
14 days of installing a gaming app,
around 24% of the users retain the game
globally, whereas in India, it is 30.1%25
.
Also, 12% mobile gamers in India play a
game for a year.
Women make up just 22%26
of all mobile
gamers in India, however, when it comes
to the frequency of playing mobile
games, 79% of females reported that
they played daily, compared to 71% of
males.
Additionally, female gamers spent nearly
70 minutes26
a day playing mobile
games, in comparison to 55 minutes per day for males. 33%4
women gamers have
downloaded more than 5 games on their smartphones, 37% more than men. Strategy
seem to be the common genre of games that both men and women like to play.
versus 54% men. The reason these games are preferred, stems from the Indian
population’s need to commute locally , making single player games the way to pass this
time. Also, for single-player games there is usually no requirement for internet connection
or hefty data streams.
Another trend in the Indian mobile
gaming market is the rise of single-
player games. These have become
increasingly popular and managed to
top the charts of the gaming apps with
highest download rates.
63%27
women play single player games
Indian gamers tend seen to be more engaged than their global counterparts
25
Tune India Gaming 2016 | 26
Gamesbond 2016
Mobile Marketing Ecosystem Report 2018, India. 25
How long do you play the games you typically like?
Women download more games compared to men;
Puzzle, strategy and casual games most popular
Source: India and Mobile Gaming Report 2016
Monthly Mobile Game Downloads
More than 5 Games
20%
16%
13%
12%
12% Puzzle
Strategy
Casual
Arcade
Action
Racing
Others
16%
14%
25%
18%
8%
7%
7%
11%
5 Games or less
A Few days A Few weeks A Few months Over a year
49%
12%
16%
23%
India Mobile Gaming: Single player, two player or team?
24% 33% 76% 67%
23%
54%
11%
14%
21%
11%
18%
9%
63%
Single Player
Player vs Player
Team Games
Team vs Team
Case studies for Mobile Gaming
Mobile Marketing Ecosystem Report 2018, India. 26
(B): Rise of vernacular/Indic content in India
9 out of every 10 new internet likely to prefer vernacular/Indic content to access
internet online
The Indian language internet users
have grown from 42 million28 in 2011
to 234 million in 2016, a 12x growth,
almost double from the 2x growth
seen in the English language internet
users. Over the next five years, it is
expected that 9 out of every 10 new
internet users in India are likely to
prefer vernacular or regional
languages to access the internet. The Hindi internet user base is likely to outgrow the
English user base by 2021. The English language still accounts for 56%28
of the content
online, whereas, Indian languages account for less than 0.1%. The anomaly here is that in
India only 12%29
population can read/write English. The Indian government is investing on
digital literacy and using digital media to help reach the rural parts of the country. Within
the last year, Hindi content on the web has grown by about 94%28
, whereas English
content has grown by 19%. Furthermore, the increase in the availability of local language
content online would help in increasing the internet penetration by 24%28
.
While Chat applications and digital entertainment will bring new Indian language users
online growing at 19% CAGR30
in line with the growth in total Indian language user base.
Going forward Digital write-ups, digital payments, online government services, e-tailing
and digital classifieds are emerging categories among Indian language users. Indian lan-
guage user base accessing these categories will grow at a CAGR of 26% to 33% over the
next five years. With increased local language support and content, these categories will
see increased adoption among users.
28
IAMAI and IMRB Proliferation of Indian Language Report 2016 | 29
Census India | 30
KPMG & Google Indian Languages
Defining India’s Internet Report 2017
Mobile Marketing Ecosystem Report 2018, India. 27
Internet user base in India (In Millions)
2021
~ 12x growth
~2x growth
2011
English language internet users Indian language internet users
134
The next 5 years look really promising in the growth of Indian language usage
penetration among various businesses. Digital Entertainment is already on its epitome
with Hindi and seeks to reach the same with Gujarati, Kannada and Malayalam by 202131
.
eTailing sees a comparatively low growth, whereas Digital News see a sustainable
growth. The maximum growth is seen in Digital Payments with a 2x31
growth across all
languages.
31
KPMG & Google Indian Languages Defining India’s Internet Report 2017
Mobile Marketing Ecosystem Report 2018, India. 28
Category wise Indian language internet users-2016 & 2021P(in million)(11)
Totalinternetuserbasefor8languages(2016-186million):(2021P-426million)
CAGR(Userbaseadoption)till2021P
396 392
301
284
185
175 172 165
100
169
0
Chat
Applications
Digital
Entertainment
Social Media
User base 2016
(in million)
Digital News Digital
Write-ups
Digital
Payments
Online
Government
Services
Digital
Classifieds*
50
100
150
200
250
300
350
400
450
0%
5%
10%
15%
20%
25%
30%
35%
167
115 106
58
47 41 42
24
E-tailing*
User base 2021 (P)
(in million) CAGR
19% 19% 21%
22%
26%
30%
33%
32% 32%
Affordability, accessibility, applicability, and awareness-building are the four areas where
most of the work has to be done in-terms of mobile growth in India. The first 2 areas are
growing, we really need to work on the latter two - applicability and awareness building.
Many brands have taken a step forward and have included regional language in their
interface. However, there is more that still needs to be done.
In December 201633
YouTube declared that it
will be showing users in India more content in
their preferred local language. The localized
content languages will be available on both
YouTube’s homepage and in its trending
section, and will be targeted based on users’
watch history. The new languages include
The smartphone manufacturers also need to deploy Indic language supported keyboards
as 70%32
of the Indian language users find it difficult to operate English keyboards.
While many people are creating indic content, more effort required to
make it mainstream
Mobile platform Launch
August, 2015
2012
Hindi, Tamil, Telugu,
Malayalam and Gujarati
Hindi, Tamil, Telugu
Bengali, Punjabi, Marathi,
Kannada and Gujarati
among others
India’s first vernacular
rail booking app in
5 languages
To double non-English
users every 6 months
in India
Language Purpose
2009
January, 2015
Hindi, Bengali, Marathi,
Tamil, Telugu, Gujarati,
Punjabi, Malayalam and
Kannada.
Hindi, Marathi, Gujarati,
Bengali, Tamil, Telugu,
Kannada and Punjabi.
‘Tap to Translate’
‘Google Loon’- provide
connectivity in rural
areas
Create a localized
experience; can deliver
on a global scale sitting
in India.
November, 2012
32
KPMG & Google Indian Languages Defining India’s Internet Report 2017
Hindi First to create a Hindi
app to increase the
account holders to 80%
who use apps
Mobile Marketing Ecosystem Report 2018, India. 29
Bengali, Gujarati, Hindi, Kannada, Malayalam, Marathi, Punjabi, Tamil and Telugu. A great
decision by YouTube as by 2021 vernacular content consumers in India will be more than
double5
English content consumers (536 million34
vs 199 million).
33
http://indiatoday.intoday.in/technology/story/youtube-in-
dia-will-now-show-more-local-language-content/1/830066.html | 34
http://brandequity.economictimes.india-
times.com/news/media/how-ott-players-are-geared-up-to-woo-indian-viewers/57275909
1) Availability of quality supply for advertisers.
2) Ability of the Brands to connect with “Bharat”(multi-language and rural) and not
only “India” (predominantly english speaking)
3) Better price realization for publishers will drive further investments in enlarging the
quality base of Indic publishers
User generated content:
We will see a rise in the participation of the Indian language users, due to the vernacular
friendly apps and platforms. Thus, allowing a transition from passive users to active users,
leading to a rise in opinion and user generated content. Tools such as dictionary, spell
check, grammar check, translation & transliteration should be developed for Indic
languages (publishers and developer both).
Size does matter:
The major issue when it comes to developing a web page/app in regional language is its
size. Since regional language fonts are complex in comparison to English, such a
webpage is often ‘heavier’. This limits page size and it takes more time for a regional
language web page to load. This limitation often restricts site versatility that ultimately
affects the end-user’s experience.
Indic Keyboards:
45% of Indian language users face challenges in text input on chat applications. Adoption
of input mechanisms such as voice to text support, local language keyboards and
transliteration is expected to improve user experience. Inclusion of Indian language fonts
and keyboards in mobile handsets depends on the discretion of the hand-set
manufacturer. So OEMs have to put their best foot forward and integrate keyboards that
at-least have 22 national languages of India.
Voice to Text:
Facebook and Google are both developing “Voice to Text” software for different
languages, which is a killer combination and will resolve the content creation problem
completely. People who don’t know how to write can also send messages and create
content via this tool.
Where does the Future Stands?
An outlook for Marketers!
Mobile marketing ecosystem report 2018, India. 30
Case study for Vernacular Content
Mobile Marketing Ecosystem Report 2018, India. 31
India is a developed market for entertainment content consumption, with entertainment
being one of the top 3 internet activities for both Rural and Urban internet users. The
consumption of video has jumped many folds, especially on mobile devices. The future
predicts, video being the largest share of the pie on content consumed on mobile
internet, growing from 49%35
in 2016 to 75% in 2021.
The appeal of video is easy to understand. It lends itself to storytelling in a more
engaging and entertaining way than print and radio. Consumers pressed for time and
conditioned for instant gratification—meaning almost everyone naturally gravitate
towards video. Online video is the fastest-growing segment with year-on-year (YoY)
growth rates reaching 64% with almost 250 million online video viewers in India in 2017.
(EY, India’s Media and Entertainment Sector, March 2018 report)
small period Netflix gathered 4.2 million37
active subscribers, at a minimum of Rs.500 per
month subscription for a single screen user. Leading the chart is Hotstar at 63
million37
active users banking on its first movers advantage, live cricket streaming and
premium HBO content (especially Game of Thrones).
In India, the number of video-capable
devices and connections are expected
to grow 2.2X between 2016 and 2021,
reaching 800 million36
in number.
Currently, the number of OTT (Over the
Top) / VOD (Video on Demand) players
in India have significantly increased
reaching over 1001
million users with the
likes of Hotstar, Voot, Netflix, Amazon
Prime, Sony Liv and Zee5. In a very
(C): Mobile OTT Video
India has 250 million online video viewers, 100 million OTT viewers
35
KPMG Media and Entertainment Report 2017 | 36
EY Digital Opportunity 2017|
37
http://brandequity.economictimes.indiatimes.com/news/media/how-ott-players-are-geared-up-to-woo-indian-
viewers/57275909
Mobile Marketing Ecosystem Report 2018, India. 32
Content consumption by category for
Mobile Internet users in India
2016 2021
49%
39%
10%
2%
75%
16%
6%
2%
Video Streaming audio File Sharing Web and Another Data Video Streaming audio File Sharing Web and Another Data
YouTube stands 2x38
in-terms of
monthly active users when compared
to OTT players in the country. With
OTT players only 3 years old in India
and YouTube was launched 10 years
ago, the growth graph of the former is
soaring high and (if not sooner)
will reach near to YouTube in the years
to come.
The drivers to growth in OTT con-
sumption on YouTube are the growing
web series and the growing regional
content that caters to Indian’s 90%
(approx) regional language speaking audience. This has also led to the growth of long
format content consumption (above 5 minutes38
).
OTT players running towards their share in the YouTube audience
Mobile Marketing Ecosystem Report 2018, India. 33
Video Platforms
Online Video: Market share by installs
March - 2017
Others consists of: TVF, The Viral Shots, Vixty, Viu, DailyMotion, TubiTV
HotStar 37.2%
6.7%
5.3%
2.9%
1.5%
0.6%
5.5%
1.0%
1.8%
10.9%
7.3%
5.4%
1.3%
1.5%
2.3%
8.8%
0 5 10 15 20 25 30 35 40
Hungama
Wynk Movies
YuppTv
ErosNow
Spoot
Dragonfli
Netflix
ColorsTV
Voot
Amazon Prime
Sony Liv
Tatasky
HelloTV
OZEE
Others*
Active users of Youtube and OTT platforms
Monthly active users (mn)
Source: OTT and VoD player interviews, Analysys Mason
225Youtube
Hotstar
Voot
Amazon
Netflix
Sony LIV
Subscription only
Hybrid
Free
TVF Play
ALT Balaji
75
30
13
5
5
4
2
Ott
Platforms
Gaining
Popularity
39
IDC 2018
Globally, people spend an average of 45
minutes daily on their smartphones to
watch videos. India is slightly higher
with 5039
minutes spent daily on
smartphone video viewing. Video
viewing on Smartphones did beat that
on desktop (at 45 minutes), however,
has a long way to go to beat live TV time
at 73minutes39
, a whopping 40% more.
38
Nokia MBIT Report 2018
VOD/SVOD blurring the lines between TV and Video content consumption
Mobile Marketing Ecosystem Report 2018, India. 34
Screen video view timings (in minutes)
Global
Live TV On Demand
TV
Computer Tablet Smartphone
India
22
37
37
17
5045
73
20
45
66
86%40
TV viewing consumers also
interact with Facebook as their
second screen while watching TV, for
Twitter it's 66%40
. Social media in
2016 didn't only expand its portfolio
with video content but also gave
consumers a new addiction - live
streaming. A global survey said that
50%41
of marketers plan to use live
video services for their marketing
campaigns in 2017.
The Indian market has now seen an uptake in SVOD (Subscription video-on-demand)
services. With Netflix, Hotstar Premium and Amazon Prime delivering great content,
consumers are actually ready to pay for premium content on these platforms. A new
addition in the Indian market will be YouTube Red which will see a surge in the next 2
to 3 years.
Homegrown production house like Culture Machine, Girliyappa, AIB, TVF, Blush, Bindaas,
Eros Now, Hats Off Production, Open Window, Trend Loud etc. are creating web series to
entice the Indian audience and also getting millions of views for it. Low priced services
like Amazon Prime at Rs.999 yearly and Hotstar Premium at Rs.199 per month, SVOD will
sky rocket in India in a couple of years.
So now marketers have many opportunities with video advertising where they can, not
only leverage made for TV content on platforms like Hotstar, Voot, Zee5 etc. but also
leverage from consumer created content like vlogs, Snapchat stories, Instagram stories,
periscope live feed or Facebook live video.
Integrated planning helps marketers to know their user’s consumption habits both, on
offline and online media. With mobile integrated you can also have more in-depth
tracking of your campaign that is beyond reach and talks about clicks, visits and
engagement etc. Further, retargeting your customers and lookalikes on varied digital
platforms for your consecutive campaigns.
India is in the state of Programmatic evolution, saw 81% growth in 2017
Mobile Marketing Ecosystem Report 2018, India. 35
Internet users in India who subscribe to select suscription
Video-on-Demand (SVOD) Services, Feb 2017
%of respondents
Don’t know/notsure
Subscribe to SVOD
Top 3 services
1. Hotstar 52%
2. Amazon Prime Video 49%
3. Netflix 12%YES
52%
NO
43%
5%
So, what makes a video ad engaging for the
consumer? Make the add funny!42
The
Millward Brown Video Ad Reaction Study
found that funny content is the top priority
for both Indian and Global audiences to not
skip an ad. Consequently, if the ad is of their
favorite category, brand or they are getting
rewarded on seeing the ad, they would
happily give marketers a complete view for
that ad.
Case Study for Mobile Video (integrated campaign)
39
Millward Brown Ad Reaction Study | 40
http://www.socialmediaexaminer.com/wp-content/
uploads/2016/05/SocialMediaMarketingIndustryReport2016.pdf | 41
https://www.nabshow.com/thought-gal-
lery-thought-leaders/6-key-media-and-entertainment-trends-look-2016-nab-show
How to engage your video viewing audience?
Mobile Marketing Ecosystem Report 2018, India. 36
Since the growth of OTT video platforms from late 2015, a stereotype has been
maintained on the usage of these platforms. Quotes like ‘mostly metro audience use OTT
video platforms as they have better access to 3G/4G network’ and ‘mostly premiere
audience who wants to consumer English content only access the OTT video space’.
As per the latest report (India Watch Report 2018) by Hotstar, we see that 26%43
of
premier English content consumption audience who watch Game of Thrones on the
Hotstar platform also watch Hindi TV shows and 25% of North and West Indian audiences
watch Telugu movies (virtually nullifying the language barrier).
The report also showed that non-metro cities showed more growth compared to metro
cities in watch-time. Jammu and Kashmir and North East showed the maximum growth,
3x43
more than metro cities.
This shows that the growth opportunity for OTT video players in India is beyond metros
and in the coming 2 to 3 years we will see more tier 2 and 3 cities will absorb more
on-demand content.
All of this is the thought of the past. 2017
saw a 360-degree change in OTT
content consumption that shattered all
perception that marketers had about
video content consumption patterns.
42
Millward Brown Video Ad Reaction Study
Breaking Stereotypes!
Mobile Marketing Ecosystem Report 2018, India. 37
Did you really see an ad or you just scrolled through it or you
were on another screen reading an article when the video ad
was playing in the background? These are a few questions
going in a marketer’s mind. Do internet users engage with an
ad to even recognize its presence while they are engaging
with the content they went online for? This is the question of
viewability. Viewability is an online advertising metric that
aims to track only impressions that are actually seen by
internet users.
Furthermore, when it comes to mobile display ads the thumb moves faster than the eyes
can register. Users don’t stop to see an ad then why should a marketer pay for a
un-viewable impressions.
With only 40%4
of ads viewable in the India market, ad viewability is the biggest risk that
brands face; it is the biggest digital accountability challenge for delivering effective
digital campaigns. For this reason many industry bodies and agencies have created
viewability standards. While platforms like YouTube and Facebook have challenges on ad
viewability, OTT platforms like Hotstar report over 85% ad viewability as they create a TV
similar experience in serving ads to ensure completed views. They however cap ad breaks
to a max of 60 secs to ensure sustained viewer interest in continuing with the content
Ad effectiveness, let’s talk Viewability
Since the advent of YouTube, followed by platforms like Vine, Twitter, Instagram, and
Facebook (and many other social platform); video content both brand and user
generated has been a rage. However, this isn’t exactly good news for marketers as the
content created can be spam, criminal or adult. The question marketers need to ask is
about contextual brand safety.? The content on which my brand’s name and ad is to be
seen, is it safe and blends with my brand’s reputation?
Contextual Brand Safety
43
Hotstar, India Watch Report 2018
Mobile Marketing Ecosystem Report 2018, India. 38
50%40%
10%
Non Viewable ads
Viewable ads
Invalid Traffic
After the YouTube fiasco early 2017, contextual brand safety is the top most priority for
many brands. YouTube and other Google sites have taken a fall due to brand safety issues
as many big brands stop advertising on these platforms.
No Advertiser Ads may be placed on inventory that contains material that:
Infringes the intellectual property rights of others (including but not limited
to unauthorized copies, public performances or derivative versions of
software, films, television programs, music, books, electronic games, or other
categories of protected works)
Induces, facilitates, promotes, or enables financial benefit from such
infringement (e.g.P2P/Bit Torrent/MP3 tracking and indexing sites, “linking”
or “leeching” sites, ROMs, “warez”, emulators, hacks, “phreaks,” “cracks,” or
ripping software for illegally circumventing DRM or other copy protection
devices)
Promotes or facilitates illegal activities, deceptive practices, or violations of
the privacy rights of others
Promotes or facilitates activities generally regarded as Internet abuse,
including but not limited to, the sending of unsolicited bulk electronic mail or
the use or delivery of viruses, Spy-ware, or another malware
Relates to violence, sex, profanity, racism, sexism, religion, gambling,
pornography, abortion
Mobile Marketing Ecosystem Report 2018, India. 39
An outlook for Marketers!
Smarter Phones, Cheaper Data costs, and successful marketing has made OTT platforms
all pervasive, and the App usage time for them has skyrocketed. Brand and advertiser
today don’t need to focus on only one platform for Video advertising, and can
pick-and-choose quality supply given to them by all players.
OTT viewing compliments TV viewing - mobile is the new primetime!
Majority content of the homegrown video OTT players is from their TV channels. Even
though people can now record the content on their TV via their digital set-top boxes,
having one platform that has all the TV content available without the action of recording
or browsing multiple channels has become one of the main reasons people have adopted
OTT platforms.
Another dimension to the adoption is
streaming sports in real-time, Hotstar saw
tremendous growth in their viewership with IPL
matches. Mobile is increasingly becoming the
preferred screen as opposed to a catch-up screen vs. TV.
Mobile Marketing Ecosystem Report 2018, India. 40
Consumer engagement is a major issue for all advertisers due to the shorter attention
span of the user today. Long story content offers the unique opportunity for marketers to
talk to audiences engaged with content for 20 minutes44
or longer. It also provides more
slots to drive frequency of message.
The Next Content Evolution - ads go beyond 30 seconds as longer format creative
content becomes more popular
44
Hotstar, India Watch Report 2018
Viewability and Brand Safety have now become synonymous to digital video advertising
globally. As mentioned earlier in this chapter, contextual content and actual reach
(in-terms of who has seen your video ad) now decide the performance of your video
campaign. These two parameters should be followed to the ‘T’ and all brands should
on-board third party tools like OpenSlate and MOAT to measure the effectiveness of their
video campaigns.
Viewability and Brand Safety for Brands
Source: Hotstar, India Watch Report 2018
When compared to 2015, in 2017 the consumption of long format videos on YouTube45
doubled and on Hotstar, the leading OTT player average time spent is 43 mins per day
per user, with 96% of watch time coming from video greater than 20 minutes.
Long story ad format solves this problem by providing more emphasis on entertainment
and story. Long story ad formats don’t have the short lived objectives of clicks and
complete views; they actually work on long-term objectives of creating brand affinity.
Also, the brand has a bigger canvas (in-terms of time) to reinforce its message and
a larger engagement opportunity with its consumer.
45
Nokia MBIT Report018
Mobile Marketing Ecosystem Report 2018, India. 41
Time format of most popular videos onYouTube India
Source:Vidsstatx, Analysys Mason
90%
2015
10%
75%
2017
25%
Short-format
Long-format
‘Snacky’ is passe: real stories matter
One third of all Hotstar entertainment viewers follow their favourite shows primarily on Hotstar TV
of watchtime on hotstar
comes from videos longer
than 20min96%
Case Study for OTT video platforms helping in creating better Brand Awareness
Mobile Marketing Ecosystem Report 2018, India. 42
Music Industry size in India (in INR billion)
CAGR growth 13%
(2015 vs 2016) 25.4
22.1
19
16.3
14
12.2
10.8
9.8
9.6
10.6
9
2011 2012 2013 2014
Source: KPMG and FICCI
2015 2016 2017(E) 2018(E) 2019(E) 2020(E) 2021(E)
CAGR growth 15.8%
(2016 vs 2021)
On-demand entertainment services led by audio and video content are at the cusp of
inflection point in India. A very promising supply side ecosystem has evolved in India for
streaming with multiple players.In the last 2 years with more smartphones, cheaper
internet and launch of various domestic Audio OTT players, the scenario has changed. In
2016 India had 10042
million Audio OTT users.
OTT audio will increase at a CAGR of 15.8% till 2021
(D): Mobile OTT Audio
Sales of music rights generated robust revenues, at about 5%43
of the production cost of
a movie for filmmakers in 2016. This was attributed to an increase in syndication and
digital consumption of music and licensing of music from major labels by various music
streaming platforms such as Gaana, Wynk, Hungama and Saavn. Apart from established
players like Saavn, Gaana, Hungama and Wynk new players such as Google Play, Amazon
and Reliance Jio have entered the market with even cheaper subscription models. In this
competitive industry, with similar song catalogues and genres available across all service
providers, platform loyalty plays a key role to improve monetization and retain
consumers.
Due to increasing competition, music streaming services are investing in creating a
platform that has exclusive content, non-music content and even selected video
catalogue. For instance, Saavn has ‘Originals’ with audio stories, podcasts and
commentaries while Gaana has ‘specials’, such as popular Radio Mirchi content, sit down
comedy and exclusive programs, and Hungama has an original audio series called ‘Mera
Wala Music’ that offers non-music stories.
42
MMA and GroupM Mobile Ecosystem Report, India 2016 | 43
KPMG and FICCI Media and Entertainment Report 2017
Mobile Marketing Ecosystem Report 2018, India. 43
Digital music industry ad revenues are expected to mirror the growth rates to be seen by
total digital ad revenues in India by 2020. The digital revenues would come majorly from
display ads followed by video and audio ads (that are planned on OTT platforms). At the
same time, the paid subscriber penetration among online music users is expected to
reach 10-15%44
. Contribution from digital music segment to overall Indian music industry
revenues is expected to grow from 55%44
in 2014 to 72% in 2017. Further, with that growth
digital music industry revenues including streaming, downloads, and other format
revenues and subscription and ad revenues are expected to cross INR 31 billion by 2020.
To differentiate themselves, music streaming services are leveraging digital technologies
such as analytics, machine learning and AI and investing on user experience,
customization services and new type of content. For example43
, Saavn has integrated a
social networking feature with its music streaming service which allows users to follow
the profiles and playlists of their friends as well as celebrities.
Gaana has launched a first of its kind Facebook messenger bot inside the Facebook
messenger application developed to provide streaming services to its users on Facebook.
Hungama is rewarding points though gamification to its users, which they can then
redeem to buy digital goods such as songs, music videos and movies.
This trend indicates that companies which had their primary focus on playlists and
acquisitions are now also investing to generate original content to differentiate
themselves and add monetization channels. The concept is similar to OTT video where in
to reach more SVOD like Netflix and Amazon Prime, even Audio OTT platform need to
create content that is different from their competitors.
OTT music contains 72% revenues of overall Indian music industry!
Here’s a look at the differentiated offerings of each music streaming apps:
44
KPMG and FICCI Media and Entertainment Report 2017
Mobile Marketing Ecosystem Report 2018, India. 44
Saavn
Pricing Bitrate Apps for Trial Period Offline/purchase Metable Features
`99 (Android)
`120 (iOS)
320kbps
Andriod iOS
Windows
1 month Yes / No
Collection of
Songs & Curation
User interfece,
Mirchi Radio
Marathon Playlists
& Collection
Video Streaming &
Download
International Collection
Yes / No
Yes / Yes
Yes / Yes
Yes / Yes (thru iTunes)
1 month
14 days
7 days
120 days
Andriod iOS
Windows
Andriod iOS
Windows
Andriod iOS
Andriod iOS
320kbps
320kbps
320kbps
320kbps
`99 (Plus)
`129 (Freedom)
`99 (99 items)
`99 (Unlimited)
`120 (individual)
`99 (Month)
`99Saans
Wynk
Hungama
Apple Music
Case Study for Audio OTT
Mobile Marketing Ecosystem Report 2018, India. 45
Part V: Mobile Ad Spends
Mobile continues to enable digital ad spend growth and increase its share of pie
significantly!
As consumers continue to spend more and more time on their smartphones, investments
towards digital are rising.
Millennials accounting for 30%46
of the Indian population and 72%47
of the Facebook user
base in India; are the key target audience among most marketers today. It is not only that
the millennials spend disproportionate time online, they are also very
engaged - 72%48
of Indian digital shoppers are millennials and consume more than 102
minutes5 of streaming entertainment (music + video) every day, making digital & mobile
a very significant part of an advertiser’s media mix.
The global growth of the media ad spends industry in 2017 was 3%47
, whereas India saw
a 13% growth in FY 2018. On the mobile marketing front, 70%45
of the Indian digital ad
spends goes on mobile.
45
GroupM TYNY India, December 2016 | 46
Census Calculation | 47
Facebook Ad Manager | 48
IAMAI and Kantar IMRB|
Mobile Marketing Ecosystem Report 2018, India. 46
% Share of media spends in India
45.64%
28.27%
15.49%
4.80%
0.75% 1.10%
3.95%
TV Radio Newspapers Magazines Cinema Outdoor and retail Digital
Source: GroupM TYNY Jun 2018
4G networks, cost effective data plans, smartphones has led to mobile becoming a
‘Torchbearer’ that is driving digital ad spend growth in India. This has shaped, Digital
equals Mobile to Mobile now greater than Digital, India’s has sprinted towards mobile
growth.
The near future will not only see growth of mobile marketing in India, but mobile will
enable growth of other mediums via Integrated Marketing as newer technologies grow.
Going forward mobile video, audio, and gaming industries will power mobile advertising
spends. However, IoT, AR/VR and AI will create newer channels to grow mobile in India
and give marketers new platforms to experiment.
Mobile Marketing Ecosystem Report 2018, India. 47
Digital vs Mobile ad spends in India (USD mn)
2018 (F)2017 (F)2016 (F)
1,095
644
1,424
996
Exchange rate used: USD 1 = INR 66.661
Source: GroupM estimates1,381
1,851
Digital Mobile
Overall Adex (in USDmn) and Adex growth (%)
0%0
100,000
200,000
300,000
400,000
500,000
600,000
Worldwide APAC China USA India
2%
4%
6%
8%
10%
12%
14%
2016 2017 2018 (F) 2018 vs 2018 (% growth)
Appendix
The changing definition of a feature phone!*
Historically, “feature phones tend to use a proprietary,
custom-designed software and user interface, and
lack the capabilities of smartphones.”The journey
started with Cell Phones, they were first
introduced in India in the early 1990s with basic
capabilities of calls and messages. Then came feature
phones which allowed the access of internet on
mobile devices with the help of telecom partners.
Almost, after 10 years from the advent of cell phones
and their adaptation to feature phones came
smartphones in the mid-2000s, where Ovi store from
Nokia led the path. Then, in the late 2000s and early
2010s, Android and iOS changed the game
completely with software that catered to third party
application downloads in the mobile device which
feature phones couldn’t.
In the last 4 to 5 years smartphones have become cheaper whilst providing
functionalities that a feature phones cannot, resulting in users switching to smartphones
for a better experience at a lower cost, as low as 3k. Cut to 2015, feature phones have all
functionalities included in them in under 2k. With Micromax and Karbonn leading the
feature phone boat, you now have extended memory options of feature phones, better
display, and faster processors. These extensions in the feature phone product portfolio
gave them a longer shelf life. People who aren’t much of app users and their mobile usage
is minimalistic would now prefer sticking to these advanced feature phones than to adopt
smartphones. This has led to the constant growth of feature phone shipments in India,
which many industry experts thought would die.
In a recent study by IDC* reports that one out of two feature phone users have strong
intent to buy a 4G feature phone in next 6 months. This clearly showcases how 4G feature
phones will take the mobile device market by storm and give smartphones a run for their
money.
*Reference to Page 5
Mobile Marketing Ecosystem Report 2018, India. 48
Mobile Marketing Ecosystem Report 2018, India. 50
2017 2018 2019 2020
0.6
1.1
1.6
2.4
76%
31%
Three out of four gamers indulge in playing games
on their mobile phone more than twice a day
gamers play
4-5 times in a day
of mobile gamers
like to play during
leisure time
44%
WHILE TRAVELLINGHOME
‘Free’ lures gamers
‘Free to play’ is the most popular gaming
model among gamers. Around 40% of
gamers are likely to pay for the games
at some stage of gaming
TYPE OF GAMES
DOWNLOADED
92%
28%
11%
(Free to play games)
(Freemium games)
(Pay to play games)
Female gamers – Mental Simulation games is a
winner across age groups
Female gamers across age groups are highly inclined towards playing puzzle / quiz and word games. Given the
multi-genre preferences, female in the age group of 20-34yrs are also like to play action / adventure and racing games.
15 - 19yrs
Puzzle / Quiz / word 70%
Male Gamers - shift in genre preferred as age increases
We observe a notable shift in the genre preferred among men as their age increases. Major proportion of younger
male gamers are inclined towards playing games which give them an ‘adrenaline rush’ , while preferences shift to
mental simulation games for men in the upper age group of above 35yrs. About a quarter of gamers above 25yrs
of age like to play casino / betting / card games.
Action / Adventure
Majority of the gamers spend
more than half an hour
playing mobile games
MOBILE
GAMING
IS AN
ENGAGING
MEDIUM
INDIA’S MOBILE GAMES
REVENUE IN USD (BILLION)
20 - 24yrs
87%
25 - 34yrs
86%
35+ yrs
80%
15 - 19yrs 20 - 24yrs 25 - 34yrs 35+ yrs
42%
COLLEGE
15%
WORK
14%86%
72% 72% 71% 52%
7%Less than
10 mins
25%
27%
26%
10 mins
to half an hr
0.5 hrs to 1 hr
1 to 2 hr
16%More than 2hrs
MOSTT - Marketing Organization
Structure Think Tank
Short statement
Rethinking the world of marketing organization structure.
Mission
Accelerate marketing performance and business growth through best in class
organizational design transformation.
Description
MOSTT is a community of marketing experts and professors committed to rethinking the
world of the modern marketing organization; seeking to guide marketers on real
innovation in marketing org design.
MOSTT goals:
1. To provide to customer-driven companies information about organizational mar
keting best practices and their potential for value.
2. To provide to CMOs information about marketing org trends, opportunities and
benchmarks in order to help them foresee the future and develop innovative
Marketing Org strategies.
3. To create a central source of all insights on marketing org in order to help
accelerate the transformation of modern marketing organizations.
4. To facilitate engagement and collaboration between marketing and HR leaders in
order to drive thought leadership.
MOSTT Projects
1. Mobile Analytics Real-Time Social (MARS) Study
The main objective of this project is to define how marketing organizations of
traditional brands need to adjust, adapt and organize in order to take advantage of
and continue to lead business growth in light of changes in marketing and
technology (e.g. new media and communication forms, platforms, etc...) - M.A.R.S.
2. Mobile Maturity
Through the Mobile Maturity project we aim to help CMOs understand and activate
the unique and specific role of mobile in creating and achieving greater overall
customer centricity.
Mobile Marketing Ecosystem Report 2018, India. 51
3. Center of Insights
We aim to provide marketers curated content on the topic of organizational
structure in our MOSTT Center of Insights.
MOSTT Governance
MMA's MOSTT team will be led by a Sterring Committee comprised of nine of the top
global brand marketing merketers.
Mobile Marketing Ecosystem Report 2018, India. 52
SAVE
Short statement
With the increased complexity of protecting a brand’s image and reputation from the rise
in threats from fake news, inappropriate content, marketing tech, the digital supply chain,
ad fraud and more, SAVE is here to help.
Mission
Participate on the future of the brand safety council and become a brand safe marketer.
What is SAVE?
SAVE is a marketer-led Future of Brand Safety Council created to ensure safeguards for
brands in all marketing environments. The Council will develop processes, programs,
benchmarks, and measures to protect your brand’s reputation and marketing investment.
SAVE Working Groups
Comprised of senior-level marketers from leading brands, our newly-formed SAVE Brand
Safety Working Groups are developing brand safety guidelines and best practices for
the industry. To learn about or join the working groups, click here.
Strategy Guide for Brand Safety Template Working Group
This Working Group is likely to develop a templated strategy document that can be used
by marketers to write their own Brand Safety strategy. This group will decide what areas
should be covered by a Brand Safety Strategy, standard definitions, what should be
addressed in each area, and best practices for a brand to become a Brand Safety Ninja.
The MMA SAVE Brand Safety Agenda will initially focus on the following four
guiding principles:
Creation of a
Marketer Brand
Safety Strategy
Guide
Assessment and
Benchmarking
of Brand Safety
issues by
marketers
Validation of Brand
Safety Partner
Selection and
Evaluation
Brand Safety
Education
Mobile Marketing Ecosystem Report 2018, India. 53
Brand Safety Insights and Research Working Group
This Working Group involves working with Andrew Stephen, Associate Dean of Research
and L'Oréal Professor of Marketing at University of Oxford, Said Business School, to
define what marketers need to know about Brand Safety and the benchmarks and
insights to guide individual company’s Brand Safety programs and decisions.
Brand Safety Vendor Assessments Working Group
There are a number of directions this Working Group could go in, including, but not
limited to, creating a map for all Brand Safety vendors and tools, developing an RFI for
picking vendors in the various areas and identifying selection strategies.
SAVE Leadership
SAVE is governed by:
SAVE Member Participants
The creation of SAVE aligns squarely with the MMA’s marketer-first mission with a focus
on solving the biggest marketing problems brands face in this new mobile-driven era
of dramatic changes in consumer behavior, technology innovations and market place
disruptions.
Mobile Marketing Ecosystem Report 2018, India. 54
Mobile Marketing Ecosystem Report 2018, India. 55
Brand Safety Issues are Not Going Away!
• 70% of Marketers State the Issue of Brand Safety is Escalating
• 48% of consumers said they would rethink purchasing or even boycott a brand if it
appeared next to content that offends or concerns them
• Hundreds of brands have recently been “tagged” in the press for running ads
aligned with controversial or “unsafe” content.
A rise in brand safety issues signals a potential nightmare for marketers.
And if ignored, brands can face serious backlash to your reputation, your customer
loyalty, your revenue, and eventually to your bottom line.
How Mobile Marketing Can Boost Brand Engagement
India has up to four times higher smartphone
audience compared to desktop today. This comes
as no surprise, due to the affordability of mobile
devices and increasing broadband coverage beyond
Tier 1 cities in recent years. With 337 million
smartphone users in India by the end of thisyear – a
growth of 16 percent since 2017 – the
opportunities for marketers in the mobile space are
vast.
As the only medium that allows a two-way interaction to happen in real time, the
opportunity for brand engagement is huge. Alongside the emergence of artificial
intelligence (AI) and machine learning, mobile has become a powerful device, bringing
the world to our fingertips. Here are a few ways new technologies in mobile can boost
engagement.
Tell it to the voice bot
With over half of global marketers already using AI capabilities to track and improve
users’ online journey, it is a powerful tool for increasing engagement. Combined with
mobile technology, AI allows marketers to deliver personalized messages that target cus-
tomers more effectively. Its ability to process information at high speeds also means that
the level of personalization is becoming more sophisticated each day, even predicting
what customers want before they know they want it.
Since Siri was introduced to iPhone users in 2011, having a virtual voice assistant has
become commonplace. The introduction of voice bots in recent years have also changed
the way people interact with technology, with a penetration of just 8 percent in 2017, to
an estimate of 39 percent by the end of this year in India alone.
Growing in popularity, brands should tap on the potential of voice bots, offering a level of
personalization that is unparalleled with any other form of advertising. Imagine a
consumer about to go on her first date that weekend asking Alexa (Amazon’s digital
assistant) what she should wear. Alexa then comes back with recommendations from her
favorite online stores, or stores along her daily commute, where she can pick up an outfit
on the way home from work. Walking home the next day, her mobile phone prompts her
to pick up the dress suggested by Alexa, and provides a discount code. Such technology
is already available; it is a matter of whether brands are quick enough to capitalize on it.
Mobile Marketing Ecosystem Report 2018, India. 56
Mobile attribution
Young people today are getting more and more impatient due to the immediacy that
technology provides. Integrating mobile into a brand’s multichannel marketing strategy
can engage users in ways that conventional marketing is unable to do. It allows for a
seamless experience across multiple touchpoints, so mobile users who previously
searched for a product on desktop would be prompted with an ad of the exact product
when on mobile, where they can continue on their purchase journey. For example, a
mobile phone user may see an ad while playing a game, but may not pay too much
attention to it. However, upon visiting another site, they are reminded of the same ad, and
after seeing it three times, they may search for it willingly. Mobile attribution would be
able to track the first ad of the product that user saw, to the point of purchase.
To effectively measure the impact of this multi-channel strategy, marketers are adopting
multi-touch attribution (MTA), which measures user data across channels, linking their
devices into a single point of reference. This allows brands to track the effectiveness of
mobile in their marketing process. For a more seamless measurement, the Mobile
Marketing Association (MMA), through its Marketing Attribution Think Tank (MATT) is
constantly working to identify best-in-class MTA solutions. This is done by developing a
more standardized way to measure MTA, so that marketers have opportunity to select
and apply MTA solutions with confidence.
Boosting ecommerce through value-added apps
Ecommerce sales in India is said to increase by 31% this year, reaching the US$32.7 billion
mark. This massive growth rate puts India as one of the top ecommerce markets in Asia.
Beyond non-perishables, marketers today are looking at expanding into food an
groceries. This means that buyers will make even more purchases via mobile through
repeat visits. The challenge then, is for brands to maintain customer loyalty. With a
quarter of India’s population becoming digital shoppers this year, investing in customer
loyalty would be seen as a wise move.
Globally, we see the growth of ecommerce reflected through brands like Instagram, which
is said to be working on a new app dedicated to shopping. As more local startups build
their businesses on social media platforms, the competition increases, and brands need
to look at creative ways to engage their customers. Providing value-added information
through mobile can build a closer customer relationship, and trigger a positive emotion
with the brand.
As an example, at the recent MMA Ideathon, one of the teams designed a language-based
application for people to get a better understanding of nutrition.
Mobile Marketing Ecosystem Report 2018, India. 57
Understand customer behavior
Mobile devices are also often the first and last devices people interact with, from the
moment they wake up to the time they go to bed. While it can be very tempting to keep
pushing information in front of mobile users to grab their attention, brands can run the
risk of spamming customers. Marketers need to know their target audience and when
they are most receptive if they want to remain on the right side of a very thin line between
helpful, and annoying.
A fairly new medium for marketers, much of mobile’s potential remains untapped, but
requires brands to first understand what they want to achieve. While mobile can boost
brand engagement, it will only work if organizations have a clear definition of success and
a proper strategy behind it.
Mobile Marketing Ecosystem Report 2018, India. 58
Smarties India 2018 Winners
Mobile Marketing Ecosystem Report 2018, India. 59
Brand Awareness Activating Infection Alert Unilever / Lifebuoy
Lead Generation / Direct Response / Conversion Smart Search Future Group / Big
Product/ Services Launch #1CroreChallenge Exide Life Insurance
Promotion When India Dared to Stare MTV / Roadies
Relationship Building/ CRM Castrol CRB Mini Truck Ka BP / Castrol CRB Plus
Socia Impact/ Not for Profit Powerless Queen Mahindra Rise / Project Nanhi Kali
Marketing Within a Mobile Gaming Environment
Messaging
Powerless Queen Mahindra Rise / Project Nanhi Kali
MFC Uses Green Sim Data Mahindra First
Mobile App Advertising Chug Chug on Chuk Chuk PepsiCo/ Pepsi
Mobile Social #JumpForHealth Aditya Birla Capital
Innovation When India Dared to Stare MTV - Roadies
Location Based services or Targeting Google Maps Weather Google / Google
Best Brand Experiences in Mobile Rich media When India Dared to Stare MTV - Roadies
1
2
3
4
5
6
7
8
9
10
11
12
13
14 Most Engaging Mobile Creative Beauty for All - Retail L'Oréal Paris / Infallible
Mindshare India
Mediacom
Autumn
Madison
Mindshare India
WATConsult
WATConsult
Isobar India
Mindshare India
Mindshare India
Madison
Toaster Ltd.
Madison
InMobi
Gold
1
1
1
1
1
1
1
1
1
1
1
1
1
1
MMA India 2018 - Awards List
S.No Category Entry Name Advertiser Brand Lead/Agency
Silver
1
1
1
1
1
1
1
1
1
1
1
1
1
1
1
1
2
3
4
5
6
7
8
9
10
11
12
13
14
15
1
S.No Category Entry Name Advertiser Brand Lead/Agency
Brand Awareness
Lead Generation / Direct Response / Conversion
Promotion
Socia Impact/ Not for Profit
Cross Media
Cross Mobile Integration
Marketing Within a Mobile Gaming Environment
Messaging
Mobile App Advertising
Programmatic
Mobile Social
Mobile Audio
Best Brand Experiences in Mobile Rich media
Most Engaging Mobile Creative
Rakhi with Fabelle
MFC Uses Green Sim Data Insights to Drive 8X Conversions
Godrej No. 1 Presenting Punjab di Beauty No. 1
Maiam Whistle
Activating Infection Alert System in Rural India
Entertainment Wish Karo, DishTV Karo
Sabse Smart Kaun
Patanjali - Motu Patlu
Activating Infection Alert System in Rural India
Godrej HIT Dengue Back
Transforming Pizza Hut Into a Delivery Business
The Story of a Night Napkin on Social Media
Saavn - Bira91: Hip Hop Association
Rakhi with Fabelle
When India Dared to Stare
ITC / Fabelle Elements
Mahindra First Choice / India Blue Book
Godrej Consumer Products / Godrej No.1
Makkal Needhi Maiam
Unilever / Lifebuoy
DishTV
Star Plus / Sabse Smart Kaun
Patanjali Ayurved / Patanjali Mango Juice
Unilever / Lifebuoy
Godrej Consumer Products / HIT
Yum! Brands / Pizza Hut
Energizer / Stayfree
B9 Beverages / Bira 91
ITC / Fabelle Elements
MTV - Roadies
Madison Communication Pvt. Ltd.
Isobar India
Mindshare India
Interaction One
Mindshare India
Affle
Mindshare India
Pokkt
Mindshare India
Interaction One
Mindshare India
Interactive Avenues Pvt. Ltd.
Saavn
Madison Communications Pvt. Ltd.
Bronze
1
1
1
1
1
1
1
1
1
1
1
1
1
1
2
3
4
5
6
7
8
9
10
11
12
13
S.No Category Entry Name Advertiser Brand Lead/Agency
Product/ Services Launch
Cross Media
Brand Awareness
Cross Mobile Integration
Messaging
Mobile App Advertising
Mobile Social
Innovation
Location Based services or Targeting
Mobile Audio
Mobile Audio
Best Brand Experiences in Mobile Rich media
Most Engaging Mobile Creative
BQ WhatsApp
How Star India Aced Primetime TV Battle : 550,000+
New Viewers Across Three Major Shows
How Google Maps Helped Consumers "Weather" the Monsoons
Giving India the Sound of Friendship
WhatsApping to Fitness - The Quaker Way
Share a Coke Integration with hello English, SHAREit,
Truecaller, Jio, Hotstar & Google Assistant
#NotShaadiMaterial
Google RailWifi : Leveraging MarTech to bring Wifi to the Masses
Maiam Whistle
How Horlicks Proved that Content Hits Home Only When Localized
Activating Infection Alert System in Rural India
Reebok - Floatride
Rakhi with Fabelle
Bloomberg | Quint
21st Century Fox / Star India
Google / Google Maps
Diageo India / McDowell’s No.1 Soda
PepsiCo / Quaker Oats
Coca-Cola India Pvt. Ltd / Coca-Cola
StarPlus / Ikyawaan #NotShaadiMaterial
RailTel
Makkal Needhi Maiam
Glaxo SmithKline Consumer
Healthcare India / Horlicks
Unilever / Lifebuoy
Reebok
ITC / Fabelle Elements
Quintillion Business Media Pvt. Ltd.
Zapr Media Labs
Essence
Mindshare India
Mindshare India
Interactive Avenues Pvt. Ltd.
Mindshare India
Essence
Interaction One
Mindshare India
Mindshare India
mCanvas Advertising Pvt. Ltd.
Madison Communications Pvt. Ltd.
Best in show - When India Dared to Stare Marketer of the Year -  MTV – Roadies
Publisher of The Year - Flipkart Internet Pvt Ltd
Agency of the Year - Mindshare India
MMA India Board
Mobile Marketing Ecosystem Report 2018, India. 60
VIKAS AGNIHOTRI
Director, India Sales
Google India
SAMEER SINGH
Chief Executive Officer - South Asia
GroupM Media India Pvt Ltd.
SANDEEP BHUSHAN
Director, South Asia
Facebook
D SHIVAKUMAR
Group Executive President
Corporate Strategy & Business Development
Aditya Birla Group
ROHIT DADWAL
Managing Director,
Mobile Marketing Association Asia
Pacific Limited
JULIE BRAMHAM
Chief Marketing Officer
Diageo (USL)
SUNIL KARTARIA
Chief Executive Officer - India &
SAARC
Godrej Consumer Products LTD.
(GCPL)
PRIYA NAIR
Executive Director, Home Care
Hindustan Unilever Limited
SAMEER PITALWALLA
Co-founder & CEO
Culture Machine Media Pvt. Ltd.
UDAY SODHI
Business Head Digital
Sony Pictures Networks India
Moneka Khurana
Country Head
MMA India
Nandini Dias
CEO
Lodestar UM
Shams Jasani
Group MD
Isobar South Asia
Siddharth Banerjee
Executive Vice President, Marketing
Vodafone India Ltd.
Partho Dasgupta
CEO
BARC India
SASHI SHANKAR
Chief Marketing Officer
Vodafone Idea Limited
VIJAY SHEKKAR SHARMA
Founder
One97 & Paytm
ANUSHKA SHETTY
CEO and Co Founder
Autumn Worldwide
PRASUN BASU
President, South Asia
Nielsen
VINODH BHAT
Co - founder, President & Chief
Strategy officer
Saavn
AJIT MOHAN
Chief Executive Officer,
Hotstar
HEMANT MEHTA
Managing Director, Media, Digital &
Retail, Kantar Imrb
Chief Strategy Officer, Kantar, South Asia
KARTHI MARSHAN
Senior Executive Vice President &
head, group marketing
kotak
Mma mobile ecosystem_report_2018

More Related Content

What's hot

Leveling up India's Gaming Market 2021
Leveling up India's Gaming Market 2021Leveling up India's Gaming Market 2021
Leveling up India's Gaming Market 2021RedSeer
 
Celebrity Brand Valuation Study by Duff & Phelps, A Kroll Business
Celebrity Brand Valuation Study by Duff & Phelps, A Kroll BusinessCelebrity Brand Valuation Study by Duff & Phelps, A Kroll Business
Celebrity Brand Valuation Study by Duff & Phelps, A Kroll BusinessSocial Samosa
 
Growth of gaming_industy_in_India
Growth of gaming_industy_in_IndiaGrowth of gaming_industy_in_India
Growth of gaming_industy_in_IndiaSusovita Subudhi
 
The Future Of Gaming Industry in India
The Future Of Gaming Industry in IndiaThe Future Of Gaming Industry in India
The Future Of Gaming Industry in Indiaknowafest.com
 
Unlocking indonesia's esports potentials 2021
Unlocking indonesia's esports potentials 2021Unlocking indonesia's esports potentials 2021
Unlocking indonesia's esports potentials 2021Ossy Indra Wardhani
 
Mini program games in China report by daxue consulting
Mini program games in China report by daxue consultingMini program games in China report by daxue consulting
Mini program games in China report by daxue consultingDaxue Consulting
 
Market Research India - Gaming Industry in India 2009
Market Research India - Gaming Industry in India 2009Market Research India - Gaming Industry in India 2009
Market Research India - Gaming Industry in India 2009Netscribes, Inc.
 
Real Money Gaming: India’s New Playground
Real Money Gaming: India’s New PlaygroundReal Money Gaming: India’s New Playground
Real Money Gaming: India’s New PlaygroundRedSeer
 
Asia Gaming spotlight indonesia-march-2020
Asia Gaming spotlight indonesia-march-2020Asia Gaming spotlight indonesia-march-2020
Asia Gaming spotlight indonesia-march-2020digitalinasia
 
Forbes digital gaming report_spring 2021_final
Forbes digital gaming report_spring 2021_finalForbes digital gaming report_spring 2021_final
Forbes digital gaming report_spring 2021_finalSara Cody
 
Dan e4m-digital-report-2019-c1
Dan e4m-digital-report-2019-c1Dan e4m-digital-report-2019-c1
Dan e4m-digital-report-2019-c1Social Samosa
 
Decoding the gaming audience
Decoding the gaming audienceDecoding the gaming audience
Decoding the gaming audienceFAS
 
Activate Technology & Media Outlook 2021
Activate Technology & Media Outlook 2021Activate Technology & Media Outlook 2021
Activate Technology & Media Outlook 2021Activate
 
Car buying landscape: the road ahead by Quora
Car buying landscape: the road ahead by QuoraCar buying landscape: the road ahead by Quora
Car buying landscape: the road ahead by QuoraSocial Samosa
 

What's hot (19)

Leveling up India's Gaming Market 2021
Leveling up India's Gaming Market 2021Leveling up India's Gaming Market 2021
Leveling up India's Gaming Market 2021
 
DMarket Whitepaper
DMarket WhitepaperDMarket Whitepaper
DMarket Whitepaper
 
Celebrity Brand Valuation Study by Duff & Phelps, A Kroll Business
Celebrity Brand Valuation Study by Duff & Phelps, A Kroll BusinessCelebrity Brand Valuation Study by Duff & Phelps, A Kroll Business
Celebrity Brand Valuation Study by Duff & Phelps, A Kroll Business
 
Kings Entertainment Investors Deck
Kings Entertainment Investors DeckKings Entertainment Investors Deck
Kings Entertainment Investors Deck
 
Growth of gaming_industy_in_India
Growth of gaming_industy_in_IndiaGrowth of gaming_industy_in_India
Growth of gaming_industy_in_India
 
The Future Of Gaming Industry in India
The Future Of Gaming Industry in IndiaThe Future Of Gaming Industry in India
The Future Of Gaming Industry in India
 
Global Digital Gaming Market (2018-2023)
Global Digital Gaming Market (2018-2023)Global Digital Gaming Market (2018-2023)
Global Digital Gaming Market (2018-2023)
 
Unlocking indonesia's esports potentials 2021
Unlocking indonesia's esports potentials 2021Unlocking indonesia's esports potentials 2021
Unlocking indonesia's esports potentials 2021
 
Gaming industry
Gaming industryGaming industry
Gaming industry
 
Mini program games in China report by daxue consulting
Mini program games in China report by daxue consultingMini program games in China report by daxue consulting
Mini program games in China report by daxue consulting
 
Market Research India - Gaming Industry in India 2009
Market Research India - Gaming Industry in India 2009Market Research India - Gaming Industry in India 2009
Market Research India - Gaming Industry in India 2009
 
Real Money Gaming: India’s New Playground
Real Money Gaming: India’s New PlaygroundReal Money Gaming: India’s New Playground
Real Money Gaming: India’s New Playground
 
Asia Gaming spotlight indonesia-march-2020
Asia Gaming spotlight indonesia-march-2020Asia Gaming spotlight indonesia-march-2020
Asia Gaming spotlight indonesia-march-2020
 
Gaming in India
Gaming in IndiaGaming in India
Gaming in India
 
Forbes digital gaming report_spring 2021_final
Forbes digital gaming report_spring 2021_finalForbes digital gaming report_spring 2021_final
Forbes digital gaming report_spring 2021_final
 
Dan e4m-digital-report-2019-c1
Dan e4m-digital-report-2019-c1Dan e4m-digital-report-2019-c1
Dan e4m-digital-report-2019-c1
 
Decoding the gaming audience
Decoding the gaming audienceDecoding the gaming audience
Decoding the gaming audience
 
Activate Technology & Media Outlook 2021
Activate Technology & Media Outlook 2021Activate Technology & Media Outlook 2021
Activate Technology & Media Outlook 2021
 
Car buying landscape: the road ahead by Quora
Car buying landscape: the road ahead by QuoraCar buying landscape: the road ahead by Quora
Car buying landscape: the road ahead by Quora
 

Similar to Mma mobile ecosystem_report_2018

Understanding internet industry in india
Understanding internet industry in indiaUnderstanding internet industry in india
Understanding internet industry in indiaadverteaze.com
 
The Effect on the Telecom Industry and Consumers after the Introduction of Re...
The Effect on the Telecom Industry and Consumers after the Introduction of Re...The Effect on the Telecom Industry and Consumers after the Introduction of Re...
The Effect on the Telecom Industry and Consumers after the Introduction of Re...Dr. Amarjeet Singh
 
Digital Opportunity - Indian Media & Entertainment 2017
Digital Opportunity - Indian Media & Entertainment 2017Digital Opportunity - Indian Media & Entertainment 2017
Digital Opportunity - Indian Media & Entertainment 2017Harsh Wardhan Dave
 
Future Of Indian Telecom
Future Of Indian TelecomFuture Of Indian Telecom
Future Of Indian Telecompurushothamks
 
The Future of Internet Content Consumption in India | Zinnov
The Future of Internet Content Consumption in India | Zinnov The Future of Internet Content Consumption in India | Zinnov
The Future of Internet Content Consumption in India | Zinnov Zinnov
 
Ericsson Mobility Report, June 2016 - Regional report India
Ericsson Mobility Report, June 2016 - Regional report IndiaEricsson Mobility Report, June 2016 - Regional report India
Ericsson Mobility Report, June 2016 - Regional report IndiaEricsson
 
A Critical Analysis Of Indian Smart Phone Industry
A Critical Analysis Of Indian Smart Phone IndustryA Critical Analysis Of Indian Smart Phone Industry
A Critical Analysis Of Indian Smart Phone IndustryAndrew Molina
 
Global Cellular Market trends and insight Q3/2016
Global Cellular Market trends and insight Q3/2016Global Cellular Market trends and insight Q3/2016
Global Cellular Market trends and insight Q3/2016Tuan Anh Nguyen
 
Jio as a game changer in Indian Telecom Service Industry_Manosij Raha
Jio as a game changer in Indian Telecom Service Industry_Manosij RahaJio as a game changer in Indian Telecom Service Industry_Manosij Raha
Jio as a game changer in Indian Telecom Service Industry_Manosij RahaManosij Raha
 
Summer Internship project by Kanhu Part-2.pdf
Summer Internship project by Kanhu Part-2.pdfSummer Internship project by Kanhu Part-2.pdf
Summer Internship project by Kanhu Part-2.pdfKanhu Charan Sahoo
 
Marketing Mobile Games and Apps in India
Marketing Mobile Games and Apps in IndiaMarketing Mobile Games and Apps in India
Marketing Mobile Games and Apps in IndiaBenjamin Cheeks
 
Jio review of literature
Jio review of literatureJio review of literature
Jio review of literatureNavin Rai
 
Vodafone value enabled services to business customers.
Vodafone value enabled services to business customers. Vodafone value enabled services to business customers.
Vodafone value enabled services to business customers. Paul Palathingal
 
Mobile broadband outlook_13_16_73
Mobile broadband outlook_13_16_73Mobile broadband outlook_13_16_73
Mobile broadband outlook_13_16_73domsr
 

Similar to Mma mobile ecosystem_report_2018 (20)

Understanding internet industry in india
Understanding internet industry in indiaUnderstanding internet industry in india
Understanding internet industry in india
 
The Effect on the Telecom Industry and Consumers after the Introduction of Re...
The Effect on the Telecom Industry and Consumers after the Introduction of Re...The Effect on the Telecom Industry and Consumers after the Introduction of Re...
The Effect on the Telecom Industry and Consumers after the Introduction of Re...
 
Digital Opportunity - Indian Media & Entertainment 2017
Digital Opportunity - Indian Media & Entertainment 2017Digital Opportunity - Indian Media & Entertainment 2017
Digital Opportunity - Indian Media & Entertainment 2017
 
Future Of Indian Telecom
Future Of Indian TelecomFuture Of Indian Telecom
Future Of Indian Telecom
 
The Future of Internet Content Consumption in India | Zinnov
The Future of Internet Content Consumption in India | Zinnov The Future of Internet Content Consumption in India | Zinnov
The Future of Internet Content Consumption in India | Zinnov
 
Ericsson Mobility Report, June 2016 - Regional report India
Ericsson Mobility Report, June 2016 - Regional report IndiaEricsson Mobility Report, June 2016 - Regional report India
Ericsson Mobility Report, June 2016 - Regional report India
 
A Critical Analysis Of Indian Smart Phone Industry
A Critical Analysis Of Indian Smart Phone IndustryA Critical Analysis Of Indian Smart Phone Industry
A Critical Analysis Of Indian Smart Phone Industry
 
Global Cellular Market trends and insight Q3/2016
Global Cellular Market trends and insight Q3/2016Global Cellular Market trends and insight Q3/2016
Global Cellular Market trends and insight Q3/2016
 
Jio as a game changer in Indian Telecom Service Industry_Manosij Raha
Jio as a game changer in Indian Telecom Service Industry_Manosij RahaJio as a game changer in Indian Telecom Service Industry_Manosij Raha
Jio as a game changer in Indian Telecom Service Industry_Manosij Raha
 
Demystifying digital
Demystifying digitalDemystifying digital
Demystifying digital
 
Ppt on Reliance jio
Ppt on Reliance jioPpt on Reliance jio
Ppt on Reliance jio
 
Summer Internship project by Kanhu Part-2.pdf
Summer Internship project by Kanhu Part-2.pdfSummer Internship project by Kanhu Part-2.pdf
Summer Internship project by Kanhu Part-2.pdf
 
Marketing Mobile Games and Apps in India
Marketing Mobile Games and Apps in IndiaMarketing Mobile Games and Apps in India
Marketing Mobile Games and Apps in India
 
Telecommunications Sector Report - December 2018
Telecommunications Sector Report - December 2018Telecommunications Sector Report - December 2018
Telecommunications Sector Report - December 2018
 
Jio review of literature
Jio review of literatureJio review of literature
Jio review of literature
 
Vodafone value enabled services to business customers.
Vodafone value enabled services to business customers. Vodafone value enabled services to business customers.
Vodafone value enabled services to business customers.
 
Telecommunications Sector Report - January 2019
Telecommunications Sector Report - January 2019Telecommunications Sector Report - January 2019
Telecommunications Sector Report - January 2019
 
Telecommunication 2
Telecommunication 2Telecommunication 2
Telecommunication 2
 
Telecommunications Sector Report - March 2019
Telecommunications Sector Report - March 2019Telecommunications Sector Report - March 2019
Telecommunications Sector Report - March 2019
 
Mobile broadband outlook_13_16_73
Mobile broadband outlook_13_16_73Mobile broadband outlook_13_16_73
Mobile broadband outlook_13_16_73
 

More from Social Samosa

TAM Sports_IPL 17 Till Match 37_Celebrity Endorsement _Report.pdf
TAM Sports_IPL 17 Till Match 37_Celebrity Endorsement _Report.pdfTAM Sports_IPL 17 Till Match 37_Celebrity Endorsement _Report.pdf
TAM Sports_IPL 17 Till Match 37_Celebrity Endorsement _Report.pdfSocial Samosa
 
Social Samosa Guidebook for SAMMIES 2024.pdf
Social Samosa Guidebook for SAMMIES 2024.pdfSocial Samosa Guidebook for SAMMIES 2024.pdf
Social Samosa Guidebook for SAMMIES 2024.pdfSocial Samosa
 
Kantar AI Summit- Under Embargo till Wednesday, 24th April 2024, 4 PM, IST.pdf
Kantar AI Summit- Under Embargo till Wednesday, 24th April 2024, 4 PM, IST.pdfKantar AI Summit- Under Embargo till Wednesday, 24th April 2024, 4 PM, IST.pdf
Kantar AI Summit- Under Embargo till Wednesday, 24th April 2024, 4 PM, IST.pdfSocial Samosa
 
TAM AdEx 2023 Cross Media Advertising Recap - Auto Sector
TAM AdEx 2023 Cross Media Advertising Recap - Auto SectorTAM AdEx 2023 Cross Media Advertising Recap - Auto Sector
TAM AdEx 2023 Cross Media Advertising Recap - Auto SectorSocial Samosa
 
TAM Sports IPL 17 Advertising Report- M01 - M23
TAM Sports IPL 17 Advertising Report- M01 - M23TAM Sports IPL 17 Advertising Report- M01 - M23
TAM Sports IPL 17 Advertising Report- M01 - M23Social Samosa
 
TAM Sports-IPL 17 Advertising Report- M01 - M15.xlsx - IPL 17 FCT (Commercial...
TAM Sports-IPL 17 Advertising Report- M01 - M15.xlsx - IPL 17 FCT (Commercial...TAM Sports-IPL 17 Advertising Report- M01 - M15.xlsx - IPL 17 FCT (Commercial...
TAM Sports-IPL 17 Advertising Report- M01 - M15.xlsx - IPL 17 FCT (Commercial...Social Samosa
 
TAM AdEx - 2023 Cross Media Advertising Recap - FMCG Sector.pdf
TAM AdEx - 2023 Cross Media Advertising Recap - FMCG Sector.pdfTAM AdEx - 2023 Cross Media Advertising Recap - FMCG Sector.pdf
TAM AdEx - 2023 Cross Media Advertising Recap - FMCG Sector.pdfSocial Samosa
 
TAM Sports-IPL 17 Advertising Report- M01 - M07.xlsx - IPL 17 FCT (Commercial...
TAM Sports-IPL 17 Advertising Report- M01 - M07.xlsx - IPL 17 FCT (Commercial...TAM Sports-IPL 17 Advertising Report- M01 - M07.xlsx - IPL 17 FCT (Commercial...
TAM Sports-IPL 17 Advertising Report- M01 - M07.xlsx - IPL 17 FCT (Commercial...Social Samosa
 
Media and Internet Preview Q4FY24 Elara C
Media and Internet Preview Q4FY24 Elara CMedia and Internet Preview Q4FY24 Elara C
Media and Internet Preview Q4FY24 Elara CSocial Samosa
 
LinkedIn-Deep-Sales-Playbook-Report-.pdf
LinkedIn-Deep-Sales-Playbook-Report-.pdfLinkedIn-Deep-Sales-Playbook-Report-.pdf
LinkedIn-Deep-Sales-Playbook-Report-.pdfSocial Samosa
 
Brand Trust Report 2024 TRA Report Listings
Brand Trust Report 2024 TRA Report ListingsBrand Trust Report 2024 TRA Report Listings
Brand Trust Report 2024 TRA Report ListingsSocial Samosa
 
TAM AdEx-A Pixelated view into Digital Advertising Trends for Y 2023.pdf
TAM AdEx-A Pixelated view into Digital Advertising Trends for Y 2023.pdfTAM AdEx-A Pixelated view into Digital Advertising Trends for Y 2023.pdf
TAM AdEx-A Pixelated view into Digital Advertising Trends for Y 2023.pdfSocial Samosa
 
Cricket Playbook for Growth Marketers: Adjust x Glance report
Cricket Playbook for Growth Marketers: Adjust x Glance reportCricket Playbook for Growth Marketers: Adjust x Glance report
Cricket Playbook for Growth Marketers: Adjust x Glance reportSocial Samosa
 
TheOrmaxSportsAudienceReport2024-MediaHighlights.pdf
TheOrmaxSportsAudienceReport2024-MediaHighlights.pdfTheOrmaxSportsAudienceReport2024-MediaHighlights.pdf
TheOrmaxSportsAudienceReport2024-MediaHighlights.pdfSocial Samosa
 
Voter engagement - Election iCubesWire Report
Voter engagement - Election iCubesWire ReportVoter engagement - Election iCubesWire Report
Voter engagement - Election iCubesWire ReportSocial Samosa
 
TAM AdEx report - Print Advertising 2023
TAM AdEx report - Print Advertising 2023TAM AdEx report - Print Advertising 2023
TAM AdEx report - Print Advertising 2023Social Samosa
 
D2C Advantage X Toolkit MMA Global & Publicis Commerce
D2C Advantage X Toolkit MMA Global & Publicis CommerceD2C Advantage X Toolkit MMA Global & Publicis Commerce
D2C Advantage X Toolkit MMA Global & Publicis CommerceSocial Samosa
 
Report on the future of Digital Advertising in India
Report on the future of Digital Advertising in IndiaReport on the future of Digital Advertising in India
Report on the future of Digital Advertising in IndiaSocial Samosa
 
Redseer_Ear-It-All_Report Design 2_16022024_final.pdf
Redseer_Ear-It-All_Report Design 2_16022024_final.pdfRedseer_Ear-It-All_Report Design 2_16022024_final.pdf
Redseer_Ear-It-All_Report Design 2_16022024_final.pdfSocial Samosa
 
Advertising in Music Genre 2023 - TAM AdEx
Advertising in Music Genre 2023 - TAM AdExAdvertising in Music Genre 2023 - TAM AdEx
Advertising in Music Genre 2023 - TAM AdExSocial Samosa
 

More from Social Samosa (20)

TAM Sports_IPL 17 Till Match 37_Celebrity Endorsement _Report.pdf
TAM Sports_IPL 17 Till Match 37_Celebrity Endorsement _Report.pdfTAM Sports_IPL 17 Till Match 37_Celebrity Endorsement _Report.pdf
TAM Sports_IPL 17 Till Match 37_Celebrity Endorsement _Report.pdf
 
Social Samosa Guidebook for SAMMIES 2024.pdf
Social Samosa Guidebook for SAMMIES 2024.pdfSocial Samosa Guidebook for SAMMIES 2024.pdf
Social Samosa Guidebook for SAMMIES 2024.pdf
 
Kantar AI Summit- Under Embargo till Wednesday, 24th April 2024, 4 PM, IST.pdf
Kantar AI Summit- Under Embargo till Wednesday, 24th April 2024, 4 PM, IST.pdfKantar AI Summit- Under Embargo till Wednesday, 24th April 2024, 4 PM, IST.pdf
Kantar AI Summit- Under Embargo till Wednesday, 24th April 2024, 4 PM, IST.pdf
 
TAM AdEx 2023 Cross Media Advertising Recap - Auto Sector
TAM AdEx 2023 Cross Media Advertising Recap - Auto SectorTAM AdEx 2023 Cross Media Advertising Recap - Auto Sector
TAM AdEx 2023 Cross Media Advertising Recap - Auto Sector
 
TAM Sports IPL 17 Advertising Report- M01 - M23
TAM Sports IPL 17 Advertising Report- M01 - M23TAM Sports IPL 17 Advertising Report- M01 - M23
TAM Sports IPL 17 Advertising Report- M01 - M23
 
TAM Sports-IPL 17 Advertising Report- M01 - M15.xlsx - IPL 17 FCT (Commercial...
TAM Sports-IPL 17 Advertising Report- M01 - M15.xlsx - IPL 17 FCT (Commercial...TAM Sports-IPL 17 Advertising Report- M01 - M15.xlsx - IPL 17 FCT (Commercial...
TAM Sports-IPL 17 Advertising Report- M01 - M15.xlsx - IPL 17 FCT (Commercial...
 
TAM AdEx - 2023 Cross Media Advertising Recap - FMCG Sector.pdf
TAM AdEx - 2023 Cross Media Advertising Recap - FMCG Sector.pdfTAM AdEx - 2023 Cross Media Advertising Recap - FMCG Sector.pdf
TAM AdEx - 2023 Cross Media Advertising Recap - FMCG Sector.pdf
 
TAM Sports-IPL 17 Advertising Report- M01 - M07.xlsx - IPL 17 FCT (Commercial...
TAM Sports-IPL 17 Advertising Report- M01 - M07.xlsx - IPL 17 FCT (Commercial...TAM Sports-IPL 17 Advertising Report- M01 - M07.xlsx - IPL 17 FCT (Commercial...
TAM Sports-IPL 17 Advertising Report- M01 - M07.xlsx - IPL 17 FCT (Commercial...
 
Media and Internet Preview Q4FY24 Elara C
Media and Internet Preview Q4FY24 Elara CMedia and Internet Preview Q4FY24 Elara C
Media and Internet Preview Q4FY24 Elara C
 
LinkedIn-Deep-Sales-Playbook-Report-.pdf
LinkedIn-Deep-Sales-Playbook-Report-.pdfLinkedIn-Deep-Sales-Playbook-Report-.pdf
LinkedIn-Deep-Sales-Playbook-Report-.pdf
 
Brand Trust Report 2024 TRA Report Listings
Brand Trust Report 2024 TRA Report ListingsBrand Trust Report 2024 TRA Report Listings
Brand Trust Report 2024 TRA Report Listings
 
TAM AdEx-A Pixelated view into Digital Advertising Trends for Y 2023.pdf
TAM AdEx-A Pixelated view into Digital Advertising Trends for Y 2023.pdfTAM AdEx-A Pixelated view into Digital Advertising Trends for Y 2023.pdf
TAM AdEx-A Pixelated view into Digital Advertising Trends for Y 2023.pdf
 
Cricket Playbook for Growth Marketers: Adjust x Glance report
Cricket Playbook for Growth Marketers: Adjust x Glance reportCricket Playbook for Growth Marketers: Adjust x Glance report
Cricket Playbook for Growth Marketers: Adjust x Glance report
 
TheOrmaxSportsAudienceReport2024-MediaHighlights.pdf
TheOrmaxSportsAudienceReport2024-MediaHighlights.pdfTheOrmaxSportsAudienceReport2024-MediaHighlights.pdf
TheOrmaxSportsAudienceReport2024-MediaHighlights.pdf
 
Voter engagement - Election iCubesWire Report
Voter engagement - Election iCubesWire ReportVoter engagement - Election iCubesWire Report
Voter engagement - Election iCubesWire Report
 
TAM AdEx report - Print Advertising 2023
TAM AdEx report - Print Advertising 2023TAM AdEx report - Print Advertising 2023
TAM AdEx report - Print Advertising 2023
 
D2C Advantage X Toolkit MMA Global & Publicis Commerce
D2C Advantage X Toolkit MMA Global & Publicis CommerceD2C Advantage X Toolkit MMA Global & Publicis Commerce
D2C Advantage X Toolkit MMA Global & Publicis Commerce
 
Report on the future of Digital Advertising in India
Report on the future of Digital Advertising in IndiaReport on the future of Digital Advertising in India
Report on the future of Digital Advertising in India
 
Redseer_Ear-It-All_Report Design 2_16022024_final.pdf
Redseer_Ear-It-All_Report Design 2_16022024_final.pdfRedseer_Ear-It-All_Report Design 2_16022024_final.pdf
Redseer_Ear-It-All_Report Design 2_16022024_final.pdf
 
Advertising in Music Genre 2023 - TAM AdEx
Advertising in Music Genre 2023 - TAM AdExAdvertising in Music Genre 2023 - TAM AdEx
Advertising in Music Genre 2023 - TAM AdEx
 

Recently uploaded

Model Call Girl in Shalimar Bagh Delhi reach out to us at 🔝8264348440🔝
Model Call Girl in Shalimar Bagh Delhi reach out to us at 🔝8264348440🔝Model Call Girl in Shalimar Bagh Delhi reach out to us at 🔝8264348440🔝
Model Call Girl in Shalimar Bagh Delhi reach out to us at 🔝8264348440🔝soniya singh
 
CALL ON ➥8923113531 🔝Call Girls Saharaganj Lucknow best sexual service
CALL ON ➥8923113531 🔝Call Girls Saharaganj Lucknow best sexual serviceCALL ON ➥8923113531 🔝Call Girls Saharaganj Lucknow best sexual service
CALL ON ➥8923113531 🔝Call Girls Saharaganj Lucknow best sexual serviceanilsa9823
 
Chandigarh Call Girls Service ❤️🍑 9115573837 👄🫦Independent Escort Service Cha...
Chandigarh Call Girls Service ❤️🍑 9115573837 👄🫦Independent Escort Service Cha...Chandigarh Call Girls Service ❤️🍑 9115573837 👄🫦Independent Escort Service Cha...
Chandigarh Call Girls Service ❤️🍑 9115573837 👄🫦Independent Escort Service Cha...Niamh verma
 
Call US Pooja 9892124323 ✓Call Girls In Mira Road ( Mumbai ) secure service,
Call US Pooja 9892124323 ✓Call Girls In Mira Road ( Mumbai ) secure service,Call US Pooja 9892124323 ✓Call Girls In Mira Road ( Mumbai ) secure service,
Call US Pooja 9892124323 ✓Call Girls In Mira Road ( Mumbai ) secure service,Pooja Nehwal
 
哪里有卖的《俄亥俄大学学历证书+俄亥俄大学文凭证书+俄亥俄大学学位证书》Q微信741003700《俄亥俄大学学位证书复制》办理俄亥俄大学毕业证成绩单|购买...
哪里有卖的《俄亥俄大学学历证书+俄亥俄大学文凭证书+俄亥俄大学学位证书》Q微信741003700《俄亥俄大学学位证书复制》办理俄亥俄大学毕业证成绩单|购买...哪里有卖的《俄亥俄大学学历证书+俄亥俄大学文凭证书+俄亥俄大学学位证书》Q微信741003700《俄亥俄大学学位证书复制》办理俄亥俄大学毕业证成绩单|购买...
哪里有卖的《俄亥俄大学学历证书+俄亥俄大学文凭证书+俄亥俄大学学位证书》Q微信741003700《俄亥俄大学学位证书复制》办理俄亥俄大学毕业证成绩单|购买...wyqazy
 
9892124323 | Book Call Girls in Juhu and escort services 24x7
9892124323 | Book Call Girls in Juhu and escort services 24x79892124323 | Book Call Girls in Juhu and escort services 24x7
9892124323 | Book Call Girls in Juhu and escort services 24x7Pooja Nehwal
 
CALL ON ➥8923113531 🔝Call Girls Gomti Nagar Lucknow best Night Fun service
CALL ON ➥8923113531 🔝Call Girls Gomti Nagar Lucknow best Night Fun serviceCALL ON ➥8923113531 🔝Call Girls Gomti Nagar Lucknow best Night Fun service
CALL ON ➥8923113531 🔝Call Girls Gomti Nagar Lucknow best Night Fun serviceanilsa9823
 

Recently uploaded (7)

Model Call Girl in Shalimar Bagh Delhi reach out to us at 🔝8264348440🔝
Model Call Girl in Shalimar Bagh Delhi reach out to us at 🔝8264348440🔝Model Call Girl in Shalimar Bagh Delhi reach out to us at 🔝8264348440🔝
Model Call Girl in Shalimar Bagh Delhi reach out to us at 🔝8264348440🔝
 
CALL ON ➥8923113531 🔝Call Girls Saharaganj Lucknow best sexual service
CALL ON ➥8923113531 🔝Call Girls Saharaganj Lucknow best sexual serviceCALL ON ➥8923113531 🔝Call Girls Saharaganj Lucknow best sexual service
CALL ON ➥8923113531 🔝Call Girls Saharaganj Lucknow best sexual service
 
Chandigarh Call Girls Service ❤️🍑 9115573837 👄🫦Independent Escort Service Cha...
Chandigarh Call Girls Service ❤️🍑 9115573837 👄🫦Independent Escort Service Cha...Chandigarh Call Girls Service ❤️🍑 9115573837 👄🫦Independent Escort Service Cha...
Chandigarh Call Girls Service ❤️🍑 9115573837 👄🫦Independent Escort Service Cha...
 
Call US Pooja 9892124323 ✓Call Girls In Mira Road ( Mumbai ) secure service,
Call US Pooja 9892124323 ✓Call Girls In Mira Road ( Mumbai ) secure service,Call US Pooja 9892124323 ✓Call Girls In Mira Road ( Mumbai ) secure service,
Call US Pooja 9892124323 ✓Call Girls In Mira Road ( Mumbai ) secure service,
 
哪里有卖的《俄亥俄大学学历证书+俄亥俄大学文凭证书+俄亥俄大学学位证书》Q微信741003700《俄亥俄大学学位证书复制》办理俄亥俄大学毕业证成绩单|购买...
哪里有卖的《俄亥俄大学学历证书+俄亥俄大学文凭证书+俄亥俄大学学位证书》Q微信741003700《俄亥俄大学学位证书复制》办理俄亥俄大学毕业证成绩单|购买...哪里有卖的《俄亥俄大学学历证书+俄亥俄大学文凭证书+俄亥俄大学学位证书》Q微信741003700《俄亥俄大学学位证书复制》办理俄亥俄大学毕业证成绩单|购买...
哪里有卖的《俄亥俄大学学历证书+俄亥俄大学文凭证书+俄亥俄大学学位证书》Q微信741003700《俄亥俄大学学位证书复制》办理俄亥俄大学毕业证成绩单|购买...
 
9892124323 | Book Call Girls in Juhu and escort services 24x7
9892124323 | Book Call Girls in Juhu and escort services 24x79892124323 | Book Call Girls in Juhu and escort services 24x7
9892124323 | Book Call Girls in Juhu and escort services 24x7
 
CALL ON ➥8923113531 🔝Call Girls Gomti Nagar Lucknow best Night Fun service
CALL ON ➥8923113531 🔝Call Girls Gomti Nagar Lucknow best Night Fun serviceCALL ON ➥8923113531 🔝Call Girls Gomti Nagar Lucknow best Night Fun service
CALL ON ➥8923113531 🔝Call Girls Gomti Nagar Lucknow best Night Fun service
 

Mma mobile ecosystem_report_2018

  • 2. Foreword Since the last time we saw you there have been dramatic shifts in multiple areas. Demonetization in India saw massive uptake on digitization of payments, and Trump took over the presidency in the US. In the same period, Reliance Jio changed the Telecom ecosystem in India by adding 200+ million new mobile subscribers, shaping it’s vision of “Internet for Every Indian”. We also saw 4G in India becoming mainstream, on both network and smartphone tech adoption, it completely dominated the market. 4G featurephone is an innovation that will take the India market by storm and will stay for long. Lower data cost caused massive growth in data consumption via mobile devices. Gaming, OTT Video and Digital Audio platforms became the flag bearers of increasing data traffic. India saw the launch of seven big OTT platforms in the last 2 years (namely Netflix, Amazon Prime, Hotstar, Voot, Zee5, Sony Liv and Wynk). With the growing OTT consumption and the need of vernacular content, we think in the next 5 years’ vernacular content users will grow 12X compared to 2X growth for English content consumers. Gaming is another category showing growth in India, as it caters to not only to seasoned gamers, but also casual gamers like kids on their parents phones. Also, by introducing relevant native ad formats like reward videos, gaming has become a top contender for marketers to spend on. In 2017, 70% of India’s digital advertising budget was spent on mobile, wherein traditional FMCG and BFSI brands also saw uptake in something as advanced as programmatic spend. In this report we give all marketers a quick peak on a basic guide on how programmatic works and its pros and cons, and its future evolution. With the second edition of the report, we bring you up-to date on the latest trends in data growth, content play, programmatic, device status; how India is moving towards a new era of mobile marketing, seeing rampant growth in both usage and spends. We hope you like our? efforts and do share your feedback on what you want in the next report. Happy Reading!
  • 3. Table of Content 1: Key Trends and Insights Page 01 2: Part I: Reach of Mobile among Consumers in India Page 03 3: Part II: Mobile Handset Ecosystem in India Page 10 4: Part III: Basics of Programmatic Advertising Page 15 5. Part IV: Key Verticals driving the Mobile Advertising Page 23 a) Gaming Page 23 b) Vernacular Page 27 c) OTT Video Page 32 d) OTT Audio Page 43 6: Part V: Mobile Ad Spends in India Page 46 7: Appendix Page 48 8: MOSTT - Marketing Organization Structire Think Tank Page 51 9: SAVE Page 53 10: How Mobile Marketing Can Boost Brand Engagement Page 56 11: Smarties India 2018 Winners Page 59 12: MMA India Board Page 60 13: Objective & Methodology of Research Page 61 Acknowledgement (About Researchers and Contributors) Page 62 Disclaimer
  • 4. Key Trends and Insights The Jio Brigade! Since its launch in August 2016, Jio added 200+ million users, representing 18% of the mobile subscribers market in India. Jio helped establish 4G in India making it affordable for people of all financial backgrounds. Competitive telecom brands had to decrease their data costs by 40% so that their current customers don’t opt for/get a MNP (Mobile Number Portability) to Jio. Being the first 4G network in India, Jio now holds 40% of the broadband traffic in India and it will keep on growing exponentially. 4G now holds approximately 82% of the data payload in the country! As 2G users decrease with every passing month, 3G and 4G will lead the mobile internet path till 2019 before we see the launch of 5G. Since the launch of 4G in late 2015, the total data payload grew 7.5x and 2.4x in 2016 and 2017 respectively. The 4G monthly data consumption is 3.8x greater than 3G data usage. 4G will lead the growth curve, although 3G will also continue to grow in the years to come. Compared to Urban India, Rural India is bringing three times more people online! India added 67 million mobile internet users in 2017,out of which 44 million were from Rural India. Rural India’s mobile internet users saw a 19% YoY growth, almost triple the 6% YOY growth Urban India. India will cross 500 million mobile internet users by the end of 2018, we foresee that this growth will be led by the rural populace. OTT platforms majorly engulf data traffic! OTT audio and video combined reach more than 200 million users in India. Video takes the largest share of the pie of content consumed on mobile internet, projecting a growth from 49% in 2016 to 75% in 2021. OTT players are creating original content and also including international content, which is helping them gain newer audiences and increase view time. Additionally, Indian YouTubers are creating great content that has also increased video viewing in India. Growing time spent on these platforms has also led to more advertising inventory. This also makes ads on video platforms more receptive due to its good content value. The OTT market will keep on growing as good content and good vernacular content is created for audiences from all regions. Mobile Marketing Ecosystem Report 2018, India. 01
  • 5. Mobile Gaming - the next big thing for Indian marketers! Why gaming you ask? Because 84% of mobile subscribers have games on their devices. Mobile gaming in India is high due to freemium games and free access and the segment will continue growing at the rate of CAGR 87% till 2020. Interestingly, this boom occurred with the help of female gamers who spent 70 mins a day playing games on their mobile devices. 34% of Indian mobile gamers make in-app purchases, mostly paved by card and strategy games. For marketers gaming is a platform which helps in reaching a varied audience, that aren’t accessible anywhere else. In the next 5 years Chat Application, Government Sites and Digital Payments will lead to more vernacular content consumers online! The Indian language internet users have grown from 42 million in 2011 to 234 million in 2016, a 4x growth, almost double from the 2x growth seen in the English language internet users. This has happened due to major online platforms like e-commerce and social media platforms launching their content in vernacular languages, reaching out to a much bigger and diverse Indian audience. It is anticipated that vernacular language users will increase 12 folds by 2021 and this will only be possible if OEMs create keyboards that are available in all languages, as currently 70% of vernacular content consumers find it tough to work with an English keyboard on their mobile device. The average monthly mobile spends reduce! The 4G data surge led people to use more data than voice. Furthermore, lower data package costs helped reduce mobile spends. This led to a 21% drop in ARPU (Average Revenue per User). We think in the coming years as more and more people use data to make calls, voice spends will decrease as will the average mobile spends. Featurephones are here to stay! Contradicting all predictions, featurephone* shipments remained higher than smart- phone shipments and they are equally an urban phenomenon as they are a rural one. With featurephones equipped with better quality cameras, more RAM and storage space at half the price of the smartphone, people prefer investing in them instead of a smartphone. Soon Jio and Micromax will be launching a 4G featurephone that will cost less than 2k. With these updates, featurephones are here to stay for the long term. *The definition of featurephone is given in detail in the appendix Mobile Marketing Ecosystem Report 2018, India. 02
  • 6. Part I: Reach of Mobile among consumers in India India ahead of China and expected to add over 200 Mn new subscribers by 2020 20%1 of the total mobile subscribers globally now reside in India. By 2020, 27% of new subscribers added globally will be from India - making India the largest contributor globally to the mobile economy, placing India significantly ahead of other emerging economies such as Indonesia and Brazil, who contribute to less than 5% of new subscriber growth. Since the advent of Reliance Jio, India had added over 3 times2 more subscribers compared to its subscriber growth since 2014. Subscriber growth came from both urban and rural markets - with 53 million rural and 79 million urban new mobile subscribers added during the period. and also onboarded new mobile subscribers and turned many existing subscribers into dual SIM users. In the last 2 years there is minimal decrease in the top three Telecom players in India. With the incoming of Jio, the top three Telecom players rarely saw major impact (downturn) on their numbers. Jio took it’s share from the parent company Reliance Reliance Jio gained a whopping 18% market share within 6 months of launch; the Top 3 telcos continued to grow too Mobile Marketing Ecosystem Report 2018, India. 03 Access service provider-wise market shares in term of wireless subscribers Bharti Airtel 30.5% Vodafone 19.7% Idea 18.9% Reliance Jio 18.2% BSNL 10.0% TATA 2.4% Mobile Subscribers in India ( in Millions) Rural 944 551 392 562 418 980 579 432 1013 588 447 1035 662 465 1127 680 506 1186 668 499 1167 629 506 1131 Urban Total Dec 2014 Dec 2015June 2015 June 2016 Dec 2016 June 2017 Dec 2017 May 2018 Global markets by additional subcribers, 2016 -2020 Percentage of new subscribers globally (Million) India China Brazil Nigeria Indonesia USA Pakistan Mexico Bangladesh Ethopia 27% 206 155 35 27 23 18 18 16 16 10 21% 5% 4% 3% 2% 2% 2% 2% 1% 1 GSMA report 2017 I 2 TRAI June 2018
  • 7. As anticipated, the Jio launch significantly changed the dynamics of the mobile consumer in India and made data ubiquitous, specifically proliferat- ing the rapid adoption of 4G data subscriptions. Since its inception in August 2016 Jio has added almost 200 million3 mobile Worldwide mobile internet users grew by 9.2%5 in 2017, while India grew at over double the rate at 22%. The pace of growth in mobile internet users puts India ahead of the other two major economies, China and the US, which saw a growth rate of 5.4% and 6.2% respectively. India’s growing millennial population and it being a developing country are the main reasons behind the mobile growth. This also creates many opportunities for Indian market- ers to explore mobile as a digital medium more extensively. There has been a rapid growth in the subscribers and all subscribers are data users, using an average of 1GB2 data every month. Jio users have been said to consume 100 Crore GB4 of data per month which is 50% more than China and almost equal to the mobile data consumed by the entire US. India continues to be the fastest growing mobile internet economy in the world number of mobile internet users, in the past 2 years. We have added almost 1506 million new mobile internet users (2015-2017) and expect it to increase significantly in 2018. By the mid of 2018 it is estimated that India will reach nearly half a billion mobile internet users. 3 TRAI Jan 2016/Jan 2017 | 4 http://telecom.economictimes.india- times.com/news/thanks-to-reliance-jio-india-becomes-top-mobile-data-user/57269548 | 5 eMarketer Estimates/IAMAI & Kantar IMRB Mobile Internet Report 2016 |6 IAMAI & Kantar IMRB Mobile Internet Report 2016 Mobile Marketing Ecosystem Report 2018, India. 04 June 2015 Dec 2015 June 2016 Dec 2016 June 2017 Dec 2017 May 2018 Telco wise subscribers ( in Millions) 230 162 172 176 190 196 196 214 205 160 123 81 33 0.18 72 99101109 185 193 199 204 212 212 222 243 255 Worldwide APAC 2016 2017 (E) 2018 (E) China India US Mobile Internet Users ( in Millions) URBAN VS RURAL MOBILE SUBSCRIBERS (IN MILLION) 265 280 290 308 2500 2730 3059 1348 1476 1740 604 637 728 373 456 478 210 223 232 2016 2017 June 2018 (E)2015 306 373 458 478 Total Urban Rural 219 226 280 291 87 147 176 187
  • 8. Mobile Marketing Ecosystem Report 2018, India. 05 The rise of several international and local OTT players in the video and music category (e.g. Netflix, Gaana, Wynk, Hotstar, Voot, Amazon Prime etc.) in 2016 gave an impetus for driving data consumption in the category, along with rapid drop in data tariffs for consumers. Urban India data spent on entertainment grew 58%7 YoY. Networking and Communication continue to be a key category among mobile internet users; Facebook user base increased by 22% YoY. Facebook in Q4 2016 saw double the growth compared to the same period in 2015. David Wehner, CFO, Facebook in an interview said the reason for this change was India giving free internet to their users (by the new entrant Jio). Comparing 2016 to 2017, 5 Telco circles showed almost double growth in Facebook user penetration10: Delhi (2016 – 19% vs 2017 – 35%), Bihar (2016 – 5% to 2017 – 11%), Kolkata (2016 – 25% vs 2017 – 45%), Maharashtra (2016 – 16% vs 2017 – 32%) and Assam (2016 – 13% vs 2017 – 22%). 61%6 of mobile internet users in India are still from urban India, compared to 39% of users from rural India. However, of the new users being added there has been a significant growth from rural users, adding 100 million mobile internet users since 2015, a CAGR (Compound Annual Growth Rate) of 29% . Growth in mobile internet subscribers, specifically urban India, brings data usage growth to newer areas beyond communication and social networking 7 IAMAI and Kantar IMRB Mobile Internet Report 2017 | 8 Facebook Ad Manager | 9 http://telecom.economictimes. indiatimes.com/news/reliance-jios-free-data-makes-big-contribution-to-facebook-revenue-growth-in-q4/56931784 | 10MMA and GroupM Mobile Ecosystem Report India 2016 / Facebook Ad Manager Purpose of Internet Access Urban vs Rural ( 2016 vs 2017) 2016 2017 2016 2017 Urban Rural 69% 68% 52% 85% 72% 82% 38% 34% 31% 60% 49% 58% Communication Social Networking Entertainment
  • 9. Source: Facebook Ad Manager (data as per June 2017) The Indian telecom market witnessed a paradigm shift in data consumption, with 4G traffic capturing 82% share of total data traffic in December 2017. 3G+4G contributed to 98%11 of the total data payload in 20176 with a 150% YOY increase. Since, the 4G launch in end of 2015, the 4G payload has grown 7.5x and 2.4x in 2016 and 2017 respectively. 4G data usage grew 144% in 2017! Mobile Marketing Ecosystem Report 2018, India. 06 Pan-India mobile data usage - in petabytes PB per month, December’ 2400 1900 900 300 200 100 0 Dec-13 Dec-14 Dec-15 Dec-16 Dec-17 3240 103 398823 2.4x 7.5x Payload 2G Payload 3G Payload 4G Total Payload 966 2,360 1,930 Y-o-Y Growth* 144% 135% 286% -20% 128 82 47 44 85 49 28 21 46
  • 10. 35% of the total 4G subscribers (approximately 1 out of 3 4G subscribers) came from rural territory. Jio is credited with bringing 4G to India but Jio also should be credited for the ramping up of the 4G network for incumbents like Airtel, Vodafone, and Idea. Consequently, while Jio, being the 4G lead operator with 160 million subscribers (by end 2017), increased 122% (88 million) subscribers in the year 2017; incumbent mobile operators grew 457% (64 million). Falling data prices, bundled data plans, better coverage footprint, off- load of 4G on to 3G, and better device availability have contributed to growth of 3G payload. 44% of the mobile internet users in India are 4G data users, out of which Between 2016 and 2022, total mobile data traffic is expected to grow CAGR 40%12 . By 2022, 97%12 of mobile data will be consumed by smartphones. Industry analysts predicted that 4G consumption will reach 11GB/month in 2022, however, this statistic was reached in 2017. 11 Nokia MBIT Report 2016 | 12 Ericsson Mobility Report – India, June 2017 Increase in 4G device penetration, aggressive 4G network rollout, lower data prices, and development of video and locally relevant content creators have all contributed to the rise of 4G traffic 80% are Jio users. Exponential increase in data traffic is accompanied by a significant increase in data consumption, with 4G usage reaching approx. 11GB/month 4G growth was led by Jio, but other Telcos benefitted as well! Mobile Marketing Ecosystem Report 2018, India. 07 Data subscribers by technology in december 2017 182 134 96 2G 3G 4G Average data usage/month (MB) 2G 3G 4G 11,048 10,604 2,970 2014 2015 2016 2017 216 680 220 753 849 259 320 3G-4G multiple 2017:3.6x
  • 11. Further analysis points that Jio added 26% rural subscribers using 4G, incumbents added 53% of their 4G subscribers to the rural market. By the end of 2018, its estimated that India will have 300 million 4G subscribers, of which 58 million will be using a 4G featurephone and the remaining 81% of subscribers will be using 4G over a Smartphone. Mobile Marketing Ecosystem Report 2018, India. 08 4G subscriber addition 2016 versus 2017 Urban versus Rural 4G subscriber addition 2017 Incumbents Jio Incumbents Jio 4G subscriber Dec 2018: 238Mn 78Mn 160Mn 4.6x 1.2x 0% 10% 20% 30% 2016 2017 40% 50% 60% 70% 80% 90% 100% 0% 20% 40% 60% Rural Urban 80% 100% 120% 140% 160% 180% 26% 74%
  • 12. It is quite evident that average mobile expenditure has been decreasing con- tinuously from 2014. Previously in the report we have learnt that this decrease is due to increased affordability of mobile data, which decreased from 2014 to 2016, with a marginal rise in 2017 owing to higher usage of mobile data. Expenditure on Voice has been steadily Since, last year we have seen a drastic drop in ARPU across all age groups, other than the <15 year group. The >45 year group , which was one of the most prolific user of voice services last year witnessed a significant drop. Much of this drop can be attributed to changes in mobile plans offered by service pro- viders, which are more data centric with very low costs for voice packages. Data decreasing (at a CAGR of -32%) since 2013; and with the popularity of VOIP and video chatting, the expenditure on voice services has decreased dramatically in recent times. spend by the >45 year group has decreased given lower price of data packs and overall usage saturation of the age group. Older generation in India gets hooked to data usage, as voice ARPU decreases as low as Rs.45 monthly! 11 Nokia MBIT Report 2016 |13 IAMAI and Kantar IMRB Mobile Internet Report 2016 Mobile Marketing Ecosystem Report 2018, India. 09 Average Mobile bill per month ( in INR) 275 349369 439 387 214 173 235 231 225 230 45 2017201620152014 Total Voice Data 2013 124129204 210 239 235 275 183 225 247 268 220 48 31 51 54 48 >45yrs35-44yrs25-34yrs15-24yrs<15yrs 2017 >45yrs35-44yrs25-34yrs15-24yrs<15yrs 2016 Data Voice Total 277 119 142 29 104 Mobile Bill: Agewise 166 195 314 358 377 552 231 256 298 322 268
  • 13. India offers a huge untapped opportuni- ty to the smartphone vendors, which is evident from the entry of several new smartphone vendors in the Indian market in last 2 years, a key driver to the smartphone growth. All this while, fea- ture phones remain the dominant cate- gory in the overall mobile phone market accounting for 52%13 of the total mobile The concept of the 4G feature phone is relatively new for the Indian market. It is expected to add more users to internet services, digital content consumption and digital transactions from their mobile phones. Data prices are at an all-time low and operators are working on strengthening their 4G connectivity in India. Reliance Jio is expected to introduce attractive bundling offers to proliferate rural and lower tier customers. With the experience of minimal data on the 4G feature phones, these users are expected to migrate to smartphones in next few years becoming the major smartphone growth drivers in the Indian market. phone shipments in India in Q1 2017 and constituting more than 50%14 of the overall mobile market in 2016. 2016 saw the feature phone de-growth slowing down and it is likely to contribute the majority of the mobile phone shipments in 2017 as well, as the migration to smartphones is expected to further slow down due to the introduction of low-cost 4G feature phones and its continued relevance to its sizeable target consumer. According to a study by the MMA and Kantar IMRB, contrary to popular belief, featurephone users spend more money on their mobile plans. The ARPU for the survey respondents was almost 20% higher compared to the national average. The survey also revealed that feature phones are entertainment hubs - with respondents listening to music, watching videos and playing games being key activities. Additionally, only 15% India sees the emergence of new category of handsets - 4G Feature phones! Feature phones get an extended life; another year before smartphones overtake feature phones in India Part II: Mobile Handset Ecosystem in India *https://telecom.economictimes.indiatimes.com/news/one-out-of-two-feature-phone-users-wish-to-buy-4g-feature -phone-in-next-6-months-idc/62755518 Mobile Marketing Ecosystem Report 2018, India. 10 Shipments growth status 2014 - 2020 (F) (Numbers in millions) Source: IDC June 2017 53.8 85.9 117.9 136 185 160.1 137.2 116.7 109.1 2017 (f) 2018 (f) 2019 (f) 2020 (f)2015 20152014 Feature Phone Smart Phone 103.7 80.5 136.1 150.3 179.3
  • 14. smartphone shipments have steadily risen by 35% in the last 3 years and forecasted to grow by another 49% by 2020 reaching 185 million by 2020. Also, expected that by the end of 2017, 95% of the smartphone shipments are 4G smartphones, drastically reducing the 3G smartphone share. of featurephone users said they intended to switch to a smartphone on their next purchase. Cashing in on this continued interest for feature phones, Reliance Jio in June 2017 declared16 to launch their 4G feature phones for as low as USD28 (INR 1800). Micromax and Lava are also in this race and will be launching their 4G featurephones in the same price bracket. At a time when other major smartphone markets like China, USA are seeing single digit growth, the Indian smartphone market is expected to grow in double digits during next five years. Thus, India provides a huge opportunity for smartphone vendors to set up and expand their base. The entry of Reliance Jio in the telecom services market has disrupted the incumbents dramatically. However, it proved immensely beneficial for consumers. The smartphone market has swiftly shifted to 4G, voice and data have become more affordable and new use cases have been developed to drive migration to smartphones. This graph shows, 42%17 of the smartphone market lies below US$100. The premium segment market is also bigger than some of the more mature markets like Hong Kong, Taiwan and Singapore. This provides a wide spectrum of opportunities for vendors to pick and choose the consumer segments and price categories to focus upon. As per the analysis by eMarketer (August 2018), India now has 337 million smartphones, making it the second largest user base in the world, ahead of the USA and only behind China. Smartphone market has swiftly shifted to 4G 13 IDC June 2017 | 14 IDC June 2017 |15 MMA and Kantar IMRB Feature phone report India (Q4 2016) (among a sample size of ~1000 consumers (feature phone users) in Metro and Non metro cities)| 16 http://indianexpress.com/article/ technology/mobile-tabs/reliance-jios-4g-volte-enabled-feature-phones-to-launch-soon-report/ Mobile Marketing Ecosystem Report 2018, India. 11 Generation wise smartphone shipments (In millions) Source: IDC May 2017 54.3 2014 2015 2016 2017(F) 2018(F) 2019(F) 2020(F) 63.9 30.5 3.7 9.3 2.3 0.1 5.3 3.5 2.9 2.6 28.6 78.3 2.5G 3G 4G 111.3 133.8 157.2 182.4 22.4
  • 15. Q4 2017 saw many changes in-terms of Handset shipments; it saw the maximum growth compared to the same time in the last 3 years. Additionally, Xiaomi threw Samsung from the reigning smartphone in India and became the leader in shipments in Q4 2017. The sales that were led by Xiaomi were China based vendors like Xiaomi, Vivo, Oppo, Transsion now account for almost a 50%18 share of the smartphone market in India. They have been able to achieve this on the back of their hi decibel ATL and clever BTL marketing spends, perceived better specifications – price value, wide & deep retail level distribution and online exclusive models. India based vendors were slow to react to the market shift to 4G Smartphones and combined with intense competition from China based vendors, Indian brands faced challenges in 2016-17 in the smartphone market. primarily replacements and upgrades where users shunned their existing Smartphones. In Q1 201818 , Transsion made its debut in the top 5 handset manufacturers in India with more than a three fold annual growth. The China based group has 4 brands under its umbrella (namely - Itel, Tecno, Infinix and Spice). With its primary focus on offline chan- nels, Itel and Tecno branded phones are doing well in the highly price sensitive India market. Xiaomi is changing the fabrication of the Indians smartphone industry China based mobile phone vendors have successfully made inroads in the market via both online and offline channels. LOVE (Lenovo. Oppo, Vivo, Xiaomi) v/s MILK (Micromax, China based smartphones are growing as Indian manufacturers struggle to become 4G first! 18 IDC May 2017 / IDC Q1 2018 Mobile Marketing Ecosystem Report 2018, India. 12 26% 25% 30% 7% 7% 5% Handset brand manufacture’s market share in India (Q1 2018) Xiaomi Samsung Oppo Vivo Trannssion Others
  • 16. Intex, Lava, Karbonn)19 as popularly referenced for Chinese Vs Indian brands. Overall LOVE brands have been mono-channel brands, offering great value for money with aggressive marketing. The success in the transition to Omni-channel would be a key factor for them to maintain their standing in the market with internal competition intensifying. At the same time, what Oppo did a couple of years ago , has been recently replicated by Vivo considerably and such marketing strategies have had a direct bearing on the market standings. The biggest challenge for LOVE brands would be to sustain such a campaign through all the quarters and at the same time, not enter each other's ’ territories resulting in internal competition. Initially affecting the Indian brands’ market share, they now begin to enter into each other’s market share. Quarter on quarter we are witnessing the MILK (Micromax-Intex-Lava-Karbonn) brands not being able to leverage any of the anchors they enjoyed over the years. Be it establishing themselves across the country or becoming the first choice for first time mobile (Feature as well as Smart) users, the brands have not been able to support a consumer’s journey. While they could not have matching marketing campaigns as their Chinese counterparts and preferred to ‘wait’ till they (India) burnt their money, their grip on the market became weak impacting their market standings. The success of itel and Xiaomi brands, which are not aggressively marketing by spending crores, are case studies for MILK brands to take cues from on how to manage visibility. It is high time for MILK brands to strengthen their digital presence, not only from the selling perspective but also from the angle of influencing youth, which directly or indirectly, are responsible for two out of three Smartphone sales in India. ‘Make in India’ has provided the right impetus to the mobile manufacturing in the country. Approximately, 65%19 of phones sold in India are assembled in India, in 2017, the share would touch 90%. India is fast emerging as the new manufacturing hub for the Mobile Phones and components with 40 brands already manufacturing in India, made possible Mobile Marketing Ecosystem Report 2018, India. 13 Leading smartphone OEMs by price brand Below 4K Intex Technologies 4K - 8K Samsung India Electronics 8K- 10K Vivo Mobile India 15K- 20K Samsung India Electronics 10K- 15K Rising Star Mobile India Above 20K Hong Fu Jin Precision Electronics 01 02 03 04 05 06
  • 17. by relatively lower labor costs, government push and incentives for local manufacturing coupled with high differential duties on import . In the next few years, Indian vendors are expected to start exporting devices to South-East Asia and African countries from their manufacturing operations. Android in the last 2 years has been able to maintain its kingship in the OS market in India, with average of 96%21 market share. What is interesting is that iOS sees a jump in Q4 every year and has managed to slightly increase its market share in the past year. Android continues to be the most preferred OS choice of India iPhone may be less than 3%21 of the smartphone market in India, but it is expected to reach a 10mn active user base in India in 2018 (it stands at 8.9 mn active users as of December 2017). Though, there are already many OEM brands that have surpassed this milestone like Samsung who has 120 mn and Xiaomi who has 28 mn active users as of end 2017; Apple has done exceptionally well in a price sensitive market like India where 56% of the Smartphones sold are still sub Rs. 10,000. 21 IDC June 2017 |21 http://www.cxotoday.com/story/smarphone-sales-hit-due-to-demonetization-idc/ / CMR Research Apple, though slowly, is growing in India! Mobile Marketing Ecosystem Report 2018, India. 14 Smartphone OS Share 2017 01 2016 04 2016 03 2016 02 2016 01 2015 04 2015 03 2015 02 2015 01 86% 88% 90% Android iOS Tizen Windows Phone 92% 94% 96% 98% 100% Source: IDC June 2017 2.2% 1.2% 1.3% 3.3% 1.5% 0.3%97% 97% 97% 97% 97% 0.9% 0.6% 1.34% 95% 3.2% 1.2% 0.66% 95% 2.2% 2.5% 0.5% 0.5% 0.03% 0.22% 94% 94% 1.7% 2.3% 4.28% 1.8% 1.1% 3.01%
  • 18. The advertising industry is on a march toward automation. Plenty of advertisers today are buying digital ads without speaking to a single human at a media company, and print and TV ads might not be far behind. Automated, or programmatic, buying is growing not only because it makes ad transactions more efficient but because it can make them more effective, as long as the right data is applied. Programmatic is no longer a buzzword, many agencies, and evolved advertisers (including e-commerce, auto and FMCG) have dabbled (read budget) on DSP platforms and retargeting platforms. A pure programmatic buy would help a marketer to cap the frequency of exposure of their campaign across publishers and let them transparently manage the media buys across a list of publishers. Layer this with data and they have created an audience buying campaign which, can also be used for retargeting to an audience set. growing in India, big and traditional business players like Pepsi, Ford and L’Oréal have shifted over 50% of their digital budgets to programmatic advertising. In this section we talk about the basics of ad serving, at what level programmatic comes into the picture, effectiveness of programmatic for stakeholders, the current state of programmatic in India as well as case studies of brands on the frontline of programmatic. India is still in nascent stages of programmatic adoption relative to more digitally mature Asia-Pacific markets like Australia and Japan. According to a Forrester Study, programmatic buying adoption for India is at 38% compared to the overall APAC adoption rate of 41% . That said, adoption is poised to pick up in the next 24 months as 52% of marketers in India are either planning to adopt or currently evaluating whether to adopt programmatic buying. Also, in India maximum programmatic spends (92%) on mobile are done on mobile app inventory. Part III: Programmatic Ecosystem in India Even though programmatic is still Mobile Marketing Ecosystem Report 2018, India. 15
  • 19. While India is still in the early stage of adoption compared to digitally mature Asia-Pacific markets like Australia and Japan, it has quickly ramped up the programmatic space. According to a recent study, India ranks near the top globally in terms of growth for programmatic ad spending1 . India is in the state of Programmatic evolution, saw 81% growth in 2017 Switzerland India Finland Australia Italy China Sweden Spain Germany Japan Russia France US Denmark Canada UK $46.00 $116.20 $43.60 $508.70 $297.70 $3,854.30 $168.80 $197.10 $631.90 $1,981.70 $119.20 $649.80 $24,224.00 $218.80 $878.70 $3,697.80 $100.80 119.00% $227.70 126.00% $210.60 81.30% $371.70 76.40% $95.20 118.30% $149.80 57.40% $776.40 52.60% $1,213.40 56.30% $412.00 38.40% $587.50 42.60% $6,038.20 56.70% $8,526.70 41.20% $338.60 100.50% $456.20 34.70% $263.90 33.90% $348.00 31.90% $853.30 35.00% $1.082.8 26.90% $2,703.90 36.40% $3,390.40 25.40% $159.10 33.50% $197.90 24.40% $821.30 26.40% $1,011.60 23.20% $30,928.30 27.70% $38.035.6 23.00% $294.80 34.80% $360.20 22.20% $1,094.40 24.50% $1,324.00 21.00% $4,436.90 20.00% $5,259.80 18.50% 2016 2017 % change 2018 % change Mobile Marketing Ecosystem Report 2018, India. 16 Source: Onaudience.com, "Global Data Market Size 2016-2018," Feb 19, 2018 Netherlands New Zealand Worldwide $425.80 $643.30 51.10% $717.80 11.60% $26.30 $30.40 15.40% $33.60 10.70% $40,915.30 $54,470.80 33.10% $69,513.50 27.60%
  • 20. An interesting point specifically for programmatic in India is its propensity towards guaranteed buys. It is poised to be one of the top markets for programmatic guaranteed - with penetration projected to reach 17% in 2020 based on a Boston Consulting Group study, on par with that of Australia or China. This may be due to prominent publishers who are driving uptake of programmatic buys and a concern with ad fraud, which drives spend from direct traditional buys to programmatic guaranteed. This is a promising trend, given how India has had most of ad spends in direct budgets. Source: Boston Consulting Group, 2018 https://www.bcg.com/publications/2018/rise-programmatic-guaranteed-advertising-asia-pacific.aspx India at power with China in terms of Programmatic Guarantee buys Mobile Marketing Ecosystem Report 2018, India. 17
  • 21. Currently, marketers in India tend to approach programmatic as a direct response driver, accessing mostly remnant long-tail inventory. As marketers grow more savvy, they will understand its value for brand campaigns with the ability to purchase premium audiences and inventory. Likewise for publishers, while there has been encouraging movement by publishers to offer access to more of their inventory via programmatic (e.g. TrueCaller with roadblock inventory and Saavn with audio inventory ), there are still legacy publishers who view programmatic primarily as a means to move cheap or unsold inventory. The trend towards transacting more premium inventory via programmatic is expected to accelerate programmatic adoption within the market, with prominent advertisers such as Ford India transiting majority of direct deals to transact programmatically . Programmatic allows publishers to maximize their earnings from their inventory by: https://www.thinkwithgoogle.com/intl/en-apac/tools-research/- programmatic/about-time-consolidate-ad-buys-get-more-from-teams-media/ http://www.forbesindia.com/article/special/saavn-launches-pro- grammatic-audio-advertising-in-india/45717/1 https://www.thinkwithgoogle.com/intl/en-apac/tools-research/- programmatic/about-time-consolidate-ad-buys-get-more-from-teams-media/ Identifying and selling each impression uniquely as compared to a block of impressions. This allows each impression to be sold at the maximum value, in turn maximizing the yield of overall inventory increasing the value of the remnant inventory, as each impression is sold for the value of the visitor as against the time slot / placement. Suddenly the impressions which were difficult to sell start looking premium to advertisers as they are targeting visitors helping publishers to control the pricing for their inventory using business rules, allowing them to offer differential and / or premium pricing based on the requirements and niche audience also helping publishers to gauge what is selling on a real time basis, which segment of users is getting higher value and what content are these users consuming on their sites. Thus allowing them to improvise and tweak their publishing strategies based on demand creating private marketplaces which can help a publisher create an exclusive club of bidding advertisers and to be a part of this club, advertisers can be pushed to spend either a minimum threshold or an over premium floor price Why programmatic for publishers? Mobile Marketing Ecosystem Report 2018, India. 18
  • 22. Programmatic buying is nothing but an efficient method of buying from an advertiser’s perspective. It reduces the need for manual operations across the board and hence helps in reducing the related cost Why programmatic for advertisers? Allows the advertiser to buy only the relevant inventory, by giving them an opportunity to evaluate each impression before making a buying decision (read audience buying) across publishers. It also helps them to cap the number of Mobile Marketing Ecosystem Report 2018, India. 19
  • 23. exposures of a campaign to each user across publishers, further increasing the reach of a campaign within the same budget It also allows a unique window for a advertiser/publisher to look into the audience and content profile to which their campaign is getting exposed, enabling them to understand the segments and content which are converting, even better With programmatic method, it is easier to optimise a campaign based on conversion and viewable impression data. However, the auto optimizations are done through platforms with integrated machine learning algorithms and is not available across the DSPs Agencies have been asked this question several times and it is hard for the agency to differentiate its value in an open exchange buying method. However, the might of an agency is highlighted in the programmatic direct and programmatic guaranteed models. With programmatic guaranteed and programmatic direct, agencies can influence the buying price towards the lower end of the spectrum (read floor price) which is beneficial for the advertisers and at the same time can allocate a larger chunk of spends towards deserving publishers Agencies are also benefited by the transparency layer available within the programmatic buying platforms and the granular level data, helping them to analyze and optimise their buys Programmatic / automation reduces the operational flak from the system e.g. it’s faster to take the campaign live, real time reports etc Why programmatic for agencies? Whenever a publisher’s ad server would receive an ad request, it would start calling a predefined list of ad networks, SSPs for filling in the inventory. The list is prioritized by the publisher, either manually or dynamically, based on the yield (return) being generated by each respective network for relevant campaigns. The first network/SSP in the hierarchy to respond with a bid (highest within that SSPs environment) which is higher than the floor price is accepted as the winning bid. This is called as waterfall model. Types of Bidding – Waterfall model Mobile Marketing Ecosystem Report 2018, India. 20
  • 24. Types of Bidding – Header bidding (the publisher side optimization) The limitation of the waterfall model is that there is a missed opportunity in accepting the first acceptable bid. The networks lower in the funnel of the waterfall model end up evaluating only impressions which have not already been bought and cannot see impressions for which they were willing to pay higher money but being lower in the funnel could not evaluate. Hence loss of an earning potential for the publishers. To overcome this problem of the waterfall model, the header bidding was introduced. The header bidding script, once integrated in the publisher inventory, contains all the relevant information of each ad unit on the page. As soon as the page starts loading on the user's Mobile Marketing Ecosystem Report 2018, India. 21 The waterfall model for programmatic buy Typical Publisher Premium Direct Premium Programmatic Open Programmatic Standard Direct Sponsorship Custom Executions High CPMYield Direct Demand Non Standard HighVolume Guaranteed Delivery Prioritized Remnant Repackaged Media Undifferentiated Media Demand-Supply imbalance ContextTargeting AudienceTargeting ROS & RON PMP SSP Ad Nets Technology High HighLow Low Price Priority Predictability Targeting Efficiency Accessibility Direct RTB Automated Semi - Automated Manual Workflow Programatic Direct Direct Orders Programmatic Orders Preferred Deals Deal ID Private Auctions Open Auctions
  • 25. browser, the header bidding scripts present in the header of the page starts an auction and fires request to all the exchanges simultaneously. This allows a publisher to add more bidders to the auction of the inventory, increasing the chances of getting higher fill rates and better pricing. This is also important for advertisers, as it allows networks and exchanges to have ‘first lookup’ of each impressions allowing the opportunity to be able to bid for the relevant impressions. There is general optimism around programmatic adoption and maturation in India, affirmed by encouraging results from both the demand and supply side as publishers offer more sophisticated and premium ad buys while advertisers move more spend towards programmatic. However, there are still obstructions to overcome for mainstream programmatic adoption such as the prevalence of direct deals in the market and the perception of programmatic inventory as the channel reserved for transacting low-value inventory. There is also demand to harness richer data/audience segments by publishers to bring more value for advertisers, something which is not yet the norm in the India market. Future trends and challenges for programmatic in India 6 https://assets.kpmg.com/content/dam/kpmg/in/pdf/2017/01/Digital-the-new-normal-marketing.pdf | 7 https://www.thedrum.com/news/2017/07/25/programmatic-moving-beyond-the-buzzword-india-buy- and-sell-side-adoption-matures | 8 http://www.forbesindia.com/article/special/saavn-launches-programmatic-audio-advertising-in-india/ 45717/1 | 9 https://www.thehindubusinessline.com/info-tech/programmatic-tech-set-to-steer-digital-advertising/ article10027030.ece Mobile Marketing Ecosystem Report 2018, India. 22 Waterfall Auction Header Auctionvs. $ 2.00 floor Below Floor Request Passback Request Partner #1 Partner #2 Partner #3 Partner #4 Winning Floor Not Called Not Called BID $1.50 BID $2.20 BID $3.00 BID $2.40 $ 2.00 floor Below Foor Partner #1 Partner #2 Partner #3 Partner #4 Losing Bid Winning Bid Losing Bid BID $1.50 BID $2.20 BID $3.00 BID $2.40
  • 26. Mobile Gaming in India is dominated by freemium games. 2016 saw a 200%23 increase in gaming app revenue, which will grow at a CAGR of 87% till 2020, crossing the USD 1 billion mark. The Indian gaming market is booming, with maximum growth (in both downloads and revenues) driven by Google Play, as proliferation of low-cost Android devices across lower-tier Indian cities continues to soar. In the last 2 years , game downloads in India has doubled, with Google Play generating 13 times23 more downloads compared to App Store. In the last 2 years there has been an increase of 80%23 in app store revenue from games. Whilst iOS constituted to less than a tenth of game downloads, iOS gamers contributed around 70%23 of the revenue, as iOS was the more premium segment of the market. On the contrary in 2016, Google Play revenue grew to match iOS as the majority Android users started spending on games. This trend is expected to grow as more and more premium users delve in high-end Android phones. Similarly, a CAGR of 48%23 growth in mobile app download will be seen by 2020. By 2020, mobile gaming app consumer spend to reach 1 billion USD Part IV: Key Verticals driving the Mobile Advertising (A) Mobile Gaming Mobile Marketing Ecosystem Report 2018, India. 23 Downloads Games Downloads iOS and Google Play Combied, India Q2 2014 Q2 2015 0 M 100 M 200 M 300 M 400 M Google Play iOS Q2 2016 2.1x 2015 08 18 28 116% Growth 38 Downloads 48 58 68 2016F Source: App Anne Mobile Games Forecast - Annual Downloads India 2020F 5 year CAGR: 48% 2015 $0.08 $0.58 $1.08 $1.58 200% Growth Revenues 2016F Source: App Apple Mobile Games Forecast - Annual App Store Consumer Spend India 2020F 5 year CAGR: 87%
  • 27. Download growth can be observed across nearly all gaming categories on Google Play in India, as its emerging user base continues experimenting with different types of games. However, Q2 2016 highlighted a shift in India’s gaming behavior, with a significant increase in time spent on immersive strategy games versus casual games compared to the same quarter in the previous year. While convincing users to spend money on games remains a challenge in India, two categories stand out for solid improvements in monetization: strategy and social card games. The latter has been able to ride on the success of mobile adaptations of traditional Teen Patti card games. Strategy and Social Card Games Drive Monetization! Gaming has grown to be more popular than entertainment, news, social media and other general apps. 9 out of 10 users24 have games on their phones regardless of their gender or the price of the phone. 59%24 mobile gamers in India are Millennials. For consumers the madness in gaming is just getting better - more engaged users on mobile gaming apps 24 Tune India Gaming 2016 Mobile Marketing Ecosystem Report 2018, India. 24 Top 5 Games Categories by Time Spent India, Android Phone Top 5 Games Categories by Revenue India, Google Play 0 50 100 Indexed Revenue Strategy 1.7x 0.8x 2.9x 1.3x 1.2x Casual Action Sports Social Card 150 200 Source: App Anne 0 50 100 Indexed Revenue Strategy 1.8x 1.9x 1.4x 1.1x 1.3x 1.3x Casual Action Sports Social Card 150 200 Source: App Anne Q2 2015 Q2 2016 Q2 2015 Q2 2016 84% of mobile subscribers have games on their devices 37% have more than 3 games on their phone. Almost 9 in 10 indian smartphone owners play games weekly A whopping 57% prefer single player games 1 in 10 people play the same game regularly for over a year There are a few facts that we can start off with, which are a clear indication of the madness that is gaming!24
  • 28. India is in the top 25%25 of countries globally for mobile user retention. After 14 days of installing a gaming app, around 24% of the users retain the game globally, whereas in India, it is 30.1%25 . Also, 12% mobile gamers in India play a game for a year. Women make up just 22%26 of all mobile gamers in India, however, when it comes to the frequency of playing mobile games, 79% of females reported that they played daily, compared to 71% of males. Additionally, female gamers spent nearly 70 minutes26 a day playing mobile games, in comparison to 55 minutes per day for males. 33%4 women gamers have downloaded more than 5 games on their smartphones, 37% more than men. Strategy seem to be the common genre of games that both men and women like to play. versus 54% men. The reason these games are preferred, stems from the Indian population’s need to commute locally , making single player games the way to pass this time. Also, for single-player games there is usually no requirement for internet connection or hefty data streams. Another trend in the Indian mobile gaming market is the rise of single- player games. These have become increasingly popular and managed to top the charts of the gaming apps with highest download rates. 63%27 women play single player games Indian gamers tend seen to be more engaged than their global counterparts 25 Tune India Gaming 2016 | 26 Gamesbond 2016 Mobile Marketing Ecosystem Report 2018, India. 25 How long do you play the games you typically like? Women download more games compared to men; Puzzle, strategy and casual games most popular Source: India and Mobile Gaming Report 2016 Monthly Mobile Game Downloads More than 5 Games 20% 16% 13% 12% 12% Puzzle Strategy Casual Arcade Action Racing Others 16% 14% 25% 18% 8% 7% 7% 11% 5 Games or less A Few days A Few weeks A Few months Over a year 49% 12% 16% 23% India Mobile Gaming: Single player, two player or team? 24% 33% 76% 67% 23% 54% 11% 14% 21% 11% 18% 9% 63% Single Player Player vs Player Team Games Team vs Team
  • 29. Case studies for Mobile Gaming Mobile Marketing Ecosystem Report 2018, India. 26
  • 30. (B): Rise of vernacular/Indic content in India 9 out of every 10 new internet likely to prefer vernacular/Indic content to access internet online The Indian language internet users have grown from 42 million28 in 2011 to 234 million in 2016, a 12x growth, almost double from the 2x growth seen in the English language internet users. Over the next five years, it is expected that 9 out of every 10 new internet users in India are likely to prefer vernacular or regional languages to access the internet. The Hindi internet user base is likely to outgrow the English user base by 2021. The English language still accounts for 56%28 of the content online, whereas, Indian languages account for less than 0.1%. The anomaly here is that in India only 12%29 population can read/write English. The Indian government is investing on digital literacy and using digital media to help reach the rural parts of the country. Within the last year, Hindi content on the web has grown by about 94%28 , whereas English content has grown by 19%. Furthermore, the increase in the availability of local language content online would help in increasing the internet penetration by 24%28 . While Chat applications and digital entertainment will bring new Indian language users online growing at 19% CAGR30 in line with the growth in total Indian language user base. Going forward Digital write-ups, digital payments, online government services, e-tailing and digital classifieds are emerging categories among Indian language users. Indian lan- guage user base accessing these categories will grow at a CAGR of 26% to 33% over the next five years. With increased local language support and content, these categories will see increased adoption among users. 28 IAMAI and IMRB Proliferation of Indian Language Report 2016 | 29 Census India | 30 KPMG & Google Indian Languages Defining India’s Internet Report 2017 Mobile Marketing Ecosystem Report 2018, India. 27 Internet user base in India (In Millions) 2021 ~ 12x growth ~2x growth 2011 English language internet users Indian language internet users 134
  • 31. The next 5 years look really promising in the growth of Indian language usage penetration among various businesses. Digital Entertainment is already on its epitome with Hindi and seeks to reach the same with Gujarati, Kannada and Malayalam by 202131 . eTailing sees a comparatively low growth, whereas Digital News see a sustainable growth. The maximum growth is seen in Digital Payments with a 2x31 growth across all languages. 31 KPMG & Google Indian Languages Defining India’s Internet Report 2017 Mobile Marketing Ecosystem Report 2018, India. 28 Category wise Indian language internet users-2016 & 2021P(in million)(11) Totalinternetuserbasefor8languages(2016-186million):(2021P-426million) CAGR(Userbaseadoption)till2021P 396 392 301 284 185 175 172 165 100 169 0 Chat Applications Digital Entertainment Social Media User base 2016 (in million) Digital News Digital Write-ups Digital Payments Online Government Services Digital Classifieds* 50 100 150 200 250 300 350 400 450 0% 5% 10% 15% 20% 25% 30% 35% 167 115 106 58 47 41 42 24 E-tailing* User base 2021 (P) (in million) CAGR 19% 19% 21% 22% 26% 30% 33% 32% 32%
  • 32. Affordability, accessibility, applicability, and awareness-building are the four areas where most of the work has to be done in-terms of mobile growth in India. The first 2 areas are growing, we really need to work on the latter two - applicability and awareness building. Many brands have taken a step forward and have included regional language in their interface. However, there is more that still needs to be done. In December 201633 YouTube declared that it will be showing users in India more content in their preferred local language. The localized content languages will be available on both YouTube’s homepage and in its trending section, and will be targeted based on users’ watch history. The new languages include The smartphone manufacturers also need to deploy Indic language supported keyboards as 70%32 of the Indian language users find it difficult to operate English keyboards. While many people are creating indic content, more effort required to make it mainstream Mobile platform Launch August, 2015 2012 Hindi, Tamil, Telugu, Malayalam and Gujarati Hindi, Tamil, Telugu Bengali, Punjabi, Marathi, Kannada and Gujarati among others India’s first vernacular rail booking app in 5 languages To double non-English users every 6 months in India Language Purpose 2009 January, 2015 Hindi, Bengali, Marathi, Tamil, Telugu, Gujarati, Punjabi, Malayalam and Kannada. Hindi, Marathi, Gujarati, Bengali, Tamil, Telugu, Kannada and Punjabi. ‘Tap to Translate’ ‘Google Loon’- provide connectivity in rural areas Create a localized experience; can deliver on a global scale sitting in India. November, 2012 32 KPMG & Google Indian Languages Defining India’s Internet Report 2017 Hindi First to create a Hindi app to increase the account holders to 80% who use apps Mobile Marketing Ecosystem Report 2018, India. 29
  • 33. Bengali, Gujarati, Hindi, Kannada, Malayalam, Marathi, Punjabi, Tamil and Telugu. A great decision by YouTube as by 2021 vernacular content consumers in India will be more than double5 English content consumers (536 million34 vs 199 million). 33 http://indiatoday.intoday.in/technology/story/youtube-in- dia-will-now-show-more-local-language-content/1/830066.html | 34 http://brandequity.economictimes.india- times.com/news/media/how-ott-players-are-geared-up-to-woo-indian-viewers/57275909 1) Availability of quality supply for advertisers. 2) Ability of the Brands to connect with “Bharat”(multi-language and rural) and not only “India” (predominantly english speaking) 3) Better price realization for publishers will drive further investments in enlarging the quality base of Indic publishers User generated content: We will see a rise in the participation of the Indian language users, due to the vernacular friendly apps and platforms. Thus, allowing a transition from passive users to active users, leading to a rise in opinion and user generated content. Tools such as dictionary, spell check, grammar check, translation & transliteration should be developed for Indic languages (publishers and developer both). Size does matter: The major issue when it comes to developing a web page/app in regional language is its size. Since regional language fonts are complex in comparison to English, such a webpage is often ‘heavier’. This limits page size and it takes more time for a regional language web page to load. This limitation often restricts site versatility that ultimately affects the end-user’s experience. Indic Keyboards: 45% of Indian language users face challenges in text input on chat applications. Adoption of input mechanisms such as voice to text support, local language keyboards and transliteration is expected to improve user experience. Inclusion of Indian language fonts and keyboards in mobile handsets depends on the discretion of the hand-set manufacturer. So OEMs have to put their best foot forward and integrate keyboards that at-least have 22 national languages of India. Voice to Text: Facebook and Google are both developing “Voice to Text” software for different languages, which is a killer combination and will resolve the content creation problem completely. People who don’t know how to write can also send messages and create content via this tool. Where does the Future Stands? An outlook for Marketers! Mobile marketing ecosystem report 2018, India. 30
  • 34. Case study for Vernacular Content Mobile Marketing Ecosystem Report 2018, India. 31
  • 35. India is a developed market for entertainment content consumption, with entertainment being one of the top 3 internet activities for both Rural and Urban internet users. The consumption of video has jumped many folds, especially on mobile devices. The future predicts, video being the largest share of the pie on content consumed on mobile internet, growing from 49%35 in 2016 to 75% in 2021. The appeal of video is easy to understand. It lends itself to storytelling in a more engaging and entertaining way than print and radio. Consumers pressed for time and conditioned for instant gratification—meaning almost everyone naturally gravitate towards video. Online video is the fastest-growing segment with year-on-year (YoY) growth rates reaching 64% with almost 250 million online video viewers in India in 2017. (EY, India’s Media and Entertainment Sector, March 2018 report) small period Netflix gathered 4.2 million37 active subscribers, at a minimum of Rs.500 per month subscription for a single screen user. Leading the chart is Hotstar at 63 million37 active users banking on its first movers advantage, live cricket streaming and premium HBO content (especially Game of Thrones). In India, the number of video-capable devices and connections are expected to grow 2.2X between 2016 and 2021, reaching 800 million36 in number. Currently, the number of OTT (Over the Top) / VOD (Video on Demand) players in India have significantly increased reaching over 1001 million users with the likes of Hotstar, Voot, Netflix, Amazon Prime, Sony Liv and Zee5. In a very (C): Mobile OTT Video India has 250 million online video viewers, 100 million OTT viewers 35 KPMG Media and Entertainment Report 2017 | 36 EY Digital Opportunity 2017| 37 http://brandequity.economictimes.indiatimes.com/news/media/how-ott-players-are-geared-up-to-woo-indian- viewers/57275909 Mobile Marketing Ecosystem Report 2018, India. 32 Content consumption by category for Mobile Internet users in India 2016 2021 49% 39% 10% 2% 75% 16% 6% 2% Video Streaming audio File Sharing Web and Another Data Video Streaming audio File Sharing Web and Another Data
  • 36. YouTube stands 2x38 in-terms of monthly active users when compared to OTT players in the country. With OTT players only 3 years old in India and YouTube was launched 10 years ago, the growth graph of the former is soaring high and (if not sooner) will reach near to YouTube in the years to come. The drivers to growth in OTT con- sumption on YouTube are the growing web series and the growing regional content that caters to Indian’s 90% (approx) regional language speaking audience. This has also led to the growth of long format content consumption (above 5 minutes38 ). OTT players running towards their share in the YouTube audience Mobile Marketing Ecosystem Report 2018, India. 33 Video Platforms Online Video: Market share by installs March - 2017 Others consists of: TVF, The Viral Shots, Vixty, Viu, DailyMotion, TubiTV HotStar 37.2% 6.7% 5.3% 2.9% 1.5% 0.6% 5.5% 1.0% 1.8% 10.9% 7.3% 5.4% 1.3% 1.5% 2.3% 8.8% 0 5 10 15 20 25 30 35 40 Hungama Wynk Movies YuppTv ErosNow Spoot Dragonfli Netflix ColorsTV Voot Amazon Prime Sony Liv Tatasky HelloTV OZEE Others* Active users of Youtube and OTT platforms Monthly active users (mn) Source: OTT and VoD player interviews, Analysys Mason 225Youtube Hotstar Voot Amazon Netflix Sony LIV Subscription only Hybrid Free TVF Play ALT Balaji 75 30 13 5 5 4 2 Ott Platforms Gaining Popularity
  • 37. 39 IDC 2018 Globally, people spend an average of 45 minutes daily on their smartphones to watch videos. India is slightly higher with 5039 minutes spent daily on smartphone video viewing. Video viewing on Smartphones did beat that on desktop (at 45 minutes), however, has a long way to go to beat live TV time at 73minutes39 , a whopping 40% more. 38 Nokia MBIT Report 2018 VOD/SVOD blurring the lines between TV and Video content consumption Mobile Marketing Ecosystem Report 2018, India. 34 Screen video view timings (in minutes) Global Live TV On Demand TV Computer Tablet Smartphone India 22 37 37 17 5045 73 20 45 66
  • 38. 86%40 TV viewing consumers also interact with Facebook as their second screen while watching TV, for Twitter it's 66%40 . Social media in 2016 didn't only expand its portfolio with video content but also gave consumers a new addiction - live streaming. A global survey said that 50%41 of marketers plan to use live video services for their marketing campaigns in 2017. The Indian market has now seen an uptake in SVOD (Subscription video-on-demand) services. With Netflix, Hotstar Premium and Amazon Prime delivering great content, consumers are actually ready to pay for premium content on these platforms. A new addition in the Indian market will be YouTube Red which will see a surge in the next 2 to 3 years. Homegrown production house like Culture Machine, Girliyappa, AIB, TVF, Blush, Bindaas, Eros Now, Hats Off Production, Open Window, Trend Loud etc. are creating web series to entice the Indian audience and also getting millions of views for it. Low priced services like Amazon Prime at Rs.999 yearly and Hotstar Premium at Rs.199 per month, SVOD will sky rocket in India in a couple of years. So now marketers have many opportunities with video advertising where they can, not only leverage made for TV content on platforms like Hotstar, Voot, Zee5 etc. but also leverage from consumer created content like vlogs, Snapchat stories, Instagram stories, periscope live feed or Facebook live video. Integrated planning helps marketers to know their user’s consumption habits both, on offline and online media. With mobile integrated you can also have more in-depth tracking of your campaign that is beyond reach and talks about clicks, visits and engagement etc. Further, retargeting your customers and lookalikes on varied digital platforms for your consecutive campaigns. India is in the state of Programmatic evolution, saw 81% growth in 2017 Mobile Marketing Ecosystem Report 2018, India. 35 Internet users in India who subscribe to select suscription Video-on-Demand (SVOD) Services, Feb 2017 %of respondents Don’t know/notsure Subscribe to SVOD Top 3 services 1. Hotstar 52% 2. Amazon Prime Video 49% 3. Netflix 12%YES 52% NO 43% 5%
  • 39. So, what makes a video ad engaging for the consumer? Make the add funny!42 The Millward Brown Video Ad Reaction Study found that funny content is the top priority for both Indian and Global audiences to not skip an ad. Consequently, if the ad is of their favorite category, brand or they are getting rewarded on seeing the ad, they would happily give marketers a complete view for that ad. Case Study for Mobile Video (integrated campaign) 39 Millward Brown Ad Reaction Study | 40 http://www.socialmediaexaminer.com/wp-content/ uploads/2016/05/SocialMediaMarketingIndustryReport2016.pdf | 41 https://www.nabshow.com/thought-gal- lery-thought-leaders/6-key-media-and-entertainment-trends-look-2016-nab-show How to engage your video viewing audience? Mobile Marketing Ecosystem Report 2018, India. 36
  • 40. Since the growth of OTT video platforms from late 2015, a stereotype has been maintained on the usage of these platforms. Quotes like ‘mostly metro audience use OTT video platforms as they have better access to 3G/4G network’ and ‘mostly premiere audience who wants to consumer English content only access the OTT video space’. As per the latest report (India Watch Report 2018) by Hotstar, we see that 26%43 of premier English content consumption audience who watch Game of Thrones on the Hotstar platform also watch Hindi TV shows and 25% of North and West Indian audiences watch Telugu movies (virtually nullifying the language barrier). The report also showed that non-metro cities showed more growth compared to metro cities in watch-time. Jammu and Kashmir and North East showed the maximum growth, 3x43 more than metro cities. This shows that the growth opportunity for OTT video players in India is beyond metros and in the coming 2 to 3 years we will see more tier 2 and 3 cities will absorb more on-demand content. All of this is the thought of the past. 2017 saw a 360-degree change in OTT content consumption that shattered all perception that marketers had about video content consumption patterns. 42 Millward Brown Video Ad Reaction Study Breaking Stereotypes! Mobile Marketing Ecosystem Report 2018, India. 37
  • 41. Did you really see an ad or you just scrolled through it or you were on another screen reading an article when the video ad was playing in the background? These are a few questions going in a marketer’s mind. Do internet users engage with an ad to even recognize its presence while they are engaging with the content they went online for? This is the question of viewability. Viewability is an online advertising metric that aims to track only impressions that are actually seen by internet users. Furthermore, when it comes to mobile display ads the thumb moves faster than the eyes can register. Users don’t stop to see an ad then why should a marketer pay for a un-viewable impressions. With only 40%4 of ads viewable in the India market, ad viewability is the biggest risk that brands face; it is the biggest digital accountability challenge for delivering effective digital campaigns. For this reason many industry bodies and agencies have created viewability standards. While platforms like YouTube and Facebook have challenges on ad viewability, OTT platforms like Hotstar report over 85% ad viewability as they create a TV similar experience in serving ads to ensure completed views. They however cap ad breaks to a max of 60 secs to ensure sustained viewer interest in continuing with the content Ad effectiveness, let’s talk Viewability Since the advent of YouTube, followed by platforms like Vine, Twitter, Instagram, and Facebook (and many other social platform); video content both brand and user generated has been a rage. However, this isn’t exactly good news for marketers as the content created can be spam, criminal or adult. The question marketers need to ask is about contextual brand safety.? The content on which my brand’s name and ad is to be seen, is it safe and blends with my brand’s reputation? Contextual Brand Safety 43 Hotstar, India Watch Report 2018 Mobile Marketing Ecosystem Report 2018, India. 38 50%40% 10% Non Viewable ads Viewable ads Invalid Traffic
  • 42. After the YouTube fiasco early 2017, contextual brand safety is the top most priority for many brands. YouTube and other Google sites have taken a fall due to brand safety issues as many big brands stop advertising on these platforms. No Advertiser Ads may be placed on inventory that contains material that: Infringes the intellectual property rights of others (including but not limited to unauthorized copies, public performances or derivative versions of software, films, television programs, music, books, electronic games, or other categories of protected works) Induces, facilitates, promotes, or enables financial benefit from such infringement (e.g.P2P/Bit Torrent/MP3 tracking and indexing sites, “linking” or “leeching” sites, ROMs, “warez”, emulators, hacks, “phreaks,” “cracks,” or ripping software for illegally circumventing DRM or other copy protection devices) Promotes or facilitates illegal activities, deceptive practices, or violations of the privacy rights of others Promotes or facilitates activities generally regarded as Internet abuse, including but not limited to, the sending of unsolicited bulk electronic mail or the use or delivery of viruses, Spy-ware, or another malware Relates to violence, sex, profanity, racism, sexism, religion, gambling, pornography, abortion Mobile Marketing Ecosystem Report 2018, India. 39
  • 43. An outlook for Marketers! Smarter Phones, Cheaper Data costs, and successful marketing has made OTT platforms all pervasive, and the App usage time for them has skyrocketed. Brand and advertiser today don’t need to focus on only one platform for Video advertising, and can pick-and-choose quality supply given to them by all players. OTT viewing compliments TV viewing - mobile is the new primetime! Majority content of the homegrown video OTT players is from their TV channels. Even though people can now record the content on their TV via their digital set-top boxes, having one platform that has all the TV content available without the action of recording or browsing multiple channels has become one of the main reasons people have adopted OTT platforms. Another dimension to the adoption is streaming sports in real-time, Hotstar saw tremendous growth in their viewership with IPL matches. Mobile is increasingly becoming the preferred screen as opposed to a catch-up screen vs. TV. Mobile Marketing Ecosystem Report 2018, India. 40 Consumer engagement is a major issue for all advertisers due to the shorter attention span of the user today. Long story content offers the unique opportunity for marketers to talk to audiences engaged with content for 20 minutes44 or longer. It also provides more slots to drive frequency of message. The Next Content Evolution - ads go beyond 30 seconds as longer format creative content becomes more popular 44 Hotstar, India Watch Report 2018
  • 44. Viewability and Brand Safety have now become synonymous to digital video advertising globally. As mentioned earlier in this chapter, contextual content and actual reach (in-terms of who has seen your video ad) now decide the performance of your video campaign. These two parameters should be followed to the ‘T’ and all brands should on-board third party tools like OpenSlate and MOAT to measure the effectiveness of their video campaigns. Viewability and Brand Safety for Brands Source: Hotstar, India Watch Report 2018 When compared to 2015, in 2017 the consumption of long format videos on YouTube45 doubled and on Hotstar, the leading OTT player average time spent is 43 mins per day per user, with 96% of watch time coming from video greater than 20 minutes. Long story ad format solves this problem by providing more emphasis on entertainment and story. Long story ad formats don’t have the short lived objectives of clicks and complete views; they actually work on long-term objectives of creating brand affinity. Also, the brand has a bigger canvas (in-terms of time) to reinforce its message and a larger engagement opportunity with its consumer. 45 Nokia MBIT Report018 Mobile Marketing Ecosystem Report 2018, India. 41 Time format of most popular videos onYouTube India Source:Vidsstatx, Analysys Mason 90% 2015 10% 75% 2017 25% Short-format Long-format ‘Snacky’ is passe: real stories matter One third of all Hotstar entertainment viewers follow their favourite shows primarily on Hotstar TV of watchtime on hotstar comes from videos longer than 20min96%
  • 45. Case Study for OTT video platforms helping in creating better Brand Awareness Mobile Marketing Ecosystem Report 2018, India. 42 Music Industry size in India (in INR billion) CAGR growth 13% (2015 vs 2016) 25.4 22.1 19 16.3 14 12.2 10.8 9.8 9.6 10.6 9 2011 2012 2013 2014 Source: KPMG and FICCI 2015 2016 2017(E) 2018(E) 2019(E) 2020(E) 2021(E) CAGR growth 15.8% (2016 vs 2021) On-demand entertainment services led by audio and video content are at the cusp of inflection point in India. A very promising supply side ecosystem has evolved in India for streaming with multiple players.In the last 2 years with more smartphones, cheaper internet and launch of various domestic Audio OTT players, the scenario has changed. In 2016 India had 10042 million Audio OTT users. OTT audio will increase at a CAGR of 15.8% till 2021 (D): Mobile OTT Audio
  • 46. Sales of music rights generated robust revenues, at about 5%43 of the production cost of a movie for filmmakers in 2016. This was attributed to an increase in syndication and digital consumption of music and licensing of music from major labels by various music streaming platforms such as Gaana, Wynk, Hungama and Saavn. Apart from established players like Saavn, Gaana, Hungama and Wynk new players such as Google Play, Amazon and Reliance Jio have entered the market with even cheaper subscription models. In this competitive industry, with similar song catalogues and genres available across all service providers, platform loyalty plays a key role to improve monetization and retain consumers. Due to increasing competition, music streaming services are investing in creating a platform that has exclusive content, non-music content and even selected video catalogue. For instance, Saavn has ‘Originals’ with audio stories, podcasts and commentaries while Gaana has ‘specials’, such as popular Radio Mirchi content, sit down comedy and exclusive programs, and Hungama has an original audio series called ‘Mera Wala Music’ that offers non-music stories. 42 MMA and GroupM Mobile Ecosystem Report, India 2016 | 43 KPMG and FICCI Media and Entertainment Report 2017 Mobile Marketing Ecosystem Report 2018, India. 43
  • 47. Digital music industry ad revenues are expected to mirror the growth rates to be seen by total digital ad revenues in India by 2020. The digital revenues would come majorly from display ads followed by video and audio ads (that are planned on OTT platforms). At the same time, the paid subscriber penetration among online music users is expected to reach 10-15%44 . Contribution from digital music segment to overall Indian music industry revenues is expected to grow from 55%44 in 2014 to 72% in 2017. Further, with that growth digital music industry revenues including streaming, downloads, and other format revenues and subscription and ad revenues are expected to cross INR 31 billion by 2020. To differentiate themselves, music streaming services are leveraging digital technologies such as analytics, machine learning and AI and investing on user experience, customization services and new type of content. For example43 , Saavn has integrated a social networking feature with its music streaming service which allows users to follow the profiles and playlists of their friends as well as celebrities. Gaana has launched a first of its kind Facebook messenger bot inside the Facebook messenger application developed to provide streaming services to its users on Facebook. Hungama is rewarding points though gamification to its users, which they can then redeem to buy digital goods such as songs, music videos and movies. This trend indicates that companies which had their primary focus on playlists and acquisitions are now also investing to generate original content to differentiate themselves and add monetization channels. The concept is similar to OTT video where in to reach more SVOD like Netflix and Amazon Prime, even Audio OTT platform need to create content that is different from their competitors. OTT music contains 72% revenues of overall Indian music industry! Here’s a look at the differentiated offerings of each music streaming apps: 44 KPMG and FICCI Media and Entertainment Report 2017 Mobile Marketing Ecosystem Report 2018, India. 44 Saavn Pricing Bitrate Apps for Trial Period Offline/purchase Metable Features `99 (Android) `120 (iOS) 320kbps Andriod iOS Windows 1 month Yes / No Collection of Songs & Curation User interfece, Mirchi Radio Marathon Playlists & Collection Video Streaming & Download International Collection Yes / No Yes / Yes Yes / Yes Yes / Yes (thru iTunes) 1 month 14 days 7 days 120 days Andriod iOS Windows Andriod iOS Windows Andriod iOS Andriod iOS 320kbps 320kbps 320kbps 320kbps `99 (Plus) `129 (Freedom) `99 (99 items) `99 (Unlimited) `120 (individual) `99 (Month) `99Saans Wynk Hungama Apple Music
  • 48. Case Study for Audio OTT Mobile Marketing Ecosystem Report 2018, India. 45
  • 49. Part V: Mobile Ad Spends Mobile continues to enable digital ad spend growth and increase its share of pie significantly! As consumers continue to spend more and more time on their smartphones, investments towards digital are rising. Millennials accounting for 30%46 of the Indian population and 72%47 of the Facebook user base in India; are the key target audience among most marketers today. It is not only that the millennials spend disproportionate time online, they are also very engaged - 72%48 of Indian digital shoppers are millennials and consume more than 102 minutes5 of streaming entertainment (music + video) every day, making digital & mobile a very significant part of an advertiser’s media mix. The global growth of the media ad spends industry in 2017 was 3%47 , whereas India saw a 13% growth in FY 2018. On the mobile marketing front, 70%45 of the Indian digital ad spends goes on mobile. 45 GroupM TYNY India, December 2016 | 46 Census Calculation | 47 Facebook Ad Manager | 48 IAMAI and Kantar IMRB| Mobile Marketing Ecosystem Report 2018, India. 46 % Share of media spends in India 45.64% 28.27% 15.49% 4.80% 0.75% 1.10% 3.95% TV Radio Newspapers Magazines Cinema Outdoor and retail Digital Source: GroupM TYNY Jun 2018
  • 50. 4G networks, cost effective data plans, smartphones has led to mobile becoming a ‘Torchbearer’ that is driving digital ad spend growth in India. This has shaped, Digital equals Mobile to Mobile now greater than Digital, India’s has sprinted towards mobile growth. The near future will not only see growth of mobile marketing in India, but mobile will enable growth of other mediums via Integrated Marketing as newer technologies grow. Going forward mobile video, audio, and gaming industries will power mobile advertising spends. However, IoT, AR/VR and AI will create newer channels to grow mobile in India and give marketers new platforms to experiment. Mobile Marketing Ecosystem Report 2018, India. 47 Digital vs Mobile ad spends in India (USD mn) 2018 (F)2017 (F)2016 (F) 1,095 644 1,424 996 Exchange rate used: USD 1 = INR 66.661 Source: GroupM estimates1,381 1,851 Digital Mobile Overall Adex (in USDmn) and Adex growth (%) 0%0 100,000 200,000 300,000 400,000 500,000 600,000 Worldwide APAC China USA India 2% 4% 6% 8% 10% 12% 14% 2016 2017 2018 (F) 2018 vs 2018 (% growth)
  • 51. Appendix The changing definition of a feature phone!* Historically, “feature phones tend to use a proprietary, custom-designed software and user interface, and lack the capabilities of smartphones.”The journey started with Cell Phones, they were first introduced in India in the early 1990s with basic capabilities of calls and messages. Then came feature phones which allowed the access of internet on mobile devices with the help of telecom partners. Almost, after 10 years from the advent of cell phones and their adaptation to feature phones came smartphones in the mid-2000s, where Ovi store from Nokia led the path. Then, in the late 2000s and early 2010s, Android and iOS changed the game completely with software that catered to third party application downloads in the mobile device which feature phones couldn’t. In the last 4 to 5 years smartphones have become cheaper whilst providing functionalities that a feature phones cannot, resulting in users switching to smartphones for a better experience at a lower cost, as low as 3k. Cut to 2015, feature phones have all functionalities included in them in under 2k. With Micromax and Karbonn leading the feature phone boat, you now have extended memory options of feature phones, better display, and faster processors. These extensions in the feature phone product portfolio gave them a longer shelf life. People who aren’t much of app users and their mobile usage is minimalistic would now prefer sticking to these advanced feature phones than to adopt smartphones. This has led to the constant growth of feature phone shipments in India, which many industry experts thought would die. In a recent study by IDC* reports that one out of two feature phone users have strong intent to buy a 4G feature phone in next 6 months. This clearly showcases how 4G feature phones will take the mobile device market by storm and give smartphones a run for their money. *Reference to Page 5 Mobile Marketing Ecosystem Report 2018, India. 48
  • 52. Mobile Marketing Ecosystem Report 2018, India. 50 2017 2018 2019 2020 0.6 1.1 1.6 2.4 76% 31% Three out of four gamers indulge in playing games on their mobile phone more than twice a day gamers play 4-5 times in a day of mobile gamers like to play during leisure time 44% WHILE TRAVELLINGHOME ‘Free’ lures gamers ‘Free to play’ is the most popular gaming model among gamers. Around 40% of gamers are likely to pay for the games at some stage of gaming TYPE OF GAMES DOWNLOADED 92% 28% 11% (Free to play games) (Freemium games) (Pay to play games) Female gamers – Mental Simulation games is a winner across age groups Female gamers across age groups are highly inclined towards playing puzzle / quiz and word games. Given the multi-genre preferences, female in the age group of 20-34yrs are also like to play action / adventure and racing games. 15 - 19yrs Puzzle / Quiz / word 70% Male Gamers - shift in genre preferred as age increases We observe a notable shift in the genre preferred among men as their age increases. Major proportion of younger male gamers are inclined towards playing games which give them an ‘adrenaline rush’ , while preferences shift to mental simulation games for men in the upper age group of above 35yrs. About a quarter of gamers above 25yrs of age like to play casino / betting / card games. Action / Adventure Majority of the gamers spend more than half an hour playing mobile games MOBILE GAMING IS AN ENGAGING MEDIUM INDIA’S MOBILE GAMES REVENUE IN USD (BILLION) 20 - 24yrs 87% 25 - 34yrs 86% 35+ yrs 80% 15 - 19yrs 20 - 24yrs 25 - 34yrs 35+ yrs 42% COLLEGE 15% WORK 14%86% 72% 72% 71% 52% 7%Less than 10 mins 25% 27% 26% 10 mins to half an hr 0.5 hrs to 1 hr 1 to 2 hr 16%More than 2hrs
  • 53. MOSTT - Marketing Organization Structure Think Tank Short statement Rethinking the world of marketing organization structure. Mission Accelerate marketing performance and business growth through best in class organizational design transformation. Description MOSTT is a community of marketing experts and professors committed to rethinking the world of the modern marketing organization; seeking to guide marketers on real innovation in marketing org design. MOSTT goals: 1. To provide to customer-driven companies information about organizational mar keting best practices and their potential for value. 2. To provide to CMOs information about marketing org trends, opportunities and benchmarks in order to help them foresee the future and develop innovative Marketing Org strategies. 3. To create a central source of all insights on marketing org in order to help accelerate the transformation of modern marketing organizations. 4. To facilitate engagement and collaboration between marketing and HR leaders in order to drive thought leadership. MOSTT Projects 1. Mobile Analytics Real-Time Social (MARS) Study The main objective of this project is to define how marketing organizations of traditional brands need to adjust, adapt and organize in order to take advantage of and continue to lead business growth in light of changes in marketing and technology (e.g. new media and communication forms, platforms, etc...) - M.A.R.S. 2. Mobile Maturity Through the Mobile Maturity project we aim to help CMOs understand and activate the unique and specific role of mobile in creating and achieving greater overall customer centricity. Mobile Marketing Ecosystem Report 2018, India. 51
  • 54. 3. Center of Insights We aim to provide marketers curated content on the topic of organizational structure in our MOSTT Center of Insights. MOSTT Governance MMA's MOSTT team will be led by a Sterring Committee comprised of nine of the top global brand marketing merketers. Mobile Marketing Ecosystem Report 2018, India. 52
  • 55. SAVE Short statement With the increased complexity of protecting a brand’s image and reputation from the rise in threats from fake news, inappropriate content, marketing tech, the digital supply chain, ad fraud and more, SAVE is here to help. Mission Participate on the future of the brand safety council and become a brand safe marketer. What is SAVE? SAVE is a marketer-led Future of Brand Safety Council created to ensure safeguards for brands in all marketing environments. The Council will develop processes, programs, benchmarks, and measures to protect your brand’s reputation and marketing investment. SAVE Working Groups Comprised of senior-level marketers from leading brands, our newly-formed SAVE Brand Safety Working Groups are developing brand safety guidelines and best practices for the industry. To learn about or join the working groups, click here. Strategy Guide for Brand Safety Template Working Group This Working Group is likely to develop a templated strategy document that can be used by marketers to write their own Brand Safety strategy. This group will decide what areas should be covered by a Brand Safety Strategy, standard definitions, what should be addressed in each area, and best practices for a brand to become a Brand Safety Ninja. The MMA SAVE Brand Safety Agenda will initially focus on the following four guiding principles: Creation of a Marketer Brand Safety Strategy Guide Assessment and Benchmarking of Brand Safety issues by marketers Validation of Brand Safety Partner Selection and Evaluation Brand Safety Education Mobile Marketing Ecosystem Report 2018, India. 53
  • 56. Brand Safety Insights and Research Working Group This Working Group involves working with Andrew Stephen, Associate Dean of Research and L'Oréal Professor of Marketing at University of Oxford, Said Business School, to define what marketers need to know about Brand Safety and the benchmarks and insights to guide individual company’s Brand Safety programs and decisions. Brand Safety Vendor Assessments Working Group There are a number of directions this Working Group could go in, including, but not limited to, creating a map for all Brand Safety vendors and tools, developing an RFI for picking vendors in the various areas and identifying selection strategies. SAVE Leadership SAVE is governed by: SAVE Member Participants The creation of SAVE aligns squarely with the MMA’s marketer-first mission with a focus on solving the biggest marketing problems brands face in this new mobile-driven era of dramatic changes in consumer behavior, technology innovations and market place disruptions. Mobile Marketing Ecosystem Report 2018, India. 54
  • 57. Mobile Marketing Ecosystem Report 2018, India. 55 Brand Safety Issues are Not Going Away! • 70% of Marketers State the Issue of Brand Safety is Escalating • 48% of consumers said they would rethink purchasing or even boycott a brand if it appeared next to content that offends or concerns them • Hundreds of brands have recently been “tagged” in the press for running ads aligned with controversial or “unsafe” content. A rise in brand safety issues signals a potential nightmare for marketers. And if ignored, brands can face serious backlash to your reputation, your customer loyalty, your revenue, and eventually to your bottom line.
  • 58. How Mobile Marketing Can Boost Brand Engagement India has up to four times higher smartphone audience compared to desktop today. This comes as no surprise, due to the affordability of mobile devices and increasing broadband coverage beyond Tier 1 cities in recent years. With 337 million smartphone users in India by the end of thisyear – a growth of 16 percent since 2017 – the opportunities for marketers in the mobile space are vast. As the only medium that allows a two-way interaction to happen in real time, the opportunity for brand engagement is huge. Alongside the emergence of artificial intelligence (AI) and machine learning, mobile has become a powerful device, bringing the world to our fingertips. Here are a few ways new technologies in mobile can boost engagement. Tell it to the voice bot With over half of global marketers already using AI capabilities to track and improve users’ online journey, it is a powerful tool for increasing engagement. Combined with mobile technology, AI allows marketers to deliver personalized messages that target cus- tomers more effectively. Its ability to process information at high speeds also means that the level of personalization is becoming more sophisticated each day, even predicting what customers want before they know they want it. Since Siri was introduced to iPhone users in 2011, having a virtual voice assistant has become commonplace. The introduction of voice bots in recent years have also changed the way people interact with technology, with a penetration of just 8 percent in 2017, to an estimate of 39 percent by the end of this year in India alone. Growing in popularity, brands should tap on the potential of voice bots, offering a level of personalization that is unparalleled with any other form of advertising. Imagine a consumer about to go on her first date that weekend asking Alexa (Amazon’s digital assistant) what she should wear. Alexa then comes back with recommendations from her favorite online stores, or stores along her daily commute, where she can pick up an outfit on the way home from work. Walking home the next day, her mobile phone prompts her to pick up the dress suggested by Alexa, and provides a discount code. Such technology is already available; it is a matter of whether brands are quick enough to capitalize on it. Mobile Marketing Ecosystem Report 2018, India. 56
  • 59. Mobile attribution Young people today are getting more and more impatient due to the immediacy that technology provides. Integrating mobile into a brand’s multichannel marketing strategy can engage users in ways that conventional marketing is unable to do. It allows for a seamless experience across multiple touchpoints, so mobile users who previously searched for a product on desktop would be prompted with an ad of the exact product when on mobile, where they can continue on their purchase journey. For example, a mobile phone user may see an ad while playing a game, but may not pay too much attention to it. However, upon visiting another site, they are reminded of the same ad, and after seeing it three times, they may search for it willingly. Mobile attribution would be able to track the first ad of the product that user saw, to the point of purchase. To effectively measure the impact of this multi-channel strategy, marketers are adopting multi-touch attribution (MTA), which measures user data across channels, linking their devices into a single point of reference. This allows brands to track the effectiveness of mobile in their marketing process. For a more seamless measurement, the Mobile Marketing Association (MMA), through its Marketing Attribution Think Tank (MATT) is constantly working to identify best-in-class MTA solutions. This is done by developing a more standardized way to measure MTA, so that marketers have opportunity to select and apply MTA solutions with confidence. Boosting ecommerce through value-added apps Ecommerce sales in India is said to increase by 31% this year, reaching the US$32.7 billion mark. This massive growth rate puts India as one of the top ecommerce markets in Asia. Beyond non-perishables, marketers today are looking at expanding into food an groceries. This means that buyers will make even more purchases via mobile through repeat visits. The challenge then, is for brands to maintain customer loyalty. With a quarter of India’s population becoming digital shoppers this year, investing in customer loyalty would be seen as a wise move. Globally, we see the growth of ecommerce reflected through brands like Instagram, which is said to be working on a new app dedicated to shopping. As more local startups build their businesses on social media platforms, the competition increases, and brands need to look at creative ways to engage their customers. Providing value-added information through mobile can build a closer customer relationship, and trigger a positive emotion with the brand. As an example, at the recent MMA Ideathon, one of the teams designed a language-based application for people to get a better understanding of nutrition. Mobile Marketing Ecosystem Report 2018, India. 57
  • 60. Understand customer behavior Mobile devices are also often the first and last devices people interact with, from the moment they wake up to the time they go to bed. While it can be very tempting to keep pushing information in front of mobile users to grab their attention, brands can run the risk of spamming customers. Marketers need to know their target audience and when they are most receptive if they want to remain on the right side of a very thin line between helpful, and annoying. A fairly new medium for marketers, much of mobile’s potential remains untapped, but requires brands to first understand what they want to achieve. While mobile can boost brand engagement, it will only work if organizations have a clear definition of success and a proper strategy behind it. Mobile Marketing Ecosystem Report 2018, India. 58
  • 61. Smarties India 2018 Winners Mobile Marketing Ecosystem Report 2018, India. 59 Brand Awareness Activating Infection Alert Unilever / Lifebuoy Lead Generation / Direct Response / Conversion Smart Search Future Group / Big Product/ Services Launch #1CroreChallenge Exide Life Insurance Promotion When India Dared to Stare MTV / Roadies Relationship Building/ CRM Castrol CRB Mini Truck Ka BP / Castrol CRB Plus Socia Impact/ Not for Profit Powerless Queen Mahindra Rise / Project Nanhi Kali Marketing Within a Mobile Gaming Environment Messaging Powerless Queen Mahindra Rise / Project Nanhi Kali MFC Uses Green Sim Data Mahindra First Mobile App Advertising Chug Chug on Chuk Chuk PepsiCo/ Pepsi Mobile Social #JumpForHealth Aditya Birla Capital Innovation When India Dared to Stare MTV - Roadies Location Based services or Targeting Google Maps Weather Google / Google Best Brand Experiences in Mobile Rich media When India Dared to Stare MTV - Roadies 1 2 3 4 5 6 7 8 9 10 11 12 13 14 Most Engaging Mobile Creative Beauty for All - Retail L'Oréal Paris / Infallible Mindshare India Mediacom Autumn Madison Mindshare India WATConsult WATConsult Isobar India Mindshare India Mindshare India Madison Toaster Ltd. Madison InMobi Gold 1 1 1 1 1 1 1 1 1 1 1 1 1 1 MMA India 2018 - Awards List S.No Category Entry Name Advertiser Brand Lead/Agency Silver 1 1 1 1 1 1 1 1 1 1 1 1 1 1 1 1 2 3 4 5 6 7 8 9 10 11 12 13 14 15 1 S.No Category Entry Name Advertiser Brand Lead/Agency Brand Awareness Lead Generation / Direct Response / Conversion Promotion Socia Impact/ Not for Profit Socia Impact/ Not for Profit Cross Media Cross Mobile Integration Marketing Within a Mobile Gaming Environment Messaging Mobile App Advertising Programmatic Mobile Social Mobile Audio Best Brand Experiences in Mobile Rich media Most Engaging Mobile Creative Rakhi with Fabelle MFC Uses Green Sim Data Insights to Drive 8X Conversions Godrej No. 1 Presenting Punjab di Beauty No. 1 Maiam Whistle Activating Infection Alert System in Rural India Entertainment Wish Karo, DishTV Karo Sabse Smart Kaun Patanjali - Motu Patlu Activating Infection Alert System in Rural India Godrej HIT Dengue Back Transforming Pizza Hut Into a Delivery Business The Story of a Night Napkin on Social Media Saavn - Bira91: Hip Hop Association Rakhi with Fabelle When India Dared to Stare ITC / Fabelle Elements Mahindra First Choice / India Blue Book Godrej Consumer Products / Godrej No.1 Makkal Needhi Maiam Unilever / Lifebuoy DishTV Star Plus / Sabse Smart Kaun Patanjali Ayurved / Patanjali Mango Juice Unilever / Lifebuoy Godrej Consumer Products / HIT Yum! Brands / Pizza Hut Energizer / Stayfree B9 Beverages / Bira 91 ITC / Fabelle Elements MTV - Roadies Madison Communication Pvt. Ltd. Isobar India Mindshare India Interaction One Mindshare India Affle Mindshare India Pokkt Mindshare India Interaction One Mindshare India Interactive Avenues Pvt. Ltd. Saavn Madison Communications Pvt. Ltd. Madison Communications Pvt. Ltd. Bronze 1 1 1 1 1 1 1 1 1 1 1 1 1 1 2 3 4 5 6 7 8 9 10 11 12 13 S.No Category Entry Name Advertiser Brand Lead/Agency Product/ Services Launch Cross Media Brand Awareness Cross Mobile Integration Messaging Mobile App Advertising Mobile Social Innovation Location Based services or Targeting Mobile Audio Mobile Audio Best Brand Experiences in Mobile Rich media Most Engaging Mobile Creative BQ WhatsApp How Star India Aced Primetime TV Battle : 550,000+ New Viewers Across Three Major Shows How Google Maps Helped Consumers "Weather" the Monsoons Giving India the Sound of Friendship WhatsApping to Fitness - The Quaker Way Share a Coke Integration with hello English, SHAREit, Truecaller, Jio, Hotstar & Google Assistant #NotShaadiMaterial Google RailWifi : Leveraging MarTech to bring Wifi to the Masses Maiam Whistle How Horlicks Proved that Content Hits Home Only When Localized Activating Infection Alert System in Rural India Reebok - Floatride Rakhi with Fabelle Bloomberg | Quint 21st Century Fox / Star India Google / Google Maps Diageo India / McDowell’s No.1 Soda PepsiCo / Quaker Oats Coca-Cola India Pvt. Ltd / Coca-Cola StarPlus / Ikyawaan #NotShaadiMaterial RailTel Makkal Needhi Maiam Glaxo SmithKline Consumer Healthcare India / Horlicks Unilever / Lifebuoy Reebok ITC / Fabelle Elements Quintillion Business Media Pvt. Ltd. Zapr Media Labs Essence Mindshare India Mindshare India Interactive Avenues Pvt. Ltd. Mindshare India Essence Interaction One Mindshare India Mindshare India mCanvas Advertising Pvt. Ltd. Madison Communications Pvt. Ltd. Best in show - When India Dared to Stare Marketer of the Year -  MTV – Roadies Publisher of The Year - Flipkart Internet Pvt Ltd Agency of the Year - Mindshare India
  • 62. MMA India Board Mobile Marketing Ecosystem Report 2018, India. 60 VIKAS AGNIHOTRI Director, India Sales Google India SAMEER SINGH Chief Executive Officer - South Asia GroupM Media India Pvt Ltd. SANDEEP BHUSHAN Director, South Asia Facebook D SHIVAKUMAR Group Executive President Corporate Strategy & Business Development Aditya Birla Group ROHIT DADWAL Managing Director, Mobile Marketing Association Asia Pacific Limited JULIE BRAMHAM Chief Marketing Officer Diageo (USL) SUNIL KARTARIA Chief Executive Officer - India & SAARC Godrej Consumer Products LTD. (GCPL) PRIYA NAIR Executive Director, Home Care Hindustan Unilever Limited SAMEER PITALWALLA Co-founder & CEO Culture Machine Media Pvt. Ltd. UDAY SODHI Business Head Digital Sony Pictures Networks India Moneka Khurana Country Head MMA India Nandini Dias CEO Lodestar UM Shams Jasani Group MD Isobar South Asia Siddharth Banerjee Executive Vice President, Marketing Vodafone India Ltd. Partho Dasgupta CEO BARC India SASHI SHANKAR Chief Marketing Officer Vodafone Idea Limited VIJAY SHEKKAR SHARMA Founder One97 & Paytm ANUSHKA SHETTY CEO and Co Founder Autumn Worldwide PRASUN BASU President, South Asia Nielsen VINODH BHAT Co - founder, President & Chief Strategy officer Saavn AJIT MOHAN Chief Executive Officer, Hotstar HEMANT MEHTA Managing Director, Media, Digital & Retail, Kantar Imrb Chief Strategy Officer, Kantar, South Asia KARTHI MARSHAN Senior Executive Vice President & head, group marketing kotak