
Recommended
Recommended
More Related Content
Similar to CCD Reductions Guide: Removing Instrumental Signatures
Similar to CCD Reductions Guide: Removing Instrumental Signatures (20)
Recently uploaded
Recently uploaded (20)
CCD Reductions Guide: Removing Instrumental Signatures
- 1. A User's Guide to CCD Reductions with IRAF Philip Massey 15 Feb 1997 Contents 1 Introduction 2 2 Why Your Data Needs Work And What to Do About It 2 3 Doing It 4 3.1 Outline of Reduction Steps : : : : : : : : : : : : : : : : : : : : : : : : : : : 5 3.2 Examining Your Frames to Determine the Trim and Bias Sections : : : : : 7 3.3 Setting things up: setinstrument, parameters of ccdproc, and ccdlist : : : : 7 3.4 Combining Bias Frames with zerocombine : : : : : : : : : : : : : : : : : : : 12 3.5 The First Pass Through ccdproc : : : : : : : : : : : : : : : : : : : : : : : : 12 3.6 Constructing a bad pixel mask : : : : : : : : : : : : : : : : : : : : : : : : : 15 3.7 Dealing with The Darks : : : : : : : : : : : : : : : : : : : : : : : : : : : : 18 3.8 Combining the Flat-
- 2. eld Exposures : : : : : : : : : : : : : : : : : : : : : : 19 3.9 Normalizing Spectroscopic Flats using response : : : : : : : : : : : : : : : 19 3.10 Flat-
- 3. eld Division: ccdproc Pass 2 : : : : : : : : : : : : : : : : : : : : : : : 23 3.11 Getting the Flat-Fielding Really Right : : : : : : : : : : : : : : : : : : : : 23 3.11.1 Combing the twilight/blank-sky ats : : : : : : : : : : : : : : : : : 23 3.11.2 Creating the Illumination Correction : : : : : : : : : : : : : : : : : 25 3.12 Finishing the Flat-
- 4. elding : : : : : : : : : : : : : : : : : : : : : : : : : : : 28 3.13 Fixing Bad Pixels : : : : : : : : : : : : : : : : : : : : : : : : : : : : : : : : 29 A How Many and What Calibration Frames Do You Need? 30 B The Ins and Outs of Combining Frames 32 C Summary of Reduction Steps 35 C.1 Spectroscopic Example : : : : : : : : : : : : : : : : : : : : : : : : : : : : : 35 C.2 Direct Imaging Example : : : : : : : : : : : : : : : : : : : : : : : : : : : : 40 1
- 5. 1 Introduction This document is intended to guide you through the basic stages of reducing your CCD data with IRAF, be it spectroscopic or direct imaging. It will take you through the removal of the instrumental signature", after which you should be ready to extract your spectra or to do your photometry. Additional resources you may wish to review are: A Beginner's Guide to Using IRAF by Jeannette Barnes Once you are done with this manual you may wish to go on to do stellar photometry on direct frames or to reduce slit spectrograph data. You can
- 6. nd details and sage advise in the following sources: A User's Guide to Stellar Photometry with IRAF by Phil Massey and Lindsey Davis A User's Guide to Reducing Slit Spectra with IRAF by Phil Massey, Frank Valdes, and Jeannette Barnes Copies of all these documents are available over the net; contact the IRAFgroup for details. In Sec. 2 we will discuss whys and wherefores of CCD reductions in general terms. In Sec. 3 we will go through the actual IRAF steps involved in implementingthese reductions, using spectroscopic data as the primary example. In the Appendices we provide a guideline to what calibration data you may want to collect while you're observing (Sec. A), and discuss the nitty-gritty of the algorithms available to you in IRAF for combining images (Sec. B). Finally we close with a summary of the reduction steps for spectroscopic data (Sec. C.1) and the reduction steps for direct imaging (Sec. C.2). 2 Why Your Data Needs Work And What to Do About It This section will brie y outline how and why your CCD images need work. For a less heuristic treatment, see Sec. A, which discusses how many of what kind of calibration frames you need. Most of the calibration data is intended to remove additive eects: the electronic pedestal level (measured from the overscan region on each of your frames), the pre- ash level and/or underlying bias structure, and, if necessary, the dark current. The at-
- 7. eld data (dome or projector ats and twilight sky exposures) will remove the multiplicative gain and illumination variations across the chip. Fringes are an additive eect that must be removed last. 2
- 8. When you obtained your frames at the telescope, the output signal was biased by adding a pedestal level of several hundred ADU's. We need to determine this bias level for each frame individually, as it is not stabilized, and will vary slightly (a few ADU's) with telescope position, temperature, and who knows what else. Furthermore, the bias level is usually a slight function of position on the chip, varying primarily along columns. We can remove this bias level to
- 9. rst-order by using the data in the overscan region, the (typically) 32 columns at the right edge of your frames. o v e r s c a n c o l u m n line (row) We will average the data over all the columns in the overscan region, and
- 10. t these values as a function of line-number (i.e., average in the x direction within the overscan region, and
- 11. t these as a function of y). This
- 12. t will be subtracted from each column in your frame; this
- 13. t may be a simple constant. At this point we will chop o the overscan region, and keep only the part of the image containing useful data. This latter step usually trims o not only the overscan region but the
- 14. rst and last few rows and columns of your data. If you pre- ashed the chip with light before each exposure, there will still be a non-zero number of counts that have been superimposed on each image. This extra signal is also an additive amount, and needs to be subtracted from your data. In addition, there may be column-to-column variation in the structure of the bias level, and this would not have been removed by the above procedure. To remove both the pre- ash (if any) and the residual variation in the bias level (if any) we will make use of frames that you have obtained with a zero integration time. These are referred to in IRAF as zero frames but are called bias frames in KPNO and CTIO lingo. We need to average many of these (taken with pre- ash if you were using pre- ash on your object frames), process the average as described above, and subtract this frame from all the other frames. Dark current is also additive. On some CCD's there is a non-negligible amount of background added during long exposures. If necessary, you can remove the dark current to
- 15. rst-order by taking dark exposures (long integrations with the shutter closed), 3
- 16. processing these frames as above, and then scaling to the exposure time of your program frames. However, it's been my experience that the dark current seldom scales linearly, so you need to be careful. Furthermore, you will need at least 3 dark frames in order to remove radiation events (cosmic rays), and unless you have a vast number of dark exposures to average you may decrease your signal-to-noise; see the discussion in Sec. A. The bottom line of all this is that unless you really need to remove the dark current, don't bother. The next step in removing the instrumental signature is to at-
- 17. eld your data. The variations in sensitivity are multiplicative, and we need to divide the data by the at-
- 18. eld to remove the pixel-to-pixel gain variations, and (in the case of long-slit spectroscopy and direct imaging) the larger-scale spatial variations. If you are doing direct imaging, or plan to ux calibrate your spectroscopic data, then you are probably happy to just normalize the at-
- 19. eld exposures to some average value, but if you are interested in preserving counts for the purposes of statistics in spectroscopic data we may want to
- 20. rst
- 21. t a function to remove the color of the lamp. The
- 22. nal step in the at-
- 23. elding process is to see if your twilight sky exposures have been well attened by this procedure|if not, we may have to correct for any remaining illumination gradients. Some CCDs have a few pixels and/or partial columns where the response to light is not linear. For direct imaging one is usually happy to leave these bad regions alone: they're perfectly apparent on the reduced frames. But for spectroscopic reductions you may want to interpolate over these bad pixels. This step is known as
- 24. xing bad pixels, and there are some new, powerful tools for constructing bad pixel maps and then applying the interpolation. Finally, if you have broadband direct images and absolutely must remove fringes, then this will be your last step. but it will be a long and lonely one|IRAF currently doesn't provide much help. The fringe pattern is an additive eect, and must be subtracted from each program frame that is aected. This means that you will
- 25. rst have to construct master fringe frames for each
- 26. lter you are planning to defringe. If the fringe pattern on your frames simply scaled with exposure time, you would now be able to process your data, but in fact fringes are caused by night-sky lines that may change quite drastically in intensity through out the night. Thus for each and every aected program frames, you will have to manually determine what additional scaling factor is needed to adequately remove the fringes. 3 Doing It Throughout this section we will assume that you know how to examine the hidden pa- rameters in an IRAF task, how to change these parameters, and how to execute the task. If you don't know this already, read the A Beginner's Guide to IRAF mentioned above, 4
- 27. and sit down with someone who knows all this stu and have him or her give you a crash course. Everyone seems to have his or her own style of doing these things: I always like to start out by invoking the task parameter editor epar taskname, setting all the parameters, and exiting with a :go in order to make darn sure that I have everything set the way I thought I did. We will often call on the IRAF ccdred routines for combining frames in various ways. There are a number of very sophisticated algorithms for doing this. Details can be found by doing a help combine from within IRAF; for convenience, there is a short summary of the nitty-gritty of these various options given in Sec. B. 3.1 Outline of Reduction Steps The steps we will go through in order to process CCD frames are the following: Examine a at
- 28. eld exposure using implot and determine the area of the chip that contains good data and the area of the chip that contains good overscan informa- tion. Set up the translation table for the image headers by running setinstrument; this will also set various defaults within the ccdred package. Enter the proper biassec and trimsec into ccdproc at this time. Substantiate that the header translations are valid by running ccdlist. Combine the individual bias frames using zerocombine to produce an averaged, combined bias image (Zeron3, for example). Process all the frames to remove the overscan and average bias, and to trim the images (
- 29. rst pass through ccdproc). Be sure that you have the appropriate switch settings (overscan+, trim+, zerocor+, darkcor-, atcor-, illum-, fring-, and that the name of the combined bias frame has been entered for the zero calibration image (zero=Zeron3, say). For spectroscopic applications, you may want to construct a bad pixel map at this point. We recommend taking
- 30. ve long-exposure ( 3000 e/pixel) ats and 20-30 short-exposure ( 50-100 e/pixel) ats (either dome ats or projector ats); combin- ing each group using atcombine; dividing one by the other; and running ccdmask (currently in the nmisc package) with its default setting. We will use this bad pixel map (badmap, say) at the end. Be sure to stick these images in where the subse- quent reduction steps won't aect them, such as a subdirectory. Note that this does not use the
- 31. xpix option in ccdproc itself, but relies on the newer (and not yet integrated) routines in the nmisc package. These are available as add-ons, if they are not already in your installation. 5
- 32. If you are concerned about dark current: { Combine your dark frames using darkcombinewith scale=exposure; call the combined image Darkn3, for example. { Examine the combined dark exposure and decide if you want to use it or not. { If you do want to use it, run everything through ccdproc again, this time specifying darkcor+ and dark=Darkn3, for example. Combineyour at-
- 33. eld exposures using atcombinescale=modereject=crreject gain=gain rdnoise=rdnoise. This will reject cosmic rays and scale by the mode. (optional) For spectroscopic data, normalize the combined at-
- 34. eld exposure along the dispersion axis by dividing it by a low-order
- 35. t using response in the twod- spec.longslit package. Process all the program frames and sky ats using the combined at-
- 36. eld exposures: ccdproc *.imh ccdtype= atcor+ at=Flat*.imh (If you used response for your spectroscopic data, be sure to specify the normalized image as the at-
- 37. eld.) This will atten your data to the
- 38. rst approximation (second pass through ccdproc). Do the
- 39. nal attening correction on your data as follows: { Examine your longest exposures (or at least the ones with the most sky) in each
- 40. lter using display and imexamine to determine if your at-
- 41. eld exposures did an adequate job attening your data. Are there signi
- 42. cant gradients ( 1%) present in your sky values in direct imaging data? Is the spatial cut in spectroscopic data at? { If you need to correct your data for any illumination problems revealed by the previous step create an illumination correction: Combineanyblank-sky or twilightframeswith combine,scaling and weight- ing by the mode. For spectroscopic data, use illum in the longslit.twodspec package to create a slit function illumination correction from the combined sky at. For direct imaging, use mkskycor on your combined twilight or blank-sky ats to create a smooth illumination correction. { Finish attening your data by turning on the illumination correction switch and specifying these illumination function in ccdproc (third and
- 43. nal pass). For spectroscopic applications, you may wish to
- 44. x bad pixels as a
- 45. nal step: run
- 46. xpixin the nmiscpackage, using badmapas the mask, and leaving things at their default setting (linterp=1, cinterp=2). 6
- 47. 3.2 Examining Your Frames to Determine the Trim and Bias Sections The
- 48. rst step in reducing your data is to decide what part of the chip contains useful data, and exactly where the overscan region is and what part of it you want to use for determining the
- 49. t to the bias-level. The ccdred package knows these two regions as trimsec, the section of the raw image that will be saved, and biassec, the section of the raw image that will be used to
- 50. t the bias-level. As a reminder, IRAF uses the notation imagename[x1:x2,y1:y2] to describe that part of the image that goes from column x1 to column x2, and from row y1 to row y2. If you are using one of the Kitt Peak or Tololo chips, and have relatively recent data, you will
- 51. nd image sections listed for TRIMSEC and BIASSEC in your headers. Pick an image and do an imhead imagename l+ j lprint to get a printed listing of everything in the header. An example is shown in Figure 1. If you are doing direct imaging and you have these things in your header, you probably can ignore the rest of this section. Still, it wouldn't hurt you to make a few plots of your at-
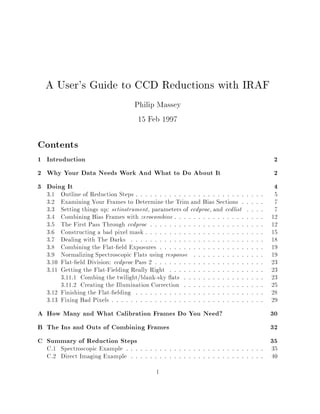
- 52. eld data to make sure that no one was being wildly conservative when they assigned a TRIMSEC to your chip. If we do an implot n30010 we will get a plot across the middle line. An :a 10 command will tell it to average 10 rows or columns (whichever it is about to plot); a :c 250 would then plot 10 columns centered on column 250. Similarly a :l 300 would plot 10 lines centered on line number 300. You can expand by placing the cursor on the lower-left corner of the region you want to expand and hitting e (that's a lower-case e), and then placing the cursor in the upper-right corner of the region you wish to expand and hitting any key. A C will tell you the cursor position|but you may have to type it twice. A space bar [amazing!] will also do this, kind of. You can also expand with an E (upper-case E) but you will then have to follow this with an A to get a scale. The plots (Fig. 2) reveal that the
- 53. rst few rows of our chip were not illuminated, and that the last few columns (3065-3072) are not good. We decide to keep the section [1:3064,10:101] for our TRIMSEC. Note that if had the slit extended over the entire chip format, we would in fact have been happy with the defaults in the header, [1:3064, 1:101]. In addition, the BIASSEC (=[3074:3104,1:101] appears to be
- 54. ne. For direct imaging, the header values for BIASSEC and TRIMSEC are usually correct. 3.3 Setting things up: setinstrument, parameters of ccdproc, and ccdlist The reduction of our CCD data mostly takes place within the ccdred package. The tasks in this package rely heavily on the image headers to get everything right, so our
- 55. rst operation has to be to set up the translation table between the header information and things that ccdred will want to know, such as what a zero frame is called, what 7
- 56. n30010[3104,101][short]: flat grat 23.75 grat 35 Red. Very. No bad pixels, no histogram, min=unknown, max=unknown Line storage mode, physdim [3328,101], length of user area 1339 s.u. Created Sat 19:26:33 18-Apr-92, Last modified Sat 19:26:34 18-Apr-92 Pixel file 'tofu!/data1/massey/pixels/n30010.pix' [ok] New copy of dum$n30010.imh OBJECT = 'flat grat 23.75 grat 35 Red. Very.' / OBSERVAT= 'KPNO ' / observatory OBSERVER= 'Jacoby/Massey/Silva' / COMMENTS= 'TE WCAM ' / comments EXPTIME = 10. / actual integration time DARKTIME= 10. / total elapsed time IMAGETYP= 'flat ' / object, dark, bias, etc. DATE-OBS= '18/04/92 ' / date (dd/mm/yy) of obs. UT = '22:55:42.00 ' / universal time ST = '05:18:31.00 ' / sidereal time RA = '01:50:19.00 ' / right ascension DEC = '12:59:58.00 ' / declination EPOCH = 1992.3 / epoch of ra and dec ZD = '51.230 ' / zenith distance AIRMASS = 1.6 / airmass TELESCOP= 'kp09m ' / telescope name DETECTOR= 'gcam ' / detector PREFLASH= 4 / preflash time, seconds GAIN = 4.5 / gain, electrons per adu DWELL = 5 / sample integration time CAMTEMP = -89 / camera temperature DEWTEMP = -169 / dewar temperature BIASSEC = '[3074:3104,1:101] ' / overscan portion of frame TRIMSEC = '[1:3064,1:101] ' / region to be extracted DATASEC = '[1:3072,1:101] ' / image portion of frame CCDSEC = '[1:3072,450:550] ' / orientation to full frame ORIGSEC = '[1:3072,1:1024] ' / original size full frame CCDSUM = '1 1 ' / on chip summation INSTRUME= 'test ' / instrument DISPERSE= '26 ' / disperser TILTPOS = '16.5 ' / tilt position POSANGLE= '0 ' / position angle DISPAXIS= '1 ' / dispersion axis FILTERS = '0 ' / filter position Figure 1: A sample of a long header. Note the values for TRIMSEC and BIASSEC. 8
- 57. Figure 2: Plots through a at-
- 58. eld exposure. Note the rather severe fringing evident in the at-
- 59. eld exposure along the dispersion axis. These will hopefully come out in the at
- 60. elding. 9
- 61. cc setinstrument Instrument ID (type ? for a list) (?): ? direct Current headers for Sun plus CCDPROC setup for direct CCD specphot Current headers for Sun plus CCDPROC setup for spectropho- tometry, ie GoldCam, barefoot CCD foe Current headers for Sun plus CCDPROC setup for FOE fibers Current headers for Sun plus CCDPROC setup for fiber array coude Current headers for Sun plus CCDPROC setup for Coude cyrocam Current headers for Sun plus CCDPROC setup for Cryo Cam echelle Current headers for Sun plus CCDPROC setup for Echelle kpnoheaders Current headers with no changes to CCDPROC parameters fits Mountain FITS header prior to Aug. 87 (?) camera Mountain CAMERA header for IRAF Version 2.6 and earlier Instrument ID (type q to quit): specphot Figure 3: Possible answers to setinstrument. The user has chosen the specphot default. distinguishes a U
- 62. lter at-
- 63. eld from a R
- 64. lter at-
- 65. eld, and so on. The command for setting up this translation
- 66. le is setinstrument in the ccdred package. So load noao, imred, and ccdred, and then type setinstrument. If you type a ? you will get the list shown in Figure 3. In this case we are trying to reduce spectroscopic data taken with the FORD 3K1K chip (formatted to 3072 101) in the Kitt Peak 0.9m spectrometer WhiteCam (=GoldCam, but on the White Spectrograph). We select specphot as good generic spectroscopic defaults. As soon as you do this you will
- 67. nd yourself in the parameter editor staring at the page for the entire package ccdred. The only thing to check at this point is that the pixel type of the output images, and the pixel type that will be used in our calculations, are both real. If you want to keep your output images in 16-bit short integer format, you should nevertheless retain the calculation type to be real or serious problems may occur when you do at-
- 68. eld division. Getting out of this with a CNTL-Z will put us in the parameter editor for the ccdproc task (Fig. 6). This task is what we will use for doing the image crunching|removing bias, trimming, and at
- 69. eld division. At this point we should enter the values for the biassec and trimsec parameters. Note that the default (for specphot) is that biassec=image, which is correct|we are perfectly happy with the answer we found in the image header above for the bias-section ([[3074:3104,1:101]). We need to explicitly enter the value for the trim-section, however, as [1:3064,10:101]. Had we selected, say, direct rather than specphot, the values both for biassec and trimsecwould have defaulted to image, would probably have been correct. Rather than worry about the other parameters now, let us simplyexit with a CNTL-Z. Did setinstrument do its job in setting up the translation table? To check this, we can run ccdlist on our images to see if IRAF is going to successfully recognize the type 10
- 70. n30004.imh[3104,101][short][comp][0]:comp 23.75 gr 35 n30007.imh[3104,101][short][flat][0]:flat grat 23.75 grat 35 Red. Very. n30008.imh[3104,101][short][flat][0]:flat grat 23.75 grat 35 Red. Very. n30009.imh[3104,101][short][flat][0]:flat grat 23.75 grat 35 Red. Very. n30010.imh[3104,101][short][flat][0]:flat grat 23.75 grat 35 Red. Very. n30011.imh[3104,101][short][flat][0]:flat grat 23.75 grat 35 Red. Very. n30012.imh[3104,101][short][flat][0]:flat grat 23.75 grat 35 Red. Very. n30013.imh[3104,101][short][zero][0]:zeron3 n30014.imh[3104,101][short][zero][0]:zeron3 n30015.imh[3104,101][short][zero][0]:zeron3 n30016.imh[3104,101][short][zero][0]:zeron3 n30017.imh[3104,101][short][zero][0]:zeron3 n30018.imh[3104,101][short][zero][0]:zeron3 n30019.imh[3104,101][short][zero][0]:zeron3 n30020.imh[3104,101][short][zero][0]:zeron3 n30021.imh[3104,101][short][zero][0]:zeron3 n30022.imh[3104,101][short][zero][0]:zeron3 n30023.imh[3104,101][short][object][0]:sky n30024.imh[3104,101][short][object][0]:sky n30031.imh[3104,101][short][comp][0]:comp after tour group n30033.imh[3104,101][short][flat][0]:pflat near zenith n30034.imh[3104,101][short][flat][0]:pflat at F66 n30035.imh[3104,101][short][flat][0]:pflat near zenith n30036.imh[3104,101][short][object][0]:F66 way in the red n30037.imh[3104,101][short][object][0]:pflat near zenith n30038.imh[3104,101][short][object][0]:pflat near zenith n30039.imh[3104,101][short][object][0]:F66 n30040.imh[3104,101][short][object][0]:F67 in da red! n30041.imh[3104,101][short][object][0]:beta leo (std) n30042.imh[3104,101][short][flat][0]:project flat beta leo n30043.imh[3104,101][short][flat][0]:project flat eta UMa n30044.imh[3104,101][short][object][0]:eta UMa [more] Figure 4: Sample outputs from ccdlist. of image (object, comp, at, zero) and the
- 71. lter number (for direct imaging). So we will want to say ccdlist *.imh at this point to get a list like that shown in Figure 4. Note that in the case of the spectroscopy example shown here the
- 72. lter numbers are all [0], but in the case of direct imaging the
- 73. lter numbers correspond to the
- 74. lter bolt positions. The image type (zero, at, object, comp) are also shown. These must be right if the tasks in ccdred are to succeed. The things you should check at this point are whether the
- 75. lter numbers are correct (that number in square brackets), and whether the object types make sense. If they don't, there is some inconsistency between the keywords in your headers, and the translation table set up by your having run setinstrument. If you are stuck, try looking at a long version of your headers (imhead *.imh l+ j page) and then nose around by doing a dir ccddb$kpno/* until you
- 76. nd a
- 77. le that will provide an appropriate translation. If you are reducing non-KPNO/CTIO data and have dierent key-words for ats and 11
- 78. bias's and so on, you will need to set up your own translation
- 79. le; just follow the examplein ccddb$kpno/direct.dat, say. If you don't have the necessary information (really just the image type and
- 80. lter numbers) you can add this information using ccdhedit; the best way would be to put the names of all the biases in a
- 81. le bias
- 82. le, say, and then do a ccdhedit @bias
- 83. le imagetype zero; other examples can be found by doing a help ccdhedit. If you are going to be subtracting darks you are also going to need to translate some exposure time into the word darktime so that ccdproc can scale the darks. If you want to use a superior combining algorithm, it would also be convenient to have the read-noise (in electrons) and gain (in electrons/ADU) in your headers, although you could simply enter these values in the various combining tasks. 3.4 Combining Bias Frames with zerocombine For our next act we want to combine the bias frames into an average frame. To combine the bias frames we will use zerocombine with the parameters shown in Figure 5. The default parameters will result in all the images with type zero being averaged together, but with the highest value being ignored when forming the average for any given pixel. In other words, if you have 10 bias frames, 9 will be averaged in producing the value for each pixel in the image Zeron3, ignoring the highest value at each pixel. (The various options available for combining images are discussed in Sec. B). This option will do a good job of keeping radiation events out of your average bias frame. Note that even though the images were short integer (16-bit) to start out with, the averaging will be done as reals (32-bit) and that your
- 84. nal image, Zeron3, will be a 32-bit real image. The output will look like that shown in Figure 5, in which we see that zerocombine has successfully picked up all the right images and averaged them together using the minmax option. 3.5 The First Pass Through ccdproc We are now ready to process our data through ccdproc in order to do the simple stu: we will subtract the pedestal determined from the overscan region, remove any remaining bias structure, and trim the image. Edit the parameters for ccdproc as shown in Fig. 6, making sure that the switches overscan, trim, and zerocor are on, but that darkcor, atcor, and illumcorare o. Check that the correct values have been entered for biassec and trimsec. Finally, edit in the name of the combined bias frame as the zero image. When we run ccdproc we will be asked if we want to
- 85. t the overscan vector interac- tively. The
- 86. rst couple of times through, answer yes, and you will see a plot something like that shown in Fig. 7. The
- 87. t shown in Fig. 7 is somewhat unusually at. It is not unusual for bigger chips to exhibita gradient of an ADU or two fromone end to the other. However,even in these cases one might want to retain a single scalar (order=1) as the
- 88. t, as we will be subtracting o 12
- 89. PACKAGE = ccdred TASK = zerocombine input = n3*.imh List of zero level images to combine (output = Zeron3) Output zero level name (combine= average) Type of combine operation (reject = minmax) Type of rejection (ccdtype= zero) CCD image type to combine (process= no) Process images before combining? (delete = no) Delete input images after combining? (clobber= no) Clobber existing output image? (scale = none) Image scaling (statsec= ) Image section for computing statistics (nlow = 0) minmax: Number of low pixels to reject (nhigh = 1) minmax: Number of high pixels to reject (mclip = yes) Use median in sigma clipping algorithms? (lsigma = 3.) Lower sigma clipping factor (hsigma = 3.) Upper sigma clipping factor (rdnoise= 0.) ccdclip: CCD readout noise (electrons) (gain = 1.) ccdclip: CCD gain (electrons/DN) (pclip = -0.5) pclip: Percentile clipping parameter (mode = ql) cc zerocombine List of zero level images to combine (n3*.imh): Apr 20 13:34: IMCOMBINE combine = average reject = minmax, nlow = 0, nhigh = 1 blank = 0. Images n30013.imh n30014.imh n30015.imh n30016.imh n30017.imh n30018.imh n30019.imh n30020.imh n30021.imh n30022.imh Output image = Zeron3, ncombine = 10 Figure 5: Parameters and Output of zerocombine. 13
- 90. PACKAGE = ccdred TASK = ccdproc images = n3*.imh List of CCD images to correct (ccdtype= ) CCD image type to correct (max_cac= 0) Maximum image caching memory (in Mbytes) (noproc = no) List processing steps only? (fixpix = no) Fix bad CCD lines and columns? (oversca= yes) Apply overscan strip correction? (trim = yes) Trim the image? (zerocor= yes) Apply zero level correction? (darkcor= no) Apply dark count correction? (flatcor= no) Apply flat field correction? (illumco= no) Apply illumination correction? (fringec= no) Apply fringe correction? (readcor= no) Convert zero level image to readout correction? (scancor= no) Convert flat field image to scan correction? (readaxi= line) Read out axis (column|line) (fixfile= ) File describing the bad lines and columns (biassec= image) Overscan strip image section (trimsec= [1:3064,10:101]) Trim data section (zero = Zeron3) Zero level calibration image (dark = ) Dark count calibration image (flat = ) Flat field images (illum = ) Illumination correction images (fringe = ) Fringe correction images (minrepl= 1.) Minimum flat field value (scantyp= shortscan) Scan type (shortscan|longscan) (nscan = 1) Number of short scan lines (interac= yes) Fit overscan interactively? (functio= chebyshev) Fitting function (order = 1) Number of polynomial terms or spline pieces (sample = *) Sample points to fit (naverag= 1) Number of sample points to combine (niterat= 1) Number of rejection iterations (low_rej= 3.) Low sigma rejection factor (high_re= 3.) High sigma rejection factor (grow = 1.) Rejection growing radius (mode = ql) Figure 6: The parameters for ccdproc. We have left the parameter biassec equal to image to use the region listed in the header, but explicitly stated the image section to use for trimming (trimsec). We have inserted the name of the combined bias image as the zero image. 14
- 91. Figure 7: The overscan region for this chip is exceptionally well behaved, and a constant value is an excellent
- 92. t. However, one should not exceed a straight-line
- 93. t (:order 2 followed by an f) if one can help it. the combined bias frame. Thus any residuals not removed by
- 94. tting the overscan region will probably be removed in subtracting the combined bias frame: remember, the overscan region exists in order to monitor things that change from exposure to exposure|such as small dierences in the pedestal level. If you were to
- 95. nd that you had dierent gradients from frame to frame, then you would want to use a higher order
- 96. t| but still maybe nothing higher than a straight line. (You can change the order while looking at the plot by doing a :order 2, say, followed by an f for a new
- 97. t. The new order will be retained for subsequent frames.) After you have looked at a few of the overscan plots, answer NO (note the capitals) to the question Fit overscan vector for bleh-bleh interactively?. Fig 8 shows the output from this
- 98. rst pass through ccdproc. Note that ccdproc is smart enough to know what steps have and haven't been done| you are never in any danger of redoing a particular step. If you were to rerun ccdproc at the end of this step, without changing any of the switches, nothing would happen. However, if you were to turn other switches on (such as at-
- 99. eld division!) those steps would then take place. 3.6 Constructing a bad pixel mask For spectroscopic applications, we may wish to interpolate over bad pixels. By bad pixels we mean pixels|usually partial columns|that are nonlinear. For this, we use (a) a series of exposures of a projector lamp or dome at that were exposed at a high enough level to have lots of counts|perhaps several thousand electrons per pixel, and (b) a series of exposures of the same type but at a much lower count-level: say 50-100 electrons per 15
- 100. n30004.imh: Apr 21 15:02 Trim data section is [1:3064,10:101] Fit overscan vector for n30004.imh interactively (yes): n30004.imh: Apr 21 15:06 Overscan section is [3074:3104,1:101] with mean=285.2577 Zeron3: Apr 21 15:06 Trim data section is [1:3064,10:101] Fit overscan vector for Zeron3 interactively (yes): Zeron3: Apr 21 15:06 Overscan section is [3074:3104,1:101] with mean=285.8963 n30004.imh: Apr 21 15:06 Zero level correction image is Zeron3 n30007.imh: Apr 21 15:06 Trim data section is [1:3064,10:101] Fit overscan vector for n30007.imh interactively (yes): NO n30007.imh: Apr 21 15:14 Overscan section is [3074:3104,1:101] with mean=286.9531 n30007.imh: Apr 21 15:14 Zero level correction image is Zeron3 n30008.imh: Apr 21 15:14 Trim data section is [1:3064,10:101] n30008.imh: Apr 21 15:14 Overscan section is [3074:3104,1:101] with mean=287.0747 n30008.imh: Apr 21 15:14 Zero level correction image is Zeron3 n30009.imh: Apr 21 15:14 Trim data section is [1:3064,10:101] n30009.imh: Apr 21 15:14 Overscan section is [3074:3104,1:101] with mean=287.1335 n30009.imh: Apr 21 15:14 Zero level correction image is Zeron3 n30010.imh: Apr 21 15:14 Trim data section is [1:3064,10:101] n30010.imh: Apr 21 15:14 Overscan section is [3074:3104,1:101] with mean=287.0952 n30010.imh: Apr 21 15:14 Zero level correction image is Zeron3 n30011.imh: Apr 21 15:14 Trim data section is [1:3064,10:101] n30011.imh: Apr 21 15:14 Overscan section is [3074:3104,1:101] with mean=287.0601 n30011.imh: Apr 21 15:14 Zero level correction image is Zeron3 n30012.imh: Apr 21 15:14 Trim data section is [1:3064,10:101] n30012.imh: Apr 21 15:14 Overscan section is [3074:3104,1:101] with mean=287.1636 n30012.imh: Apr 21 15:14 Zero level correction image is Zeron3 n30013.imh: Apr 21 15:14 Trim data section is [1:3064,10:101] n30013.imh: Apr 21 15:14 Overscan section is [3074:3104,1:101] with mean=286.3238 [more] Figure 8: Output from this
- 101. rst pass through ccdproc. 16
- 102. pixel. Combine each group using atcombine, being careful to keep the long exposures and the short exposures separately. Divide one by the other to reveal the non-linear pixels. The nmisc routine ccdmask will construct a bad pixel map. This map will be the same size as the data images, with values of 0 for normal pixels, 1 for regions where the skinny direction (the direction over which we wish to interpolate) is a line, and a 2 where the skinny direction is across a column. Be sure to move all of these images (and particularly the mask!) into a subdirectory where subsequent reductions won't aect them. The steps involved in making a bad pixel map and preserving it would be something like the following, if a0001-5 were your long exposures and a0006-a0019 were your short exposures.
- 103. les a0001,a0002,a0003,a0004,a0005 long ats
- 104. les a0006,a0007,a0008,a0009,a001* short ats atcombine@long atsout=FlatLreject=crrejectscale=moderdnoise=rd- noise gain=gain atcombine@short atsout=FlatSreject=crrejctscale=moderdnoise=rd- noise gain=gain imarith FlatL / FlatS Flatdiv nmisc unlearn ccdmask ccdmask Flatdiv mask=badmap display FlatL 1 display Flatdiv 2 display badmap 3 imdelete @long ats,@short ats,FlatL,FlatS mkdir calib imrename badmap calib/badmap 17
- 105. PACKAGE = ccdred TASK = darkcombine input = n3*.imh List of dark images to combine (output = Darkn3) Output flat field root name (combine= average) Type of combine operation (reject = minmax) Type of rejection (ccdtype= dark) CCD image type to combine (process= yes) Process images before combining? (delete = no) Delete input images after combining? (clobber= no) Clobber existing output image? (scale = exposure) Image scaling (statsec= ) Image section for computing statistics (nlow = 0) minmax: Number of low pixels to reject (nhigh = 1) minmax: Number of high pixels to reject (mclip = yes) Use median in sigma clipping algorithms? (lsigma = 3.) Lower sigma clipping factor (hsigma = 3.) Upper sigma clipping factor (rdnoise= 0.) ccdclip: CCD readout noise (electrons) (gain = 1.) ccdclip: CCD gain (electrons/DN) (pclip = -0.5) pclip: Percentile clipping parameter (mode = ql) Figure 9: Parameters for darkcombine. 3.7 Dealing with The Darks We argued earlier that the dark current is unlikely to be signi
- 106. cant, but it wouldn't kill us to check that. We have already removed the the overscan and bias level from our dark exposures, so any counts we see on the dark frames are probably real dark current (or a light leak!). We can either examine an individual dark exposure, or combine our dark exposures using darkcombine. The parameters for darkcombine are shown in Fig. 9. The reject algorithm chosen is again the simplest (and safest); we throw away the highest value at each pixel in constructing the average by specifying minmaxwith nlow=0and nhigh=1; see Sec. B for more details. Note that darkcombineis smartenough to selectonly darkframes|and furthermore, will combine them scaling by the exposure times if they are dierent. Examine your dark exposure by using display and imexamine. Are there signi
- 107. cant counts there? If the answer is yes, we could choose to do the dark scaling and subtraction now: simply run ccdproc n3*.imh darkcor+ dark=Darkn3 18
- 108. 3.8 Combining the Flat-
- 109. eld Exposures We next want to combine the at-
- 110. eld exposures. For direct imaging a separate at-
- 111. eld image is needed for each
- 112. lter. Fortunately, the ccdred tasks pays attention to the subset parameter, which, for direct imaging, is de
- 113. ned in terms of the
- 114. lter position. (For coude data, the subsect parameter is the grating position, gratpos, which makes sense.) The parameters for the atcombine task are shown in Fig. 10. The reject option is now set to crreject rather than the minmax option used for the bias frames; this will do a
- 115. ne job of removing any radiation events from your at-
- 116. eld exposures. (You could have equally well used avsigclip, in which case the typical sigma would have been determined from the data itself rather than an a priori knowledge of the noise characteristics of your CCD; see Sec. B for more details.) However, none of these options would work right if the data had not
- 117. rst been processed. Note that we have decided not to use as input simply n3*.imh for running atcom- bine; if you refer back to Fig. 4 you will see that there are actually projector ats taken at each new telescope position, in addition to the dome- ats exposures (n30007-12). Until we have reduced these data we do not know exactly the best way to remove the horrendous fringing pattern evident in Fig. 2, but for now we simply want to use the dome- ats. When we run atcombine we will see output like that in Fig. 10. The default parameter of atcombine also called for scaling each of the individual frames by the [inverse] of the mode. This then allows for the possibility that lamps pro- viding the at-
- 118. eld illumination have varied during the series of exposures|usually a true assumption! By scaling these to some common value one obtains a less biased average given that we are rejecting some pixels. Had we been doing direct imaging through a variety of dierent
- 119. lters, we would have obtained one averaged at-
- 120. eld exposure for each
- 121. lter; atcombine would have (by default) used the
- 122. lter number shown by ccdlist to decide what to combine with what. 3.9 Normalizing Spectroscopic Flats using response For direct imaging at-
- 123. elds, the only normalization we want to do is to divide the at by the average value before at-
- 124. eld division so that we roughly preserve the correct counts in our objects. This will happen automatically when we use ccdproc for at-
- 125. eld division. For spectroscopic data, however, we might elect to also take out some of the shape of the at-
- 126. eld lamp along the dispersion axis. One has to be very careful here that one does not do more harm than good, however, in
- 127. tting the at-
- 128. eld. We would like to remove the large-scale, wavelength-dependent structure that is peculiar to the at-
- 129. eld itself, e.g., removing bumps and wiggles which are found in the at-
- 130. eld source but not found in the stellar or sky spectrum. These bumps, wiggles, and color eects can exist due to (a) the lamps being of a very dierent temperature than the celestial sources you are observing, 19
- 131. PACKAGE = ccdred TASK = flatcombine input = n3000*,n3001* List of flat field images to combine (output = Flat) Output flat field root name (combine= average) Type of combine operation (reject = crreject) Type of rejection (ccdtype= flat) CCD image type to combine (process= yes) Process images before combining? (subsets= yes) Combine images by subset parameter? (delete = no) Delete input images after combining? (clobber= no) Clobber existing output image? (scale = mode) Image scaling (statsec= ) Image section for computing statistics (nlow = 1) minmax: Number of low pixels to reject (nhigh = 1) minmax: Number of high pixels to reject (mclip = yes) Use median in sigma clipping algorithms? (lsigma = 3.) Lower sigma clipping factor (hsigma = 3.) Upper sigma clipping factor (rdnoise= rdnoise) ccdclip: CCD readout noise (electrons) (gain = gain) ccdclip: CCD gain (electrons/DN) (pclip = -0.5) pclip: Percentile clipping parameter (mode = ql) cc flatcombine List of flat field images to combine (n3000*,n3001*): Apr 22 10:55: IMCOMBINE combine = average reject = crreject, mclip = yes, rdnoise = rdnoise, gain = gain, hsigma = 3. blank = 0. Images Mode Rdnoise Gain Scale n30007.imh 15172. 4. 4.2 0.985 n30008.imh 14959. 4. 4.2 0.999 n30009.imh 15010. 4. 4.2 0.996 n30010.imh 14787. 4. 4.2 1.011 n30011.imh 14962. 4. 4.2 0.999 n30012.imh 14821. 4. 4.2 1.009 Output image = Flat0, ncombine = 6 Figure 10: Parameters and Output for atcombine. 20
- 132. PACKAGE = longslit TASK = response calibrat= Flat0 Longslit calibration images normaliz= Flat0 Normalization spectrum images response= nFlat0 Response function images (interac= yes) Fit normalization spectrum interactively? (thresho= INDEF) Response threshold (sample = *) Sample of points to use in fit (naverag= 1) Number of points in sample averaging (functio= spline3) Fitting function (order = 1) Order of fitting function (low_rej= 3.) Low rejection in sigma of fit (high_re= 3.) High rejection in sigma of fit (niterat= 1) Number of rejection iterations (grow = 0.) Rejection growing radius (graphic= stdgraph) Graphics output device (cursor = ) Graphics cursor input (mode = ql) Figure 11: Parameters for response in the twodspec.longslit package. (b) transmission features in any color-balance
- 133. lters used with the projector lamps, and (c) the wavelength-dependence re ectivity of whatever you are shining the project lamps on. The task response in the twodspec.longslit package allows us to interactively
- 134. t a function in the dispersion direction. The output of this task is an image that is the ratio of the at to the
- 135. t; e.g., one can use the
- 136. t to take out large-scale variations in the wavelength direction. The
- 137. t is performed by
- 138. rst summing all the rows or columns (depending on whether the dispersion goes along columns or rows) of the spatial axis, so that you are not aecting the slit illumination function. To run response, load twodspec and then longslit. The parameters for response are shown in Fig. 11. Note that some of the parameters (namely the low reject and high reject) have been changed from their defaults. Note also that the normalization spectrum should be set equal to the calibration spectrum, Flat0 in this case. The output image will be called nFlat0. When we run response, we are confronted by a plot such as that shown in Fig. 12. We
- 139. nally choose an order=6 cubic spline as the
- 140. t to the at-
- 141. eld. The case we are using to illustrate this manual with is, admittedly, a particularly grungy one. You are unlikely to encounter a at-
- 142. eld this bad under normal observing conditions (unless you too decide to observe out to 1.1 m with a thinned chip). We won't know until we do the processing in the next step, but our choice of order 6 seems reasonable|the fringes are not
- 143. t, but the large-scale features of the lamp are being
- 144. t. 21
- 145. Figure 12: The top plot shows the
- 146. t of an order=1 cubic spline on the at-
- 147. eld data. The middle plot shows an order=6
- 148. t obtained by typing a :order 6 followed by an f. The bottom plot shows the ratio of the data to the
- 149. t, which can be viewed by hitting the j key. An h brings back the data vs. pixel number plot. For more information do a help ic
- 150. t. 22
- 151. 3.10 Flat-
- 152. eld Division: ccdproc Pass 2 We now will make our second pass through ccdproc, this time letting it do the at-
- 153. eld division. Although we will be overwriting the images (it's hard to avoid this in ccdproc), this step is still perfectly reversible, and if we
- 154. nd that we need additional corrections to the at-
- 155. elds, that is easily made by a third pass through ccdproc. So we
- 156. rst edit the parameters of ccdproc to turn on atcor and to explicitly give it the correct name of the at-
- 157. elds, which in this case is the normalize output from response: nFlat0. The parameters are shown in Fig. 13 In the case of direct imaging we would likelyhave set the at-
- 158. eld names to Flat*.imh. See Sec. C.2 for a full example. 3.11 Getting the Flat-Fielding Really Right How well did we do on our at-
- 159. elding? We need to now really look at our data to evaluate this. Start with a long exposure (something containing lots of sky) and display it and use imexamineto make cuts at various places on the images. For spectroscopic data, we want to mainly see that the spatial cut is uniform. For the data reduced here, our longest exposure was none too long. The left plot in Fig. 14 shows the sky averaged over many columns for the longest exposure. This plot was made by using implot imagename and then an :a 100 and a :c 1500 to plot the average of 100 columns centered on column 1500. We can see that we don't have many counts in the sky! However, it does look like the right side is a bit lower than the left side. We next examine one of our twilight sky exposures. This is shown in the right panel of Fig. 14. In this spatial cut there is a clear gradient present, although it is only 2% from one side to the other. This is consistent with what we see in the exposure of the object, however, and we decide to remove it. 3.11.1 Combing the twilight/blank-sky ats In order to determine the slit illumination function more accurately than that likely to be achieved with the dome at-
- 160. eld, two exposures of the sky were obtained. (One would like to have obtained at least three such exposures, moving the telescope slightly between each one, [see Sec. A] but you can't always get what you want.) We will combine these two frames using the generic routine combine: combine n30023,n30024 Sky reject=avsigclip scale=mode weight=mode subsets- blank=1 This produces output shown in Fig. 15. If we had been doing this using direct imaging, we would have speci
- 161. ed subsets+ to make sure this was done in a
- 162. lter-by-
- 163. lter manner; 23
- 164. PACKAGE = ccdred TASK = ccdproc images = n3*.imh List of CCD images to correct (ccdtype= ) CCD image type to correct (max_cac= 0) Maximum image caching memory (in Mbytes) (noproc = no) List processing steps only? (fixpix = no) Fix bad CCD lines and columns? (oversca= yes) Apply overscan strip correction? (trim = yes) Trim the image? (zerocor= yes) Apply zero level correction? (darkcor= no) Apply dark count correction? (flatcor= yes) Apply flat field correction? (illumco= no) Apply illumination correction? (fringec= no) Apply fringe correction? (readcor= no) Convert zero level image to readout correction? (scancor= no) Convert flat field image to scan correction? (readaxi= line) Read out axis (column|line) (fixfile= ) File describing the bad lines and columns (biassec= image) Overscan strip image section (trimsec= [1:3064,10:101]) Trim data section (zero = Zeron3) Zero level calibration image (dark = ) Dark count calibration image (flat = nFlat0) Flat field images (illum = ) Illumination correction images (fringe = ) Fringe correction images (minrepl= 1.) Minimum flat field value (scantyp= shortscan) Scan type (shortscan|longscan) (nscan = 1) Number of short scan lines (interac= yes) Fit overscan interactively? (functio= chebyshev) Fitting function (order = 1) Number of polynomial terms or spline pieces (sample = *) Sample points to fit (naverag= 1) Number of sample points to combine (niterat= 1) Number of rejection iterations (low_rej= 3.) Low sigma rejection factor (high_re= 3.) High sigma rejection factor (grow = 1.) Rejection growing radius (mode = ql) :go [more] n30023.imh: Apr 22 14:47 Flat field image is nFlat0 with scale=1. n30024.imh: Apr 22 14:47 Flat field image is nFlat0 with scale=1. n30028.imh: Apr 22 14:47 Flat field image is nFlat0 with scale=1. n30029.imh: Apr 22 14:47 Flat field image is nFlat0 with scale=1. n30030.imh: Apr 22 14:47 Flat field image is nFlat0 with scale=1. n30031.imh: Apr 22 14:48 Flat field image is nFlat0 with scale=1. n30036.imh: Apr 22 14:48 Flat field image is nFlat0 with scale=1. n30037.imh: Apr 22 14:48 Flat field image is nFlat0 with scale=1. [more] Figure 13: Parameters for ccdproc with at-
- 165. eld division now turned on ( atcor=yes) and the name of the at-
- 167. Figure 14: The cut along the spatial axis of a long program exposure appears to be consistent with a cut along the spatial axis of a bright twilight sky exposure: there is a 2% gradient from one side of the chip to the other. cc combine n30023,n30024 Sky subsets- reject=avsigclip scale=mode weight=mode Apr 22 13:56: IMCOMBINE combine = average reject = avsigclip, mclip = yes, lsigma = 3., hsigma = 3. blank = 1. Images Mode Scale Weight n30023 177.16 0.659 0.639 n30024 56.393 2.071 0.361 Output image = Sky, ncombine = 2 cc Figure 15: Combining two sky exposures, scaling and weighting by the mode. in that case, the output images would have been automatically named Sky1, Sky2, Sky3, and so on, with the extension determined by the
- 168. lter number. This is shown explicitly in our example of direct imaging reduction in Sec. C.2. 3.11.2 Creating the Illumination Correction Having decided to correct our data (which have already been divided by the at-
- 169. elds, remember), we need to create an illumination correction. For spectroscopic data, this will be created from the combined sky exposure (which has also been at-
- 170. elded), and will be done by
- 171. tting a function along the spatial axis, collapsing the image in the dispersion direction. (In practice, we let the slit function be a slight function of wavelength, and so do this procedure three or four times through-out the length of the spectrum.) For direct imaging, we will use our blank-sky (or low-level twilight) exposures (which have 25
- 172. PACKAGE = longslit TASK = illumination images = Sky Longslit calibration images illumina= nSky Illumination function images (interac= yes) Interactive illumination fitting? (bins = ) Dispersion bins (nbins = 5) Number of dispersion bins when bins = (sample = *) Sample of points to use in fit (naverag= 1) Number of points in sample averaging (functio= spline3) Fitting function (order = 1) Order of fitting function (low_rej= 3.) Low rejection in sigma of fit (high_re= 3.) High rejection in sigma of fit (niterat= 1) Number of rejection iterations (grow = 0.) Rejection growing radius (interpo= poly3) Interpolation type (graphic= stdgraph) Graphics output device (cursor = ) Graphics cursor input (mode = ql) Figure 16: The parameters for the task illum. been divided by the at-
- 173. eld) by smoothing them extensively and using the smoothed image to correct any large-scale gradients. Spectroscopic: twodspec.longslit.illum In Fig. 16 we show the parameters of the illum task within the twodspec longslit package. Note that we have changed some of the defaults, namely low reject and high reject, to 3.0. When we run the task, we are
- 174. rst shown a plot of the spectrumwith the
- 175. ve wavelength bins marked (see the top panel of Fig. 17). We can either accept these bins, or start over by typing a i and then marking each region with an s on the left, and an s on the right. When we exit this stage by a q, we then see the function
- 176. t in the spatial direction for each of the regions we've selected; these plots will resemble the middle panel. When we are done, we can plot the
- 177. nal
- 178. t; a spatial cut is shown in the bottom panel. (The image should be unity in the wavelength direction.) Direct imaging: mkskycor If we have combined blank-sky ats in order to removelarge- scale gradients, we can then use mkskycorto smooth the combined blank-sky frame. The parameters of mkskycor will resemble those of Fig. 18. (If you want to do this on more than one sky frame, you can do a
- 179. les Sky1,Sky2,Sky3 sky
- 180. x and then set input=@sky
- 181. x and output=n//@sky
- 182. x.) After you run the task, you should divide the new images into your old and examine the resultant images: imarith @n3sky
- 183. x / n//@sky
- 184. x test//@n3sky
- 185. x 26
- 186. Figure 17: The wavelength bins for our illum run are shown in the top panel under the spectrum of the sky. The middle plot shows the
- 187. t along the spatial cut of one of the
- 188. ve wavelength region. the bottom plot shows the spatial plot along the output image. 27
- 189. PACKAGE = ccdred TASK = mkskycor input = Input CCD images output = Output images (same as input if none given) (ccdtype= ) CCD image type to select (xboxmin= 5.) Minimum smoothing box size in x at edges (xboxmax= 0.25) Maximum smoothing box size in x (yboxmin= 5.) Minimum moothing box size in y at edges (yboxmax= 0.25) Maximum moothing box size in y (clip = yes) Clip input pixels? (lowsigm= 2.5) Low clipping sigma (highsig= 2.5) High clipping sigma (ccdproc= ) CCD processing parameters (mode = ql) Figure 18: Parameters for mkskycor. will produce images with names testSky1, testSky2, and so on. If you have well-exposed twilight ats, rather than blank-sky ats, you may instead
- 190. nd that you wish you had used the twilight sky exposures as your at-
- 191. eld instead of the dome ats. Do you have to reread all the data from disk and begin again? No! We can cheat, and fool IRAF into thinking that it is simply using the ( at-
- 192. elded) twilight ats as an illumination correction for the ( at-
- 193. elded) program frames. If we don't smooth the twilight-sky exposures, then this is algebraically equivalent (other than integer-truncation) to never having used the dome- ats at all. However, we must
- 194. rst
- 195. x the headers so that ccdproc will be willing to swallow the combined twilight sky exposures as an illumination correction: hedit Sky*.imh MKILLUM fake add+ ver- show+ You are now ready to proceed to the
- 196. nal steps. 3.12 Finishing the Flat-
- 197. elding To correct for this illumination function, simply do an ccdproc*.imhillumcor+illum=nSky*.imhto correct whicheverimagesneed correcting. If you've created only an nSky1.imh, then only those with
- 198. lter 1 will get processed. If you are using unaltered twilight ats, then of course you will have to substitute illum=Sky*.imh in the above. 28
- 199. 3.13 Fixing Bad Pixels The
- 200. nal step in our reductions will be to interpolate over non-linear pixels using our bad pixel map. Do this using the task
- 201. xpix in the nmisc package.
- 202. xpix *.imh mask=calib/badmap linterp=1 cinterp=2 Congratulations! You're done, and now ready to go on to do photometry on your frames or extract some spectra! 29
- 203. A How Many and What Calibration Frames Do You Need? The answer to this depends to some extent on what it is that you are doing, and what chip you are doing it with. The goal is to not let the quality of the calibration data degrade your signal-to-noise in any way. If you are in the regime where the read-noise of the chip is the dominant source of noise on your program objects, then subtracting a single bias frame from your data would increase the noise by p 2. If instead you use the average of 25 bias frames, the noise would be increased by only 10%. However, with modern CCDs with read-noise of a few electrons, hardly anyone
- 204. nds his/herself in this regime any more. Particularly if you are into high signal-to-noise spectroscopy, so you have lots and lots of signal compared to read-noise, or if you have high sky background on direct images, so that read-noise is again immaterial, then the signal-to-noise will be little aected by whether you have only a few bias frames. However, in this regime the quality of your at
- 205. elding is all important if you want to get the most out of your data. The following list contains the type of calibration images you may need, and provides some guide to the consideration of how many you may want to have. bias frames. These are zero second integration exposures obtained with the same pre- ash (if any) you are using on your program objects. If read-noise will sometimes dominate your source of error on the program objects, take 25 bias frames per night. Take them over dinner and you'll never notice it. These days, most CCD's have read-noises on the order of a few electrons, with the gain usually set so that you are at best barely sampling the read-noise (e.g., 3 ADU). In this case there isn't much reason for you to overdo it on the biases; 10 of them will bring the eective noise below the digitization noise of a single exposure. You may want to make a new sequence of biases each day. dark frames. These are long exposures taken with the shutter closed. If your longest exposure time is over 15 minutes you may want to take an equal length dark frame, subtract a bias frame from it, and decide if you are worried about how much dark current is left. Few of the Kitt Peak or Tololo chips suer from signi
- 206. cant dark current, but it won't hurt you to check once or twice during your run. I usually take a few of these but never use them. Applications where dark current will matter are long-slit spectroscopy and surface brightness studies | cases where the background is not removed locally. If you do
- 207. nd that you need to take care of dark current, then you should take at least 3 and preferably 5 to 10 dark frames during your run, each with an integration time equal to your longest exposure. You had better make sure that your system is suciently light-tight to permit these to be done during the day|if not, hope for a few cloudy nights! 30
- 208. bad pixel data. If you are doing spectroscopy, and would like to correct for non-linear bad pixels/partial columns, then you should take a series of long and short exposures of some type of at
- 209. eld (dome at or projector lamp). I typically aim for
- 210. ve exposures of several thousand e/pixel followed by 20 or so exposures that are about 100 e/pixel. at
- 211. eld exposures. Ata minimum, at
- 212. eld exposures are used to removepixel-to-pixel variations across the chip. Usually dome ats (exposures of an illuminated white spot) or projector ats (exposures of a quartz lamp illuminating the spectrograph slit) will suce to remove the pixel-to-pixel stu. You will want to expose the dome or projector ats so that you get sucient counts to not degrade the signal-to-noise of the
- 213. nal images. If you are after 1% photometry per pixel then you will need to have several times more than 10,000 electrons accumulated in your ats, but you need to be careful not to exceed the good linearity limit in any single at exposure. Generally if you have 5 or more ats each with 10,000 electrons per pixel you are probably
- 214. ne. You will need a set like this for every
- 215. lter or every grating tilt, and you probably will want to do a new sequence every day. twilight ats. If you are interested in good photometry of objects across your
- 216. eld, or in long-slit spectroscopic work, you need to know if the sky looks dierent to your CCD than the projector lamp or dome at. It is not unusual to
- 217. nd 5-10% gradients in the illumination response between a dome at and a sky exposure, and this dierence will translate directly into a 5-10% error in your photometry. For most applications, exposures of bright twilight sky (either for direct imaging or spectroscopy) will cure this problem. With direct imaging this requires you to be very quick on your feet to obtain a good level of sky exposure in each of your
- 218. lters while the sky is getting darker and darker. (Only the truly desperate would take twilight ats in the morn- ing!) For direct imaging take 3 to 5 exposures in each
- 219. lter, stepping the telescope slightly in between the exposures so that any faint stars can be eectively cleaned out. For long-slit spectroscopy take a few exposures of the the twilight sky, stepping the telescope perpendicular to the slit orientation. In both cases you should make sure that tracking is on and that the telescope is clear of the dome. You will
- 220. nd that you need to keep increasing the exposure time to maintain an illumination level of 10,000 electrons. blank sky exposures. Some observers doing sky-limited direct imaging may wish to try exposures of blank sky
- 221. elds rather than twilight sky, as the color of twilight and the color of the dark sky do dier considerably. Obtain at least three, and preferably four, long exposures through each
- 222. lter of some region relatively free from stars (blank sky coordinates can be found at Kitt Peak and Tololo), stepping the telescope 10- 15 arcseconds between each exposure. The trick here, of course, is to get enough 31
- 223. counts in the sky exposures to make this worth your while. Unless you are willing to devote a great deal of telescope time to this, you will have to smooth these blank sky exposures to reduce noise, but the assumption in such a smoothing process is that the color response of the chip does not vary over the area you are smoothing. You might try dividing a U dome at by a V dome at and seeing how reasonable an assumption this might be. Also, if the cosmetics are very bad, the smoothing process will wreak havoc with your data if you are not successful in cleaning out bad columns and pixels. fringe frames. Some CCD's produce an interference fringe pattern when they are illumi- nated by monochromatic light. For spectroscopy or narrow-band imaging this won't matter, as the fringe pattern will usually come out nicely with the dome ats, but if you are doing deep exposures in V , R, or I with a chip that fringes a lot, then the night sky lines may cause a fringe pattern. The only CCD data I've had to defringe was that taken with the Tololo prime focus RCA chip, now honorably retired. Even here the fringes seldom had amplitudes greater than a few percent of the night sky. If you are after equally faint objects of small spatial scale, then you may
- 224. nd yourself having to defringe. For this you will need very, very long blank sky frames obtained as above, but you will not be able to smooth them without destroying the fringe information. Prevention is the best cure for fringes: avoid using chips that fringe a lot, avoid making long V RI exposures within an hour of twilight (as the night sky lines are strongest then), and avoid letting your objects fall on the part of the chip where the fringing is the most severe. B The Ins and Outs of Combining Frames There are a number of powerful and sophisticated algorithms available in IRAF V2.10 for combining images. In particular there are a number of clever rejection criterion you can use for (hopefully) eliminating cosmic-rays or stars in twilight exposures without (hopefully) eliminatingthe data you want to keep. A complete description can be found by help combine; in this section we provide a quick astronomer's review of the rejection choices. The parameters for the combine task are shown in Fig. 19. All of the various ccdred combining routines ( atcombine, darkcombine, atcombine) simply call combine with the appropriate switch settings. In combining n images the routine must decide at each pixel which of the n data values, if any, to reject in forming the average. Deciding what point(s) might be descrepant can be broken into three categories. 32
- 225. cc lpar combine input = List of images to combine output = List of output images (plfile = ) List of output pixel list files (optional) (sigma = ) List of sigma images (optional)n (ccdtype = ) CCD image type to combine (optional) (subsets = no) Combine images by subset parameter? (delete = no) Delete input images after combining? (clobber = no) Clobber existing output image?n (combine = average) Type of combine operation (reject = none) Type of rejection (project = no) Project highest dimension of input images? (outtype = real) Output image pixel datatype (offsets = none) Input image offsets (masktype = none) Mask type (maskvalue = 0.) Mask value (blank = 0.) Value if there are no pixelsn (scale = none) Image scaling (zero = none) Image zero point offset (weight = none) Image weights (statsec = ) Image section for computing statisticsn (lthreshold = INDEF) Lower threshold (hthreshold = INDEF) Upper threshold (nlow = 1) minmax: Number of low pixels to reject (nhigh = 1) minmax: Number of high pixels to reject (mclip = yes) Use median in sigma clipping algorithms? (lsigma = 3.) Lower sigma clipping factor (hsigma = 3.) Upper sigma clipping factor (rdnoise = 0.) ccdclip: CCD readout noise (electrons) (gain = 1.) ccdclip: CCD gain (electrons/DN) (sigscale = 0.1) Tolerance for sigma clipping scaling correction (pclip = -0.5) pclip: Percentile clipping parameter (grow = 0) Radius (pixels) for 1D neighbor rejection (mode = ql) Figure 19: The parameters for the combine task. 33
- 226. The trivial. The simpliest, but for many applications the best, is the reject=minmax option. In this, the same number of values are excluded in determining the best average at each pixel. This assumes nothing about the data, or the expected spread in data value at each pixel, but is ecient at removing bad apples at the cost of always computing the average from fewer data values than what is available. Still, this works
- 227. ne if you have data that you don't mind losing; e.g., in combining biases, say, or darks. minmax With this rejection algorithm, at each pixel there will be nlow low pixels and nhigh high pixels rejected. Thus to reject only the highest value in combining images we set reject=minmax nhigh=1 nlow=0. This is the default setting for zerocombine, and will do an excellent and fast job. SigmadeterminedfromCCD noisecharacteristics. In the schemesreject=ccdclip and reject=crreject we assume we know what a reasonable spread is of our data values at each pixel, given the average value and the known gain g (in e/ADU) and read-noise r (in e). If the average data value at a given pixel is I, then the number of electrons at that pixel is g I, and we expect from Poisson statistics that spread in the data should have a value of sigma (), in ADU's, of ADU = pg I + r2 g This is the most legitimate (mathematically justi
- 228. ed) rejection criteria, and is suit- able when you haven't mucked around (subtracted sky, or averaged or summed frames) with the data. ccdclip With this rejection algorithm, we
- 229. rst guess I at a given pixel by taking the median (mclip=yes), computing the expected spread in ADU's based upon this value and the speci
- 230. ed values of the gain (gain) and read-noise (rdnoise), and then rejecting any points that are more than lsigma below that median or hsigma above that median. The process is iterated until no more values are rejected at a given pixel. crreject This is identical to ccdclip, except that low pixels are ignored and only high pixels are rejected. Sigma determined empirically. Rather than determine the expected spread in our data values fromthe known characteristicsof the CCD, we maywant to makesome attempt to determine the expected sigma based upon the data itself. Times that this might be useful would be if you have altered the data in some way, particularly by subtracting sky, say. The two primary schemes here are sigclip and avsigclip, whose eectiveness is determined by how many images you are attempting to combine. 34
- 231. sigclip With this rejection algorithm, the median is
- 232. rst computed at each pixel value by
- 233. rst ignoring the low and high value. The sigma about this median is then determined using all the data values at this pixel. Next, the median is recomputed rejecting any data points that are lsigma or hsigma low or high. The sigma about this new median is computed as well as the new sigma, ignoring data values that were excluded in determining the median. The last two steps are repeated until no more data values are rejected. As you may guess, this works well if there are many ( 10) images. avsigclip This is a variant on the sigclip algorithm, and works well in the case that there are only a few images. It is also probably the hardest algorithm to understand or describe. Rather than compute the sigma from the spread in the data values at a given point, however, the algorithm assumes that the expected sigma is equal to the square-root of the median multiplied by some constant. (This would lead to determining the gain for a CCD in the ideal case, if there was no read-noise and the data had been unaltered.) As an extra twist, it determines this constant independently for each row of the data. C Summary of Reduction Steps Because examples are sometimes the easiest thing to refer to I am going to close this manual with an example of reducing a night of spectroscopic data (C.1) and an example of reducing a night of direct imaging data (C.2). For either example we assume that the calibration exposures you have are: biases (zero-second exposures) Used to remove pre- ash illumination or any residual structure in the DC oset not removed by the over-scan region. at-
- 234. eld exposures These are used to remove the pixel-to-pixel gain variations and possibly some of the lower-order wavelength-dependent sensitivity variations. Depending upon the instrument, these at-
- 235. eld exposures may or may not do an adequate job of matching the illumination function along the slit (i.e., in the spatial direction). twilight exposures These are used to correct any mismatch between the at-
- 236. eld exposure and the slit illumination function. C.1 Spectroscopic Example The reduction steps for spectroscopic data will be dealt with in outline form, since we have used these data as the primary example through out this manual. The steps are as follows: 35
- 237. Figure 20: A line cut through this at-
- 238. eld shows that the region containing good data extends from column 25 through 368. Expanding the region on the right shows that the overscan region is at from columns 404 through 431. A plot of a column near the middle shows that the
- 239. rst few rows and last few rows are not of good quality, but that good data extends from lines 4 through 795. 1. Examine a at
- 240. eld exposure using implot and determine the area of the chip that contains good data. Fig. 20 shows a sample cut through a chip that had been formated to 400 + 32(overscan) 800. At the same time determine the columns where the overscan is at. By expanding the plot and making a plot along a column near the middle, we conclude that the region containing good data is [25:368,4:795], and that the good region of the overscan is [404:431,4:795]. 2. load ccdred and run setinstrument specphot. This will allow you to inspect the parameters for the ccdred package and the ccdproc task. Make sure that only overscan, trim, and zerocor are turned on. Insert the image section containing good data as trimsec and the image section containing the good overscan region as biassec. Insert the name Zero for the zero entry; this is the average bias frame that will be created in the next step. 3. Combine the bias frames: zerocombine *.imh output=Zero 4. Process all the frames through ccdproc in order to remove the overscan, trim the image, and subtract o the average bias frame. ccdproc *.imh ccdtyp= overscan+ trim+ zerocor+ zero=Zero at- cor- 36
- 241. 5. Create a bad pixel mask and tuck it away for latter use. Let us assume that the long-exposure ats are in a0001-5, and the short-exposure ats are in a0006-19. (a) Combine the long-exposure at-
- 242. elds and the short-exposure at-
- 244. les a0001,a0002,a0003,a0004,a0005 atlongs
- 245. les a0006,a0007,a0008,a0009,a001* atshorts atcombine@ atlongsout=FlatLreject=crrejectgain=gainrd- noise=rdnoise proc+ atcombine @ atshorts out=FlatS reject=crreject gain=gain rdnoise=rdnoise proc+ imarith FlatL / FlatS Flatdiv (b) Create the bad pixel map itself: nmisc unlearn ccdmask ccdmask Flatdiv mask=badmap (c) Examine the images to see if all is as it should be: display FlatL 1 display Flatdiv 2 display badmap 3 (d) Get rid of the intermediate products and tuck the mask away where subsequent processing won't mess it up: imdelete @ atlongs,@ atshorts,FlatL,FlatS,Flatdiv mkdir calib imrename badmap calib/badmap 6. Create a perfect normalized, illumination corrected at-
- 246. eld exposure. (a) Combine the at-
- 247. eld exposures: atcombine *.imh output=Flat combine=average reject=crreject gain=gainrdnoise=rdnoiseccdtype= atscale=modeproc+sub- sets+ (b) Combine the twilight ats: combine sky1,sky2,sky3,sky4 output=Sky ccdtype= reject=avsig- clip scale=mode proc+ subsets+ blank=1 37
- 248. Figure 21: The
- 249. t from response. (c) Fit a function in the dispersion direction to the combined at-
- 250. eld using the routine response in the twod.longslit package: response Flat Flat nFlat intera+ thresho=INDEF sample=* n- aver=1 function=spline3 order=1 low rej=3. high reject=3. nit- erat=1. grow=0. Up the order of the
- 251. t until you get something that looks good at the ends and more or less
- 252. ts the shape of the at. (See Fig. 21.) Alternatively, you may want to keep the order basically to a constant, (function=cheb order=1) if you believe that the wavelength dependence of the at is mainly due to the instrument and not the lamps and projector screen. (d) Process the averaged twilight at Sky through ccdproc, this time using the normalized at-
- 253. eld exposure nFlat as the at: ccdproc Sky ccdtype= atcor+ at=nFlat (e) Decide how well the twilight ats and dome ats agreed: is a plot of the now attened image Sky at in the spatial direction? Fig. 22 shows an example where there is a signi
- 254. cant gradient from one side of the slit to the other. At this point it is worth plotting cuts along the spatial axis of the chip, to see if these gradients change with wavelength. In the data presented here we found there was a gradual change from the blue to the red. (f) If the previous step revealed some gradient, determine the correction for the slit function: illum Sky nSky nbins=5 low reject=3 high reject=3 Up the order of the
- 255. t until you get something reasonable; see Fig. 23. (g) Having done this, we can now make the perfect at: 38
- 256. Figure 22: The number of counts in this attened sky changes from 4780 on the left to 5110 on the right; this 7% gradient will lead to problems in sky subtraction if it is not removed. Figure 23: The
- 257. t along the spatial axis to the twilight sky exposure that has been at- tened by the normalized dome- at. 39
- 258. imarith nFlat * nSky perfectFlat 7. Process all of the rest of your data through ccdproc using perfectFlat for your at: ccdproc *.imh atcor+ at=perfectFlat 8. Finally, interpolate over bad pixels: nmisc (Note that there are several dierent
- 259. xpix routines; you must be in nmisc to be accessing the correct one!)
- 260. xpix *.imh mask=badmap linterp=1 cinterp=2 The astute reader may have noticed that the outline for at-
- 261. elding the spectroscopic data is a little bit dierent here than that given earlier in Sec. 3. In Sec. 3 (see outline in Sec. 3.1) a second-pass through ccdproc was used to at-
- 262. eld all the data (including the twilight sky exposures) by the normalized (but not sky-corrected) at. The at-
- 263. elded twilight frames were then used to create an illumination correction image using illum. All the data was then run a third time through ccdproc, this time specifying an illumination correction. In the example given in the current section, however, we have done the illumi- nation correction ourselves on the at-
- 264. eld exposure; this decreases the number of passes through ccdproc from three to two. Both procedures are correct and will get you where you are going. C.2 Direct Imaging Example We will go through the direct imaging example in some detail, as throughout the rest of this manual we have used spectroscopic data to illustrate the steps. We show in Fig. 24 the list of images we wish to process. These are all data taken with the T2KA chip (a Tektronix 2048 2048 CCD) on the KPNO 0.9m, and kindly made available by A. Zabludo. Note that the images were taken in both the B and R
- 265. lters, and that there are both dome- ats and twilight sky exposures taken through each
- 266. lter, in addition to a hefty set of bias frames. The reduction steps are as follows: 1. Examine a dome- at exposure and substantiate that the BIASSEC and TRIMSEC values listed in the header are suitable. Fig. 25 shows that the header suggests the overscan to be taken from the image section [2051:2080,1:2048] and the region of the chip containing useful data is [1:2046,1:2048] (i.e., only the last two columns are a little dicey.) The plots from implot con
- 267. rm that these are reasonable. (The
- 268. rst row is a little bit hot, but we decide to live with it.) 40
- 269. c0001.imh[2080,2048][short]: bias 3rd afternoon c0002.imh[2080,2048][short]: bias 3rd afternoon c0003.imh[2080,2048][short]: bias 3rd afternoon c0004.imh[2080,2048][short]: bias 3rd afternoon c0005.imh[2080,2048][short]: bias 3rd afternoon c0006.imh[2080,2048][short]: bias 3rd afternoon c0007.imh[2080,2048][short]: bias 3rd afternoon c0008.imh[2080,2048][short]: bias 3rd afternoon c0009.imh[2080,2048][short]: bias 3rd afternoon c0010.imh[2080,2048][short]: bias 3rd afternoon c0011.imh[2080,2048][short]: bias 3rd afternoon c0012.imh[2080,2048][short]: bias 3rd afternoon c0013.imh[2080,2048][short]: bias 3rd afternoon c0014.imh[2080,2048][short]: domeR 3rd afternoon c0015.imh[2080,2048][short]: domeR 3rd afternoon c0016.imh[2080,2048][short]: domeR 3rd afternoon c0017.imh[2080,2048][short]: domeR 3rd afternoon c0018.imh[2080,2048][short]: domeB 3rd afternoon c0019.imh[2080,2048][short]: domeB 3rd afternoon c0020.imh[2080,2048][short]: domeB 3rd afternoon c0021.imh[2080,2048][short]: domeB 3rd afternoon c0022.imh[2080,2048][short]: skyB 3rd night c0023.imh[2080,2048][short]: skyB 3rd night c0024.imh[2080,2048][short]: skyB 3rd night c0025.imh[2080,2048][short]: skyB 3rd night c0026.imh[2080,2048][short]: 100_280R c0027.imh[2080,2048][short]: 100_280R c0028.imh[2080,2048][short]: 100_280B c0029.imh[2080,2048][short]: G163_50 c0030.imh[2080,2048][short]: G163_50B c0031.imh[2080,2048][short]: 106_1024R c0032.imh[2080,2048][short]: 106_1024B c0033.imh[2080,2048][short]: A957B c0034.imh[2080,2048][short]: A1213R c0035.imh[2080,2048][short]: A1213B c0036.imh[2080,2048][short]: N4472R c0037.imh[2080,2048][short]: A1228B c0038.imh[2080,2048][short]: A1541B c0040.imh[2080,2048][short]: A1837R c0041.imh[2080,2048][short]: A1837B c0042.imh[2080,2048][short]: 106_1024R c0043.imh[2080,2048][short]: 106_1024B c0044.imh[2080,2048][short]: 104_598B c0045.imh[2080,2048][short]: 104_598R c0046.imh[2080,2048][short]: 108_475R c0047.imh[2080,2048][short]: 108_475B c0048.imh[2080,2048][short]: A1656R c0049.imh[2080,2048][short]: A1656B c0050.imh[2080,2048][short]: A1656B c0064.imh[2080,2048][short]: MASS31 c0065.imh[2080,2048][short]: A2199IVR c0066.imh[2080,2048][short]: 108_475R c0067.imh[2080,2048][short]: 108_475B c0068.imh[2080,2048][short]: 110_450B c0069.imh[2080,2048][short]: 110_450R c0070.imh[2080,2048][short]: skyR 3rd morning c0071.imh[2080,2048][short]: skyR 3rd morning c0072.imh[2080,2048][short]: skyR 3rd morning c0073.imh[2080,2048][short]: skyR 3rd morning c0074.imh[2080,2048][short]: skyR 3rd morning c0075.imh[2080,2048][short]: skyR 3rd morning c0076.imh[2080,2048][short]: skyR 3rd morning c0077.imh[2080,2048][short]: skyR 3rd morning c0078.imh[2080,2048][short]: skyR 3rd morning Figure 24: The direct images we will reduce. 41
- 270. c0020[2080,2048][short]: domeB 3rd afternoon No bad pixels, no histogram, min=723., max=9356. Line storage mode, physdim [2304,2048], length of user area 1337 s.u. Created Thu 08:54:05 28-May-92, Last modi
- 271. ed Thu 08:54:07 28-May-92 Pixel
- 272. le 'tofu!/data1/massey/pixels/c0020aa.pix' [ok] 'KPNO-IRAF' / '07-05-92' / IRAF-MAX= 9.356000E3 / DATA MAX IRAF-MIN= 7.230000E2 / DATA MIN IRAF-BPX= 16 / DATA BITS/PIXEL IRAFTYPE= 'SHORT ' / PIXEL TYPE OBSERVAT= 'KPNO ' / observatory OBSERVER= 'Zabludo ' / observers EXPTIME = 10. / actual integration time DARKTIME= 10. / total elapsed time IMAGETYP= ' at ' / object, dark, bias, etc. DATE-OBS= '07/05/92 ' / date (dd/mm/yy) of obs. UT = ' 0:13:45.00' / universal time ST = ' 7:47:45.00' / sidereal time RA = ' 4:19:45.00' / right ascension DEC = '13:00:00.00' / declination EPOCH = 1992.3 / epoch of ra and dec ZD = '51.180 ' / zenith distance AIRMASS = 1.6 / airmass TELESCOP= 'kp09m ' / telescope name DETECTOR= 't2ka ' / detector PREFLASH= 0 / pre ash time, seconds GAIN = 4.2 / gain, electrons per adu DWELL = 5 / sample integration time RDNOISE = 4. / read noise, electrons per adu CAMTEMP = -96 / camera temperature DEWTEMP = -156 / dewar temperature BIASSEC = '[2051:2080,1:2048]' / overscan portion of frame TRIMSEC = '[1:2046,1:2048] ' / region to be extracted DATASEC = '[1:2048,1:2048] ' / image portion of frame CCDSEC = '[1:2048,1:2048] ' / orientation to full frame ORIGSEC = '[1:2048,1:2048] ' / original size full frame CCDSUM = '1 1 ' / on chip summation INSTRUME= 'test ' / instrument FILTERS = '1 ' /
- 273. lter position Figure 25: The bias and trim parameters in the header are con
- 274. rmed to be reasonable by imploting a dome- at exposure. 42
- 275. 2. Load ccdred and run setinstrument direct (Fig. 26). We decide to set pix- eltype= short real to retain 16-bit output images, but to do the arithmetic in oating-point. A CNTL-Z then shows us the parameters of ccdproc. We make sure that ony overscan, trim, and zerocor are turned on, and we insert the name Zeron3 for the zero entry. This is the name we will use when we create the average bias frame below. We also specify that all image types will be processed (rather than just object, the default, by setting ccdtype=. 3. Run ccdlist*.imhto substantiate that the type of object is correct (zero, object or at) and that
- 276. lter number is being picked up correctly. As can be seen in Fig. 27, the observer had taken her twilight exposures identifying them as at's. Since this will complicate how we plan to do the reductions, we change the twilight exposure types to object by doing a
- 277. les c0022,c0023,c0024,c0025,c007* skies hedit @skies IMAGETYP object verify- show+ update+ 4. Combine the bias frames: zerocombine *.imh output=Zeron3 We see in Fig. 28 that the routine picked out the correct images to combine. 5. Next run all the frames through ccdproc in order to remove the overscan, trim the image, and subtract o the average bias frame: ccdproc *.imh ccdtype= overscan+ trim+ zerocor+ zero=Zeron3 atcor- Although specifying ccdtype= means we must sit through the processing of the 13 individual bias frames, it at least assures us that the ats are processed. We will see questions such as those shown in Fig. 29, and be confronted with a plot like that shown in the same
- 278. gure. Note that we are leaving the order at 1 (scalar) despite the slight gradient; this will be taken out by the average bias frame. When we are satis
- 279. ed that the overscan
- 280. tting is working
- 281. ne, answer NO to the Fit overscan... interactively? question. 6. Combine the at-
- 282. eld exposures: atcombine*.imhreject=crrejectgain=gain scale=moderdnoise=rd- noise 43
- 283. setinstrument direct PACKAGE = imred TASK = ccdred (pixelty= short real) Output and calculation pixel datatypes (verbose= yes) Print log information to the standard output? (log
- 284. le= log
- 285. le) Text log
- 286. le (plot
- 287. l= ) Log metacode plot
- 288. le (backup = ) Backup directory or pre
- 289. x (instrum= ccddb$kpno/direct.dat) CCD instrument
- 290. le (ss
- 291. le = subsets) Subset translation
- 292. le (graphic= stdgraph) Interactive graphics output device (cursor = ) Graphics cursor input (version= 2: October 1987) (mode = ql) ($nargs = 0) (CNTL-Z) PACKAGE = ccdred TASK = ccdproc images = List of CCD images to correct (ccdtype= ) CCD image type to correct (max_cac= 0) Maximum image caching memory (in Mbytes) (noproc = no) List processing steps only? (
- 293. xpix = no) Fix bad CCD lines and columns? (oversca= yes) Apply overscan strip correction? (trim = yes) Trim the image? (zerocor= yes) Apply zero level correction? (darkcor= no) Apply dark count correction? ( atcor= no) Apply at
- 294. eld correction? (illumco= no) Apply illumination correction? (fringec= no) Apply fringe correction? (readcor= no) Convert zero level image to readout correction? (scancor= no) Convert at
- 295. eld image to scan correction? (readaxi= line) Read out axis (column|line) (
- 296. x
- 297. le= ) File describing the bad lines and columns (biassec= image) Overscan strip image section (trimsec= image) Trim data section (zero = Zeron3) Zero level calibration image (dark = ) Dark count calibration image ( at = ) Flat
- 298. eld images (illum = ) Illumination correction images (fringe = ) Fringe correction images (minrepl= 1.) Minimum at
- 299. eld value (scantyp= shortscan) Scan type (shortscan|longscan) (nscan = 1) Number of short scan lines (interac= yes) Fit overscan interactively? (functio= chebyshev) Fitting function (order = 1) Number of polynomial terms or spline pieces (sample = *) Sample points to
- 300. t (naverag= 1) Number of sample points to combine (niterat= 1) Number of rejection iterations (low_rej= 3.) Low sigma rejection factor (high_re= 3.) High sigma rejection factor (grow = 0.) Rejection growing radius (mode = ql) (CNTL-Z) Figure 26: Running setinstrument direct allows us to specify that we would like the output images to be 16-bit integers (short) but to retain real for the calculation type; we also turn atcor=no and specify the image name Zeron3 for the name of the average bias frame (zero=Zeron3). 44
- 301. cc ccdlist *.imh c0001.imh[2080,2048][short][zero][3]:bias 3rd afternoon c0002.imh[2080,2048][short][zero][3]:bias 3rd afternoon c0003.imh[2080,2048][short][zero][3]:bias 3rd afternoon (more) c0012.imh[2080,2048][short][zero][3]:bias 3rd afternoon c0013.imh[2080,2048][short][zero][3]:bias 3rd afternoon c0014.imh[2080,2048][short][flat][3]:domeR 3rd afternoon c0015.imh[2080,2048][short][flat][3]:domeR 3rd afternoon c0016.imh[2080,2048][short][flat][3]:domeR 3rd afternoon c0017.imh[2080,2048][short][flat][3]:domeR 3rd afternoon c0018.imh[2080,2048][short][flat][1]:domeB 3rd afternoon c0019.imh[2080,2048][short][flat][1]:domeB 3rd afternoon c0020.imh[2080,2048][short][flat][1]:domeB 3rd afternoon c0021.imh[2080,2048][short][flat][1]:domeB 3rd afternoon c0022.imh[2080,2048][short][flat][1]:skyB 3rd night c0023.imh[2080,2048][short][flat][1]:skyB 3rd night c0024.imh[2080,2048][short][flat][1]:skyB 3rd night c0025.imh[2080,2048][short][flat][1]:skyB 3rd night c0026.imh[2080,2048][short][object][3]:100_280R c0027.imh[2080,2048][short][object][3]:100_280R c0028.imh[2080,2048][short][object][1]:100_280B c0029.imh[2080,2048][short][object][3]:G163_50 (more) c0068.imh[2080,2048][short][object][1]:110_450B c0069.imh[2080,2048][short][object][3]:110_450R c0070.imh[2080,2048][short][flat][3]:skyR 3rd morning c0071.imh[2080,2048][short][flat][3]:skyR 3rd morning c0072.imh[2080,2048][short][flat][3]:skyR 3rd morning c0073.imh[2080,2048][short][flat][3]:skyR 3rd morning c0074.imh[2080,2048][short][flat][3]:skyR 3rd morning c0075.imh[2080,2048][short][flat][3]:skyR 3rd morning c0076.imh[2080,2048][short][flat][3]:skyR 3rd morning c0077.imh[2080,2048][short][flat][3]:skyR 3rd morning c0078.imh[2080,2048][short][flat][3]:skyR 3rd morning ccfiles c0022,c0023,c0024,c0025,c007* skies cchedit @skies IMAGETYP object verify- show+ update+ c0022,IMAGETYP: flat - object c0022 updated c0023,IMAGETYP: flat - object c0023 updated c0024,IMAGETYP: flat - object c0024 updated c0025,IMAGETYP: flat - object c0025 updated c0070.imh,IMAGETYP: flat - object c0070.imh updated c0071.imh,IMAGETYP: flat - object (more) cc ccdlist c0070 c0070[2080,2048][short][object][3]:skyR 3rd morning Figure 27: . Running ccdlist allows us to substantiate that the image types and
- 302. lter numbers are being picked up correctly. We decide to change the imagetype of the twilight sky exposures to be that of object rather than at using hedit, and then test that this worked by running ccdlist on one of them. 45
- 303. cc zerocombine *.imh output=Zeron3 May 29 11:35: IMCOMBINE combine = average reject = minmax, nlow = 0, nhigh = 1 blank = 0. Images c0001.imh c0002.imh c0003.imh c0004.imh c0005.imh c0006.imh c0007.imh c0008.imh c0009.imh c0010.imh c0011.imh c0012.imh c0013.imh Output image = Zeron3, ncombine = 13 Figure 28: Combining the bias exposures. We can see from Fig. 30 that it combined the correct dome- at exposures. 7. Flatten all the program and sky frames: ccdproc *.imh ccdtype= atcor+ at=Flat* As shown in Fig. 31 the appropriate at-
- 304. eld is matched with each program frame based upon the
- 305. lter number. 8. Evaluate and do attening correction if necessary: (a) Combine the twilight or blank-sky exposures: combine c0022,c0023,c0024,c0025,c007* Sky subset+ scale=mode weight=mode reject=crreject gain=gain rdnoise=rdnoise Examine the combined images to make sure that stars have been
- 306. ltered out. (See Figs. 32 and 33.) (b) Examine the longest program exposure (or exposure with the most sky) in each
- 307. lter. Are there signs of any large-scale gradients left by the at-
- 308. elding? We show in Fig. 34 that there are some indications of a problem: the large residual dust speck is there, and the frame is a little bit lighter on the right than on the left. Using implot to examine the same lines as on the sky exposure con
- 309. rms 46