SlideShare a Scribd company logo
1 of 1
Download to read offline
Want to talk about the latest industry issues? Join the discussion forum. August 2012
I See What
You’re SayingHow Visual Tools Make Meeting More
Interesting and Effective
by Kelly Kingman
Kelly is the Marketing Director & Graphic Recorder for Imagethink. As graphic facilitators, ImageThink transforms complex ideas into powerful visual stories.
MULTI-INDUSTRY
H
ow many times have you left a meeting without
a clear sense of what was discussed or decided?
Most meetings are very heavy on verbal and textual
information. There’s nothing wrong with the
information itself, but the human brain can only process it in
chunks. When it comes to communication, text and speech are
like a dial-up internet connection, and visual information is like
fiber optic cable — it is much faster, and goes straight to the
central processing areas of our mind.
What is a visual
meeting?
A visual meeting
utilizes visual tools and
techniques to enhance
communication and
unlock participants’
creativity. Visual tools
can be anything from sticky notes that are moved around on a
wall, to hiring a graphic recorder to capture the group discussion
in a blend of images and text.
Visual tools help to clear up confusion that can arise from
conflicting mental models of information. If an image doesn’t
match one participant’s interpretation of an idea, then all can
discuss the differences.
Tools for Visual Meetings
Paper: Make sure you have flip charts or large rolls of paper
on hand. Paper can be taped up on a wall and used to draw
maps, capture brainstorms, make lists and assign next steps.The
advantage of using paper over a whiteboard is that you have a
permanent record of the conversation and decisions.
Sticky Notes: Sticky notes in different colors can be used to
cluster and organize lots of different ideas. Assign each color of
sticky note a meaning or category — for instance, green notes
for ideas on sustainability, et cetera.
People are physically involved in the information — writing
down their ideas, moving them around at the wall — which
energizes the entire group.
Dot Voting or Polls: Dot stickers, available at most stationery
and art supply stores, are a great way to analyze and discuss
information that has been captured visually in a meeting. Give
each person a number of stickers equal to about one third of
the items you are assessing. Then ask them to place their dot in
a specific location near each item. When all the votes are cast,
what you have is a strong visual representation of the group’s
opinions or interests.
Graphic Facilitators and Recorders:
Hiring a graphic recorder to capture your next strategic planning
session in a blend of words and pictures is a great way to enhance
engagement in the
meeting process.
Graphic recorders
will create a
permanent chart
of the conversation
or presentation
that cements the
information in the
mind of everyone present. Graphic facilitators can use different
exercises that help the group build consensus and understanding
organically, which builds trust and collaboration.
When you use visual techniques in your meetings, participation
increases dramatically.Each person has a concrete representation
of what they are contributing to the conversation — they
can point to an idea on a sticky note or in an image that
acknowledges it was heard by the group. Visuals get everyone
literally on the same page.
“If an image doesn’t
match one participant’s
interpretation of an idea,
then all can discuss the
differences..”
“... it is much faster,
and goes straight to
the central processing
areas of our mind.”

More Related Content

What's hot

Identifying Your Audience
Identifying Your AudienceIdentifying Your Audience
Identifying Your AudienceAmanda Makulec
 
Data Visualization Design Best Practices Workshop
Data Visualization Design Best Practices WorkshopData Visualization Design Best Practices Workshop
Data Visualization Design Best Practices WorkshopJSI
 
Interactive Journey Maps: Take your design & strategy to the next level
Interactive Journey Maps: Take your design & strategy to the next levelInteractive Journey Maps: Take your design & strategy to the next level
Interactive Journey Maps: Take your design & strategy to the next levelJennifer Briselli
 
Bringing Data to Life - Making Charts That Don't Suck
Bringing Data to Life - Making Charts That Don't SuckBringing Data to Life - Making Charts That Don't Suck
Bringing Data to Life - Making Charts That Don't SuckDan Sweet
 
Helping Teams Paddle in the Same Direction
Helping Teams Paddle in the Same DirectionHelping Teams Paddle in the Same Direction
Helping Teams Paddle in the Same DirectionItamar Medeiros
 
Public Participation NTHP 10 15 09
Public Participation NTHP  10 15 09Public Participation NTHP  10 15 09
Public Participation NTHP 10 15 09Della Rucker
 
HXD 2019: Discovering Unmet Needs and New Solutions with Participatory Design
HXD 2019: Discovering Unmet Needs and New Solutions with Participatory DesignHXD 2019: Discovering Unmet Needs and New Solutions with Participatory Design
HXD 2019: Discovering Unmet Needs and New Solutions with Participatory DesignJennifer Briselli
 
Getting The Most Out Of Mind Mapping
Getting The Most Out Of Mind MappingGetting The Most Out Of Mind Mapping
Getting The Most Out Of Mind MappingMichael Deutch
 
Why No One is Using your Dashboard
Why No One is Using your DashboardWhy No One is Using your Dashboard
Why No One is Using your DashboardAmanda Makulec
 
Beyond Data Visualization: What's next in communicating with data?
Beyond Data Visualization: What's next in communicating with data?Beyond Data Visualization: What's next in communicating with data?
Beyond Data Visualization: What's next in communicating with data?Zach Gemignani
 
Now that SharePoint is Deployed, How do I Measure Success?
Now that SharePoint is Deployed, How do I Measure Success?Now that SharePoint is Deployed, How do I Measure Success?
Now that SharePoint is Deployed, How do I Measure Success?Christian Buckley
 
Collaboration in the era of crowdsourcing
Collaboration in the era of crowdsourcingCollaboration in the era of crowdsourcing
Collaboration in the era of crowdsourcingHutch Carpenter
 
Design Inclusively
Design InclusivelyDesign Inclusively
Design InclusivelyMark Riggan
 
Spigit fusion and release 3.1 webinar 021011
Spigit fusion and release 3.1   webinar 021011Spigit fusion and release 3.1   webinar 021011
Spigit fusion and release 3.1 webinar 021011Hutch Carpenter
 
Design thinking 46 slides
Design thinking 46 slidesDesign thinking 46 slides
Design thinking 46 slidesISMB
 
Breaking Down Silos: Building Collaborative Culture | Seattle Interactive Con...
Breaking Down Silos: Building Collaborative Culture | Seattle Interactive Con...Breaking Down Silos: Building Collaborative Culture | Seattle Interactive Con...
Breaking Down Silos: Building Collaborative Culture | Seattle Interactive Con...Seattle Interactive Conference
 
Culture in 6 slides - The New Reality
Culture in 6 slides - The New RealityCulture in 6 slides - The New Reality
Culture in 6 slides - The New RealityJulie Dodd
 

What's hot (20)

Identifying Your Audience
Identifying Your AudienceIdentifying Your Audience
Identifying Your Audience
 
Data Visualization Design Best Practices Workshop
Data Visualization Design Best Practices WorkshopData Visualization Design Best Practices Workshop
Data Visualization Design Best Practices Workshop
 
WYRED WP10 reflections 2nd meeting
WYRED WP10 reflections 2nd meetingWYRED WP10 reflections 2nd meeting
WYRED WP10 reflections 2nd meeting
 
Interactive Journey Maps: Take your design & strategy to the next level
Interactive Journey Maps: Take your design & strategy to the next levelInteractive Journey Maps: Take your design & strategy to the next level
Interactive Journey Maps: Take your design & strategy to the next level
 
Bringing Data to Life - Making Charts That Don't Suck
Bringing Data to Life - Making Charts That Don't SuckBringing Data to Life - Making Charts That Don't Suck
Bringing Data to Life - Making Charts That Don't Suck
 
Helping Teams Paddle in the Same Direction
Helping Teams Paddle in the Same DirectionHelping Teams Paddle in the Same Direction
Helping Teams Paddle in the Same Direction
 
Public Participation NTHP 10 15 09
Public Participation NTHP  10 15 09Public Participation NTHP  10 15 09
Public Participation NTHP 10 15 09
 
HXD 2019: Discovering Unmet Needs and New Solutions with Participatory Design
HXD 2019: Discovering Unmet Needs and New Solutions with Participatory DesignHXD 2019: Discovering Unmet Needs and New Solutions with Participatory Design
HXD 2019: Discovering Unmet Needs and New Solutions with Participatory Design
 
Getting The Most Out Of Mind Mapping
Getting The Most Out Of Mind MappingGetting The Most Out Of Mind Mapping
Getting The Most Out Of Mind Mapping
 
Why No One is Using your Dashboard
Why No One is Using your DashboardWhy No One is Using your Dashboard
Why No One is Using your Dashboard
 
Beyond Data Visualization: What's next in communicating with data?
Beyond Data Visualization: What's next in communicating with data?Beyond Data Visualization: What's next in communicating with data?
Beyond Data Visualization: What's next in communicating with data?
 
Now that SharePoint is Deployed, How do I Measure Success?
Now that SharePoint is Deployed, How do I Measure Success?Now that SharePoint is Deployed, How do I Measure Success?
Now that SharePoint is Deployed, How do I Measure Success?
 
Collaboration in the era of crowdsourcing
Collaboration in the era of crowdsourcingCollaboration in the era of crowdsourcing
Collaboration in the era of crowdsourcing
 
Design Inclusively
Design InclusivelyDesign Inclusively
Design Inclusively
 
Spigit fusion and release 3.1 webinar 021011
Spigit fusion and release 3.1   webinar 021011Spigit fusion and release 3.1   webinar 021011
Spigit fusion and release 3.1 webinar 021011
 
Design thinking 46 slides
Design thinking 46 slidesDesign thinking 46 slides
Design thinking 46 slides
 
Data visualization
Data visualizationData visualization
Data visualization
 
Mixing Generates Awesomeness
Mixing Generates AwesomenessMixing Generates Awesomeness
Mixing Generates Awesomeness
 
Breaking Down Silos: Building Collaborative Culture | Seattle Interactive Con...
Breaking Down Silos: Building Collaborative Culture | Seattle Interactive Con...Breaking Down Silos: Building Collaborative Culture | Seattle Interactive Con...
Breaking Down Silos: Building Collaborative Culture | Seattle Interactive Con...
 
Culture in 6 slides - The New Reality
Culture in 6 slides - The New RealityCulture in 6 slides - The New Reality
Culture in 6 slides - The New Reality
 

Viewers also liked

Formato proyecto 38858
Formato proyecto 38858Formato proyecto 38858
Formato proyecto 38858angelmanuel22
 
Mind map on music brings us together
Mind map on music brings us togetherMind map on music brings us together
Mind map on music brings us togetherMichael
 
Draft ancillary film poster
Draft ancillary film poster Draft ancillary film poster
Draft ancillary film poster hannahodlin
 
Hacia un modelo de buenas prácticas en museística 2.0 del patrimonio históric...
Hacia un modelo de buenas prácticas en museística 2.0 del patrimonio históric...Hacia un modelo de buenas prácticas en museística 2.0 del patrimonio históric...
Hacia un modelo de buenas prácticas en museística 2.0 del patrimonio históric...Alazne Gonzalez-Santana
 
June Newsletter
June NewsletterJune Newsletter
June Newslettermjcunny
 
Bajaj Auto: Margins disappoint as discover woes continue
Bajaj Auto: Margins disappoint as discover woes continueBajaj Auto: Margins disappoint as discover woes continue
Bajaj Auto: Margins disappoint as discover woes continueIndiaNotes.com
 
La nube de internet (1)
La nube de internet (1)La nube de internet (1)
La nube de internet (1)Rocío Paredes
 
Cerveza1
Cerveza1Cerveza1
Cerveza1iont
 

Viewers also liked (13)

Formato proyecto 38858
Formato proyecto 38858Formato proyecto 38858
Formato proyecto 38858
 
Mind map on music brings us together
Mind map on music brings us togetherMind map on music brings us together
Mind map on music brings us together
 
Good presentation
Good presentationGood presentation
Good presentation
 
Draft ancillary film poster
Draft ancillary film poster Draft ancillary film poster
Draft ancillary film poster
 
Hacia un modelo de buenas prácticas en museística 2.0 del patrimonio históric...
Hacia un modelo de buenas prácticas en museística 2.0 del patrimonio históric...Hacia un modelo de buenas prácticas en museística 2.0 del patrimonio históric...
Hacia un modelo de buenas prácticas en museística 2.0 del patrimonio históric...
 
June Newsletter
June NewsletterJune Newsletter
June Newsletter
 
Bajaj Auto: Margins disappoint as discover woes continue
Bajaj Auto: Margins disappoint as discover woes continueBajaj Auto: Margins disappoint as discover woes continue
Bajaj Auto: Margins disappoint as discover woes continue
 
Cover
CoverCover
Cover
 
Trabajo de 27 03
Trabajo de 27 03Trabajo de 27 03
Trabajo de 27 03
 
La nube de internet (1)
La nube de internet (1)La nube de internet (1)
La nube de internet (1)
 
EFQM 2010
EFQM 2010EFQM 2010
EFQM 2010
 
Recursos Web
Recursos Web Recursos Web
Recursos Web
 
Cerveza1
Cerveza1Cerveza1
Cerveza1
 

Similar to I See What Your Saying

Workshop: By the People, for the People: Developing Digital Strategy That Mat...
Workshop: By the People, for the People: Developing Digital Strategy That Mat...Workshop: By the People, for the People: Developing Digital Strategy That Mat...
Workshop: By the People, for the People: Developing Digital Strategy That Mat...Dana Allen-Greil
 
(Socially Distanced) Participatory Design - Discovering Unmet Needs & New Sol...
(Socially Distanced) Participatory Design - Discovering Unmet Needs & New Sol...(Socially Distanced) Participatory Design - Discovering Unmet Needs & New Sol...
(Socially Distanced) Participatory Design - Discovering Unmet Needs & New Sol...Jennifer Briselli
 
G325 critical perspectives 1a
G325 critical perspectives 1aG325 critical perspectives 1a
G325 critical perspectives 1aGraveney School
 
Where to focus event innovation? - An audience led approach
Where to focus event innovation? - An audience led approachWhere to focus event innovation? - An audience led approach
Where to focus event innovation? - An audience led approachLive Union
 
From Looking to Making: An Introduction to Graphic Design
From Looking to Making: An Introduction to Graphic DesignFrom Looking to Making: An Introduction to Graphic Design
From Looking to Making: An Introduction to Graphic DesignOjus Doshi
 
Creative Energy Agency - Our Work & Innovative Process
Creative Energy Agency - Our Work & Innovative ProcessCreative Energy Agency - Our Work & Innovative Process
Creative Energy Agency - Our Work & Innovative ProcessDavin Skonberg
 
How to Succeed At Audience Engagement
How to Succeed At Audience EngagementHow to Succeed At Audience Engagement
How to Succeed At Audience EngagementSamuel J. Smith
 
Infographics for the social sector webinar
Infographics for the social sector webinarInfographics for the social sector webinar
Infographics for the social sector webinarStephen MacKley
 
2011 | Communication design highlights for service design
2011 | Communication design highlights for service design 2011 | Communication design highlights for service design
2011 | Communication design highlights for service design francesca // urijoe
 
18 Success Stories from Amazingly Interactive Events
18 Success Stories from Amazingly Interactive Events18 Success Stories from Amazingly Interactive Events
18 Success Stories from Amazingly Interactive EventsSlido
 
Power of-visual-communication-hp
Power of-visual-communication-hpPower of-visual-communication-hp
Power of-visual-communication-hpjackinthacker
 
Documentation Workbook Series. Step 4 Communicating Information
Documentation Workbook Series. Step 4 Communicating InformationDocumentation Workbook Series. Step 4 Communicating Information
Documentation Workbook Series. Step 4 Communicating InformationAdrienne Bellehumeur
 
SXSW 2017 Mitchell Takeaways
SXSW 2017 Mitchell TakeawaysSXSW 2017 Mitchell Takeaways
SXSW 2017 Mitchell TakeawaysMitchell
 
SXSW 2017 Mitchell Takeaways
SXSW 2017 Mitchell TakeawaysSXSW 2017 Mitchell Takeaways
SXSW 2017 Mitchell TakeawaysEmma Huett
 
SXSW 2017 takeaways
SXSW 2017 takeawaysSXSW 2017 takeaways
SXSW 2017 takeawaysEmma Huett
 
Using Visual Aids in Public Speaking
Using Visual Aids in Public SpeakingUsing Visual Aids in Public Speaking
Using Visual Aids in Public Speakingcurlycyberspace54
 
How to Entertain audiences using data led content - Trend Report Spring 2015
How to Entertain audiences using data led content - Trend Report Spring 2015How to Entertain audiences using data led content - Trend Report Spring 2015
How to Entertain audiences using data led content - Trend Report Spring 2015infogr8
 

Similar to I See What Your Saying (20)

Workshop: By the People, for the People: Developing Digital Strategy That Mat...
Workshop: By the People, for the People: Developing Digital Strategy That Mat...Workshop: By the People, for the People: Developing Digital Strategy That Mat...
Workshop: By the People, for the People: Developing Digital Strategy That Mat...
 
G325 digital technology
G325 digital technologyG325 digital technology
G325 digital technology
 
Visual Explanations
Visual ExplanationsVisual Explanations
Visual Explanations
 
(Socially Distanced) Participatory Design - Discovering Unmet Needs & New Sol...
(Socially Distanced) Participatory Design - Discovering Unmet Needs & New Sol...(Socially Distanced) Participatory Design - Discovering Unmet Needs & New Sol...
(Socially Distanced) Participatory Design - Discovering Unmet Needs & New Sol...
 
G325 critical perspectives 1a
G325 critical perspectives 1aG325 critical perspectives 1a
G325 critical perspectives 1a
 
Where to focus event innovation? - An audience led approach
Where to focus event innovation? - An audience led approachWhere to focus event innovation? - An audience led approach
Where to focus event innovation? - An audience led approach
 
From Looking to Making: An Introduction to Graphic Design
From Looking to Making: An Introduction to Graphic DesignFrom Looking to Making: An Introduction to Graphic Design
From Looking to Making: An Introduction to Graphic Design
 
Creative Energy Agency - Our Work & Innovative Process
Creative Energy Agency - Our Work & Innovative ProcessCreative Energy Agency - Our Work & Innovative Process
Creative Energy Agency - Our Work & Innovative Process
 
How to Succeed At Audience Engagement
How to Succeed At Audience EngagementHow to Succeed At Audience Engagement
How to Succeed At Audience Engagement
 
Linear-time diagrams
Linear-time diagramsLinear-time diagrams
Linear-time diagrams
 
Infographics for the social sector webinar
Infographics for the social sector webinarInfographics for the social sector webinar
Infographics for the social sector webinar
 
2011 | Communication design highlights for service design
2011 | Communication design highlights for service design 2011 | Communication design highlights for service design
2011 | Communication design highlights for service design
 
18 Success Stories from Amazingly Interactive Events
18 Success Stories from Amazingly Interactive Events18 Success Stories from Amazingly Interactive Events
18 Success Stories from Amazingly Interactive Events
 
Power of-visual-communication-hp
Power of-visual-communication-hpPower of-visual-communication-hp
Power of-visual-communication-hp
 
Documentation Workbook Series. Step 4 Communicating Information
Documentation Workbook Series. Step 4 Communicating InformationDocumentation Workbook Series. Step 4 Communicating Information
Documentation Workbook Series. Step 4 Communicating Information
 
SXSW 2017 Mitchell Takeaways
SXSW 2017 Mitchell TakeawaysSXSW 2017 Mitchell Takeaways
SXSW 2017 Mitchell Takeaways
 
SXSW 2017 Mitchell Takeaways
SXSW 2017 Mitchell TakeawaysSXSW 2017 Mitchell Takeaways
SXSW 2017 Mitchell Takeaways
 
SXSW 2017 takeaways
SXSW 2017 takeawaysSXSW 2017 takeaways
SXSW 2017 takeaways
 
Using Visual Aids in Public Speaking
Using Visual Aids in Public SpeakingUsing Visual Aids in Public Speaking
Using Visual Aids in Public Speaking
 
How to Entertain audiences using data led content - Trend Report Spring 2015
How to Entertain audiences using data led content - Trend Report Spring 2015How to Entertain audiences using data led content - Trend Report Spring 2015
How to Entertain audiences using data led content - Trend Report Spring 2015
 

More from Amanda Boddington

Interview With: James Musick Part 2
Interview With: James Musick Part 2Interview With: James Musick Part 2
Interview With: James Musick Part 2Amanda Boddington
 
Interview With: James Musick
Interview With: James Musick Interview With: James Musick
Interview With: James Musick Amanda Boddington
 
Product Serialization’s: Impact on Profitability
Product Serialization’s: Impact on ProfitabilityProduct Serialization’s: Impact on Profitability
Product Serialization’s: Impact on ProfitabilityAmanda Boddington
 
Generics and the Animal Health Industry
Generics and the Animal Health IndustryGenerics and the Animal Health Industry
Generics and the Animal Health IndustryAmanda Boddington
 
Forewarned is Forearmed ~ Part II ~
Forewarned is Forearmed  ~ Part II ~Forewarned is Forearmed  ~ Part II ~
Forewarned is Forearmed ~ Part II ~Amanda Boddington
 
Grow Your Company in 60 Minutes
Grow Your Company in 60 MinutesGrow Your Company in 60 Minutes
Grow Your Company in 60 MinutesAmanda Boddington
 
Origins of India's Patent Law
Origins of India's Patent LawOrigins of India's Patent Law
Origins of India's Patent LawAmanda Boddington
 
Brazillian Market Favours Entry of Foreign Groups
Brazillian Market Favours Entry of Foreign GroupsBrazillian Market Favours Entry of Foreign Groups
Brazillian Market Favours Entry of Foreign GroupsAmanda Boddington
 
How GDUFA Could Kill Your US Business Plan
How GDUFA Could Kill Your US Business PlanHow GDUFA Could Kill Your US Business Plan
How GDUFA Could Kill Your US Business PlanAmanda Boddington
 
Generic Pharma 2.0: 10 Potential Industry Game Changers
Generic Pharma 2.0: 10 Potential Industry Game ChangersGeneric Pharma 2.0: 10 Potential Industry Game Changers
Generic Pharma 2.0: 10 Potential Industry Game ChangersAmanda Boddington
 

More from Amanda Boddington (12)

Interview With: James Musick Part 2
Interview With: James Musick Part 2Interview With: James Musick Part 2
Interview With: James Musick Part 2
 
Interview With: James Musick
Interview With: James Musick Interview With: James Musick
Interview With: James Musick
 
Product Serialization’s: Impact on Profitability
Product Serialization’s: Impact on ProfitabilityProduct Serialization’s: Impact on Profitability
Product Serialization’s: Impact on Profitability
 
Generics and the Animal Health Industry
Generics and the Animal Health IndustryGenerics and the Animal Health Industry
Generics and the Animal Health Industry
 
Forewarned is Forearmed ~ Part II ~
Forewarned is Forearmed  ~ Part II ~Forewarned is Forearmed  ~ Part II ~
Forewarned is Forearmed ~ Part II ~
 
Biologics This Decade
Biologics This DecadeBiologics This Decade
Biologics This Decade
 
Grow Your Company in 60 Minutes
Grow Your Company in 60 MinutesGrow Your Company in 60 Minutes
Grow Your Company in 60 Minutes
 
Origins of India's Patent Law
Origins of India's Patent LawOrigins of India's Patent Law
Origins of India's Patent Law
 
Brazillian Market Favours Entry of Foreign Groups
Brazillian Market Favours Entry of Foreign GroupsBrazillian Market Favours Entry of Foreign Groups
Brazillian Market Favours Entry of Foreign Groups
 
Social Pharma Faces
Social Pharma FacesSocial Pharma Faces
Social Pharma Faces
 
How GDUFA Could Kill Your US Business Plan
How GDUFA Could Kill Your US Business PlanHow GDUFA Could Kill Your US Business Plan
How GDUFA Could Kill Your US Business Plan
 
Generic Pharma 2.0: 10 Potential Industry Game Changers
Generic Pharma 2.0: 10 Potential Industry Game ChangersGeneric Pharma 2.0: 10 Potential Industry Game Changers
Generic Pharma 2.0: 10 Potential Industry Game Changers
 

I See What Your Saying

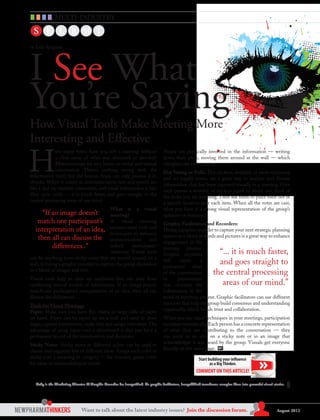
  • 1. Want to talk about the latest industry issues? Join the discussion forum. August 2012 I See What You’re SayingHow Visual Tools Make Meeting More Interesting and Effective by Kelly Kingman Kelly is the Marketing Director & Graphic Recorder for Imagethink. As graphic facilitators, ImageThink transforms complex ideas into powerful visual stories. MULTI-INDUSTRY H ow many times have you left a meeting without a clear sense of what was discussed or decided? Most meetings are very heavy on verbal and textual information. There’s nothing wrong with the information itself, but the human brain can only process it in chunks. When it comes to communication, text and speech are like a dial-up internet connection, and visual information is like fiber optic cable — it is much faster, and goes straight to the central processing areas of our mind. What is a visual meeting? A visual meeting utilizes visual tools and techniques to enhance communication and unlock participants’ creativity. Visual tools can be anything from sticky notes that are moved around on a wall, to hiring a graphic recorder to capture the group discussion in a blend of images and text. Visual tools help to clear up confusion that can arise from conflicting mental models of information. If an image doesn’t match one participant’s interpretation of an idea, then all can discuss the differences. Tools for Visual Meetings Paper: Make sure you have flip charts or large rolls of paper on hand. Paper can be taped up on a wall and used to draw maps, capture brainstorms, make lists and assign next steps.The advantage of using paper over a whiteboard is that you have a permanent record of the conversation and decisions. Sticky Notes: Sticky notes in different colors can be used to cluster and organize lots of different ideas. Assign each color of sticky note a meaning or category — for instance, green notes for ideas on sustainability, et cetera. People are physically involved in the information — writing down their ideas, moving them around at the wall — which energizes the entire group. Dot Voting or Polls: Dot stickers, available at most stationery and art supply stores, are a great way to analyze and discuss information that has been captured visually in a meeting. Give each person a number of stickers equal to about one third of the items you are assessing. Then ask them to place their dot in a specific location near each item. When all the votes are cast, what you have is a strong visual representation of the group’s opinions or interests. Graphic Facilitators and Recorders: Hiring a graphic recorder to capture your next strategic planning session in a blend of words and pictures is a great way to enhance engagement in the meeting process. Graphic recorders will create a permanent chart of the conversation or presentation that cements the information in the mind of everyone present. Graphic facilitators can use different exercises that help the group build consensus and understanding organically, which builds trust and collaboration. When you use visual techniques in your meetings, participation increases dramatically.Each person has a concrete representation of what they are contributing to the conversation — they can point to an idea on a sticky note or in an image that acknowledges it was heard by the group. Visuals get everyone literally on the same page. “If an image doesn’t match one participant’s interpretation of an idea, then all can discuss the differences..” “... it is much faster, and goes straight to the central processing areas of our mind.”