Download as PDF, PPTX


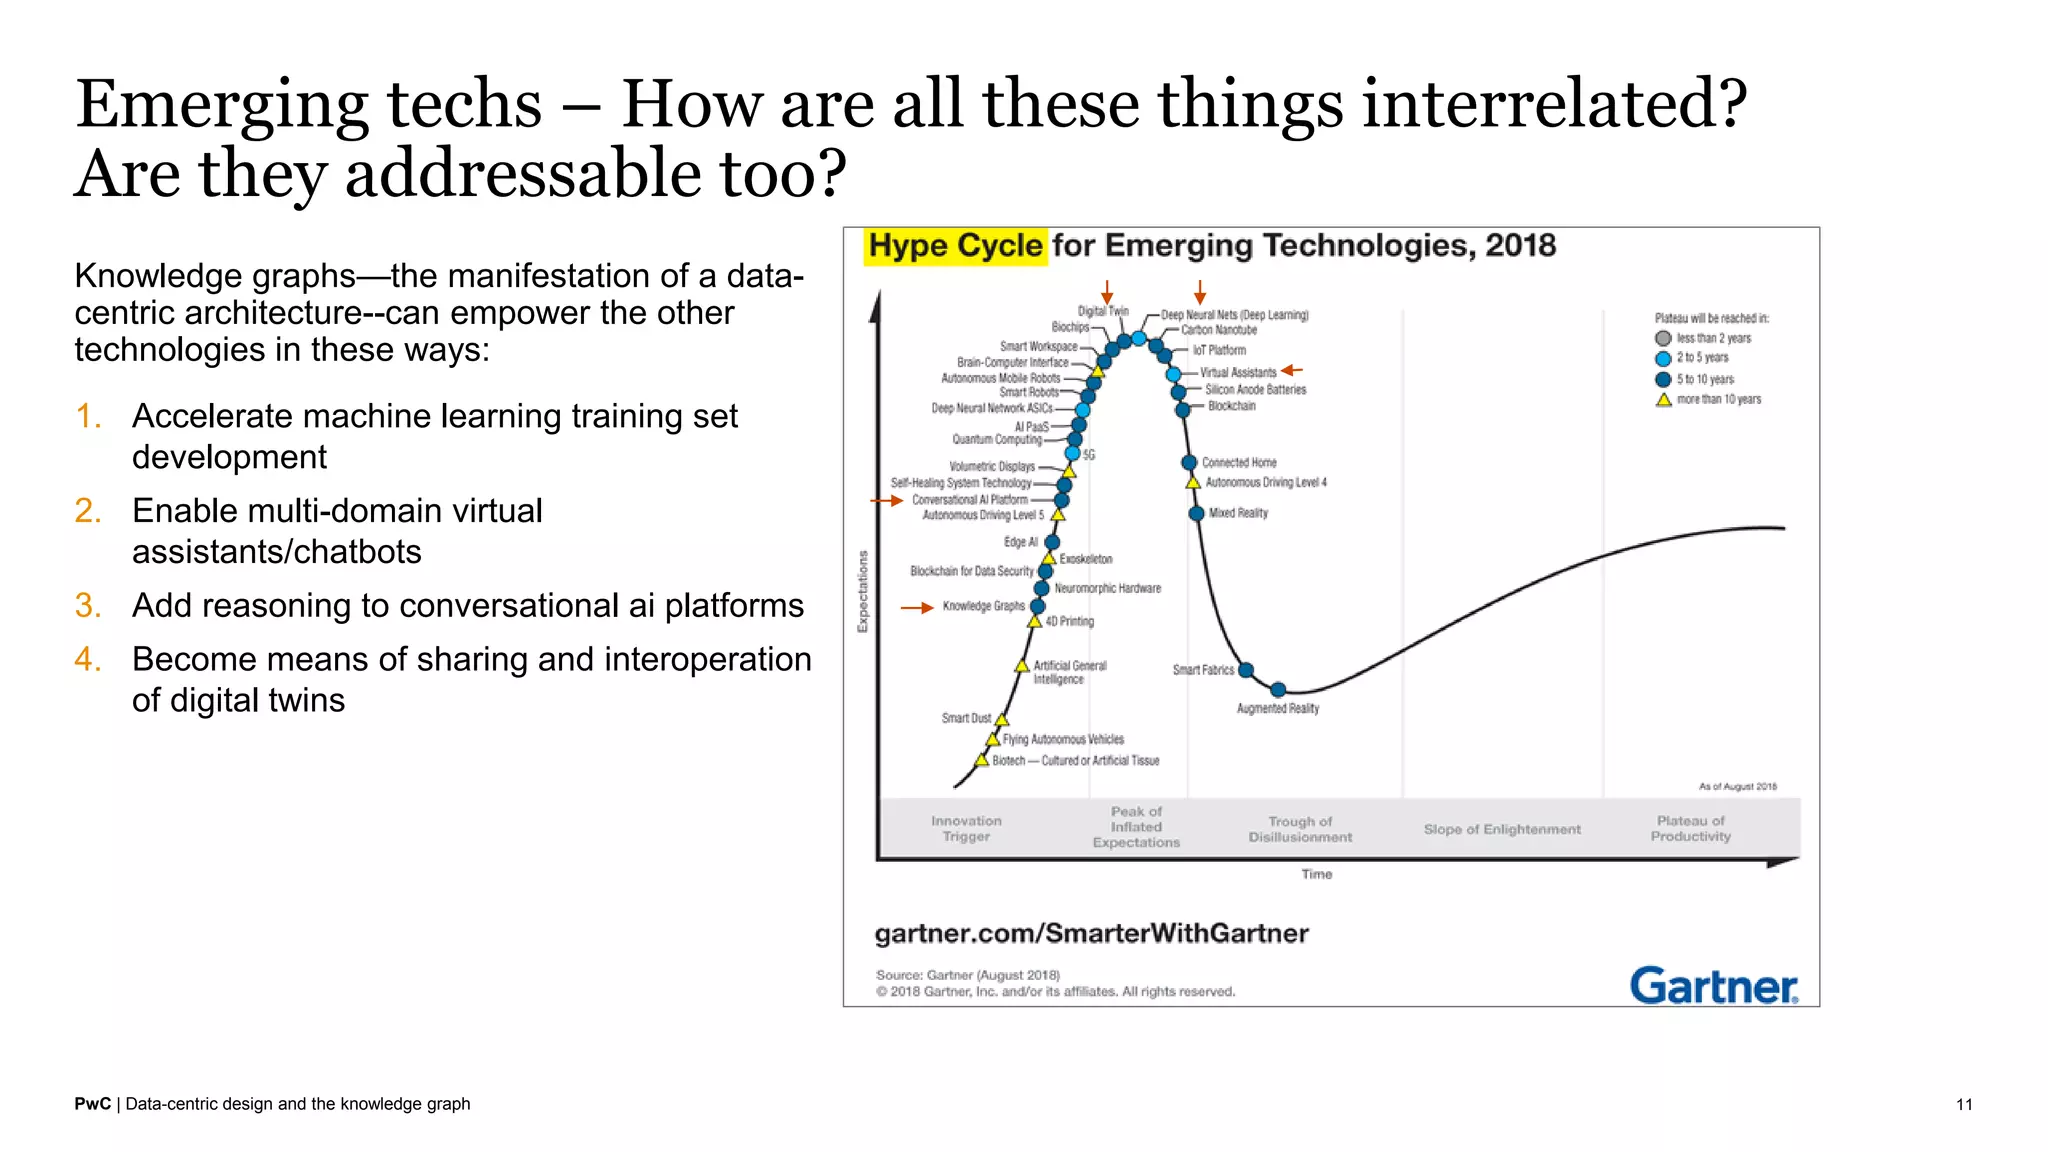


The document discusses the growing importance of digital twins, knowledge graphs, and data-centric approaches to managing large, diverse datasets. It notes that current methods often struggle to integrate and contextualize data at scale. Effective digital twins and AI require integrated, disambiguated data flowing to where it's needed. Knowledge graphs are presented as a way to achieve this by providing a unified semantic model that treats relationships as a first-class citizen. The document outlines the large and growing markets for knowledge graph technologies and discusses how a data-centric approach can help enterprises better leverage emerging technologies.