2. NC Standards
• NC.8.F.3 - Identify linear functions from table, equations and graphs.
• NC.8.F.4 Analyze functions that model linear relationships.
• • Understand that a linear relationship can be generalized by 𝑦= 𝑚x + 𝑏.
• • Write an equation in slope-intercept form to model a linear relationship
by determining the rate of change and the initial value, given at least two
(x, y)values or a graph.
• • Construct a graph of a linear relationship given an equation in slope-
intercept form.
• • Interpret the rate of change and initial value of a linear function in terms
of the situation it models, and in terms of the slope and y-intercept of its
graph or a table of values.
• Clarification Checking for Understanding
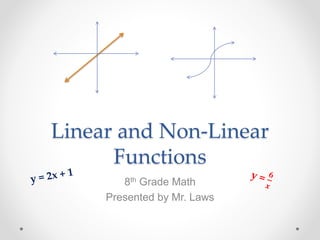
4. What is a Linear or Non-
Linear Function?
1. A linear function is a specific function when graphed,
will form a straight line on a coordinate plane.
2. A non-linear function is a specific function when
graphed, will not form a straight line on a coordinate
plane.
3. A linear function can be represented by a graph, an
equation, or a function table.
5. Linear Function (Graph)
4. A linear function graph is a set of order pairs (x,y) when
plotted will form a straight line on a coordinate plane.
y
x
Since these graphs displays a straight line, these are linear graphs.
y
x
y
x
y
x
7. A Linear Equations
6. A linear equation is an equation when graphed on a coordinate
plane, will form a straight line.
7. It is based on a math formula called slope intercept form (SIF):
slope
y = mx + b
input
output
y- intercept
Examples:
y = 2x + 1 y = 1
y = 3x
y = -x – 1 y = -x y = -7
y =
𝑥
6
y = -
3
4
x – 5
y =
1
2
x – 6
8. Non-Linear Equations
8. Non – Linear equations are equations when graphed, will not form a
straight line.
9. Non-Linear equations when graph, will form a curve or bent line.
10. Non – Linear equations do not match slope intercept form
(y=mx+b).
Examples:
y = 2x2 + 1 y = 8x2 + 1x y = 4x y =
𝟔
𝒙
9. Linear Function Table
11. Linear Function tables are functions tables when graphed on a
coordinate plane, will form a straight line.
12. For it to be a linear function, both the x-value and y- value must
have a constant rate of change.
X 1 2 3 4 5
Y 2 4 6 8 10
+ 2 + 2 + 2 + 2
+ 1 + 1 + 1
+ 1
The x-value has a constant
rate of change of plus 1.
The y-value has a constant
rate of change of plus 2.
Since both x and y value have
a constant rate of change, this
is a linear function table.
Constant rate of change =
𝐶ℎ𝑎𝑛𝑔𝑒𝑠 𝑜𝑓 𝑦
𝐶ℎ𝑎𝑛𝑔𝑒𝑠 𝑜𝑓 𝑥
10. Non-Linear Function Non
Non Linear Tables
13.Non - Linear Function tables are functions tables that
do not have a constant rate change in either the x-
value or y-value or both.
X 1 2 3 4 5
Y 2 3 8 12 20
+ 1 + 5 +4 + 8
+ 1 + 1 + 1
+ 1 The x-value has a constant
rate of change of plus 1.
The y-value does not have a
constant rate of change. This
function table is non-linear.
11. Summary
• Can you answer the essential question?
• Do you have any questions on what you have
learned?
• Will you be able to write a summary based on the
lesson?