1. Ain-Shams University Student Research
This report is published for educational purposes only by
students competing in the CFA Institute Research
Challenge.
Textile, Apparel and retailing
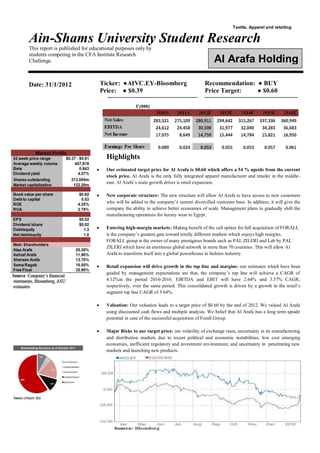
Ticker: ●AIVC.EY-Bloomberg Recommendation: ● BUY
Price: ● $0.39
ـــــــــــــــــــــــــــــــــــــــــــــــــــــــــــــــــــــــــــــــــ
Price Target: ● $0.60
ــــــــــــــــــــــــــــــــــــــــــــــــــــــــــــــــــــــــــــــــــــ
Highlights
Our estimated target price for Al Arafa is $0.60 which offers a 54 % upside from the current
stock price. Al Arafa is the only fully integrated apparel manufacturer and retailer in the middle-
east. Al Arafa‘s main growth driver is retail expansion.
New corporate structure: The new structure will allow Al Arafa to have access to new customers
who will be added to the company‘s current diversified customer base. In addition, it will give the
company the ability to achieve better economies of scale. Management plans to gradually shift the
manufacturing operations for luxury wear to Egypt.
Entering high-margin markets: Making benefit of the call option for full acquisition of FORALL
is the company‘s greatest gate toward totally different markets which enjoys high margins.
FORALL group is the owner of many prestigious brands such as PAL ZILERI and Lab by PAL
ZILERI which have an enormous global network in more than 70 countries. This will allow Al
Arafa to transform itself into a global powerhouse in fashion industry.
Retail expansion will drive growth in the top line and margins: our estimates which have been
guided by management expectations are that, the company‘s top line will achieve a CAGR of
4.12%in the period 2010-2016. EBITDA and EBIT will have 2.64% and 3.57% CAGR,
respectively, over the same period. This consolidated growth is driven by a growth in the retail‘s
segment top line CAGR of 5.64%.
Valuation: Our valuation leads to a target price of $0.60 by the end of 2012. We valued Al Arafa
using discounted cash flows and multiple analysis. We belief that Al Arafa has a long term upside
potential in case of the successful acquisition of Forall Group.
Major Risks to our target price: are volatility of exchange rates, uncertainty in its manufacturing
and distribution markets due to recent political and economic instabilities, low cost emerging
economies, inefficient regulatory and investment environment, and uncertainty in penetrating new
markets and launching new products.
Al Arafa Holding
Date: 31/1/2012
2. CFA Institute Research Challenge 31/1/2012
2
Business Description
Al Arafa for Investments and Consultancies (AIVC) was established in 2006 as a publicly traded
company, but it has a history that goes back to the 1900s. It was founded in 1907 as a family fabric retail
business in Egypt. It was nationalized in 1956, and the family business was re-launched in 1974. Through
many acquisitions and establishing new factories, Al Arafa continued to maintain growth till it reached its
current remarkable position. Since 2006, the company‘s IPO, the company has expanded internationally with
strategic acquisitions (Melka, SRG, John Langford, Forall Confezioni), expansions and consolidations (Baird
Group, Egyptian Portuguese Company, Apparel International), and partnerships (Forall Group) (See
Appendix 3).It is famous for its worldwide brands such as Debenhams, Concrete, and House of Frasers. Its
key customers include globally recognized names such as GAP, Macy‘s, Zara, and Marks & Spencer. Al
Arafa group is the largest exporter in Egypt accounting for more than 10% of the country‘s exports of
readymade garments (8.2 million of the Egyptian textile segment revenue and 27.4 million of the apparel
segment revenue). The company has about 12,000 employees.
The main strengths: Al Arafa is the only fully integrated apparel manufacturer and retailer in the Middle
East which enables the company to achieve synergy in its value chain (See Figure 2 & Appendix 2). Al
Arafa‘s geographical position in Egypt gives the advantage of proximity to end global fashion markets. The
relatively low cost Egyptian labor (which amounts to approximately one fifth of the labor cost in UK), the
preferential trade agreements with neighboring countries, and Government incentives programs encouraging
exports are added strengths.(please see Appendix 30 for detailed SWOT analysis)
Business Units:
The three key operational segments for Al Arafa are Textile, Apparel &Tailoring (A&T), and Retail.
A) Textile: Al Arafa‘s smallest segment accounting for about 4.5% of revenue in 2010 through the sales of
wool fabrics and Yarns. It produces 3.5 million meters of fabric/year and 1250 tons of Yarn/year. It exports
60% of the production while the remaining 40% represents intercompany sales. It represents the first phase in
the vertically integrated system. In this segment, Al Arafa operates through two companies which are:
1) GoldenTex: This is a fully integrated textile manufacturing operation engaged in dyeing, spinning,
weaving and finishing wool and wool blended fabrics and it is the only wool manufacturer in its class in the
Middle East.
2) WhiteHead Spinning: This Company is highly complementary to the GoldenTex Group, manufacturing
the yarns that GoldenTex weaves into fabrics.
B) Apparel & Tailoring (A&T): The second phase in the vertically integrated system representing 30% of
revenues, 28% of which are intercompany sales in 2010. It is engaged in the production of formal and casual
garments. It produces about 2 million suits every year and exports almost 90% of the production to USA and
Europe. Al Arafa‘s A&T segment operates through:
1) Swiss Garments Company (SGC): the largest company within the Apparel & Tailoring Segment,
exporting 100% of its output. It supplies men's casual wear to long term customers in the US, including
Macy's, JC Penny and Gap Inc. BMB is its largest customer in the UK, buying over 300,000 men's suits to
distribute through its wholesale network, retail outlets and concessions across the UK.
2) Concrete Manufacturing: is a well-established brand in the local apparel retailing market, and has
managed to compete with numerous international and local brands with competitive strengths that uniquely
position it in the local market.
3) Egypt Tailoring Company (ETC): specializes in producing full and half canvas suits for European
customers such as the joint venture company (Querini), leading brands such as Valentino and Jaeger, and
dedicated production lines for Hugo Boss and Philipp, a German wholesaler.
4) Swiss Cotton Garments Company (SCG):The target is to delocalize the operations by establishing a new
production facility in Beni-Sweif, moving closer to labor pools means cost savings and reduces externalities
3. CFA Institute Research Challenge 31/1/2012
3
on the environment that are caused by vehicles used to transport workers, with an area of 152,900 m sq. as a
private free zone.
5) Port Said Garments Company: This Company owns 50% of Middle East Tailoring Company (METCO)
in a joint venture with Bagir, a major supplier to Marks & Spencer. METCO's output is exclusively directed at
Marks & Spencer.
In 2010, a Joint Venture was signed to establish a formal shirt manufacturing company under the name of
―Crystal for Making Shirts‖ to produce formal shirts for men and women. Al Arafa owns 60% of the JV
while the Italian partner (SAITT) holds the remaining 40%. In August 2011, Al Arafa signed a JV with
Ermenegildo Zegna (50%:50%) to establish a luxury shirt manufacturing company under the name of
―CAMEGIT for Garment Manufacturing‖.
C) Retail: Al Arafa‘s biggest segment which accounts for about 65.5% of revenues, 98% of which are to
external customers in 2010. It is the final phase in the company‘s integrated system acting as the distribution
channel for the company‘s apparel & tailoring, and textile segments. The company depends on retail
expansion as it creates demand for the other two segments. This segment operates through :
1) BMB Group: the UK's largest menswear concessionaire with over 580 in-store shops in high street giants
such as Selfridges, House of Fraser and Debenhams. It is also one of the UK's largest wholesalers trading
through over 1,000 outlets. Selling over 1 million men's suits every year, it has around a 22% share of the UK
market. In 2009, Al Arafa formed The Baird Group to consolidate its UK subsidiaries.
2) Concrete: the leading Egyptian men's formal wear and casual clothing retailer, with 45 outlets in prime
retail sites across Egypt. It also leads the high quality children's wear market.
3) Euromed: Under the ‗Brands for Less' name, Euromed operates discount retail outlets in Egypt, selling
excess capacity from the Apparel & Tailoring Segment.
4) Querini: A joint venture with leading Italian retailer and manufacturer, Forall Group, to manufacture and
distribute full canvas men's suits to the Italian market.
Now, the company is taking its vertical integration into the next level, which shifts from the current company-
wide application, focusing on products, to a markets and sectors application, focusing on consumers.
FORALL GROUP: is the owner of several prestigious brands, including PAL ZILERI and Lab by PAL
ZILERI that enjoy a strong global presence in more than 70 countries. Arafa and Forall Group will benefit
from the country‘s low cost profile as FORALL is negotiating the license to manufacture additional products
through Al Arafa Holding in Egypt so that Al Arafa Holding‘s facilities will be able to manufacture PAL
ZILERI products.
Industry overview and Competitive Positioning
The core industry of Al Arafa can be divided into two main categories; the first is Textile &Apparel
manufacturing. The second is Apparel Retail.
Textile &Apparel manufacturing: Although the global textile & apparel industry has been expanding at a
rapid rate since the early 1970s, the industry has experienced two major crises in the past five years.
The first crisis is regulatory: The Multi-Fiber Arrangement (MFA), which established quotas and preferential
tariffs on apparel and textile items imported by the United States, Canada, and many European nations since
the early 1970s, was phased out by the World Trade Organization (WTO) between 1995 and 2005 via its
Agreement on Textiles and Clothing. The concern of many poor and small developing economies that relied
on apparel exports was that they would be pushed out of the global trading system by much larger, low-cost
rivals, such as China, India, and Bangladesh.
The removal of quotas on January 1, 2005 marked the end of over 30 years of restricted access to the markets
of the European Union and North America. Retailers and other buyers became free to source textiles and
apparel in any amount from any country, subject only to a system of tariffs and a narrow set of transitional
safeguards that expired at the end of 2008
4. CFA Institute Research Challenge 31/1/2012
4
The second crisis is economic: The global recession, which was sparked by the banking meltdown in the
United States in 2008 and quickly spread to most of the major industrialized and developing economies,
brought the world to the brink of the most severe economic crisis since the Great Depression of the 1930s.
The recession hit the apparel industry especially hard, leading to factory shutdowns, sharp increases in
unemployment, and growing concerns over social unrest as displaced workers sought new jobs.
Consumption in the global apparel industry is highly concentrated in three main regions: the United States,
the European Union, and Japan. In 2008, the European Union accounted for nearly half (47.3%) of total
world apparel imports of US$ 376 billion, while the United States accounted for 22%, Japan for 6.9%, and
the Russian Federation for 5.7%. Particularly notable is the steady decline in the U.S. share of global apparel
imports, which fell from a peak of 32.1% in 2000 to 22% in 2008.
During the recession, global apparel imports increased by nearly 7% ($22.3 billion) between 2007 and 2008.
U.S. imports declined during this period, but those of the EU-27 grew. In 2008, Europe accounted for 41% of
global apparel retail sales of $1,026 billion. China is the clear winner by far in the global apparel export race
during the past 15 years. Between 1995 and 2010, China more than doubled its share of global apparel
exports from 15.2% to 33.2 %, and it had a fivefold increase in the value of its apparel exports, from $24
billion to $120 billion. Although, leading firms continue to source the majority of products from China, they
also seek to diversify into other countries to avoid putting all their eggs in one basket.
The main apparel exporting countries can be placed into the following categories:
Steady Growth Suppliers (overall increasing market share since the early 1990s): China, Bangladesh, India,
Vietnam, and Cambodia; Pakistan and Egypt as well, but with smaller market shares.
Split Market Suppliers: Indonesia is increasing its market share in the United States and Japan, and
decreasing in the EU-15; conversely, Sri Lanka is increasing market share in the EU-15 and decreasing in the
United States.
Pre-MFA Suppliers (sharp declines after MFA quota phase-out that have accelerated during the crisis):
Canada, Mexico, CAFTA, EU-12, Tunisia, Morocco, and Thailand.
Past-Prime Suppliers: (decreasing since early 1990s): Hong Kong, South Korea, Taiwan, Malaysia; also
countries with smaller market shares: Philippines, Singapore, and Macau.
The following factors have long been important in apparel sourcing strategies:
Cost/Price: During the recession, consumers are placing more emphasis on price, thus causing retailers and
brand marketers to focus on reducing costs
Product Quality: Firms must provide quality in addition to low prices, flexible production, and services.
Supplier Flexibility: Firms are under pressure to make multiple products in small runs in order to deal with
decreased demand and niche markets
Visibility/Transparency: Growing consumer demand for higher social and environmental standards has
increased the need for supply chain transparency in both the United States and the European Union. Lead
firms want to know more about their suppliers to ensure they uphold the principles of the brands
Full Package Capabilities: Suppliers need to be able to offer full package options that expand their
capabilities to other parts of the value chain—including design, inventory management, and transportation of
goods, and adopt the appropriate technologies to facilitate this transition.
In Egypt: Apparel manufacturing is the second largest sector after the agro-industry and the first source in
terms of jobs accounting for more than 30% of local employment. It accounts for 3% of the GDP, 27% of
industrial output and around 14% of non-petroleum exports (Source: CB of Egypt). It is the fifth largest
source of foreign earnings after oil, remittances, tourism and earnings from Suez Canal.
The ready-made garment subsector (RMG) produced more than 313 million pieces in 2009 with global
brands such as Marks & Spencer, GAP, Wal-Mart and Levi. Egypt exports reached more than 213 billion
USD worth of textile and RMG distributed as 55% RMG, 23% textile and 21% weaving.
Egypt is the European Union's (EU) sixteenth largest supplier of clothing in 2010 and is becoming a more
important exporter. Egypt is USA‘s eighteenth largest exporter in 2010. After the expiration of the Multi-
fiber agreement in 2005, the Egyptian exports to USA have grown from USD 0.6 billion to USD 1.06 billion
between 2005 and 2010 (See Figures 6&7&9). Exports of Egypt to UK have grown by 20% compared to the
Chinese exports‘ huge growth of 200% over the same period. Apparently, the competition from the Asian
emerging export markets like China, Bangladesh and Vietnam is intensified despite the safeguarding
measures imposed against those markets by EU and USA. However, the Egyptian economy‘s labor intensive
nature, along with its geographical location would give Egypt a competitive advantage. Egypt‘s free trade
agreement with the EU, QIZ agreement with USA, and other trade agreements with other countries are added
advantage.
5. CFA Institute Research Challenge 31/1/2012
5
Retail: According to the 2011 A.T. Kearney Global Retail Development Index (GRDI)* (See Appendix 4 A,
Table 9), The population has grown 11%, from 5 billion to 5.7 billion, retail sales per capita have risen by
more than 90%, from $2,000 to $3,850, and retail sales space has expanded by more than 200%, from 40
million to 130 million square meters. In the past two years, a few trends shaped the global apparel retail
market. After a downturn in 2009, the market is recovering and forecast to accelerate, thanks to more apparel
consumption, increased disposable income, low interest rates and improving consumer sentiment. E-
commerce is also helping, as clothing retailers use it to "test" a market without significant capital
expenditures. A few retailers use this tactic, including J. Crew, Gap, and Victoria's Secret. The Apparel
GRDI (See Appendix 4 B, Table 9) places China and UAE as the most attractive retail markets for Apparel
products. Even though the retail segment of AIVC is widely distributed over more than 70 countries, the
major retail markets for Al Arafa can be divided into three main geographical markets: UK, US and Egypt.
UK: The UK retail market is worth 32.3 billion GBP in 2010. As a result of price pressures and upward
trends of rents and rates, the UK apparel retail sector is experiencing relatively poor performance.
Factors affecting competition include: New entrants, Branding/Private labels, Advertising, Market
segmentation, competitors focus, and consumer power.
Among the recent trends reshaping the UK retail market are the declining growth rates of the demand for the
Apparel products. The global financial crisis followed by the euro zone debt crisis had the direct impact on
that decline, primarily through the negative attitude that such events have on customers of the apparel
products.
The market becomes more competitive as a result of lower growth and the invasion of non-specialists, not all
players can survive. As a result, the middle market (e.g. Marks & Spencer) is getting more squeezed (See
Figure 11). This segment is expected to lose share out by 2014. The market is also affected by the
demographic changes as the number of the 65+ (elder population) will increase. The 65+ segment will be
lucrative over the next ten years. (See figure 8)
Egypt: Growth despite turmoil. After the gradual settling of the demonstrations in Egypt, the movement
could lay the groundwork for a promising mid- to long-term retail opportunity. Egypt moved up one spot this
year, to 12th place in the GRDI. (See Figure 12)
Egypt's retail market is expected to grow 10% over the next five years, driven by a large, active and growing
population of more than 80.4 million that is gaining purchasing power. Still, Egypt has a low share of modern
retailing compared to other North African countries such as Morocco and Tunisia. This, coupled with low
levels of market consolidation and growing consumer demand, continues to make Egypt attractive for large
global retailers.
Policy reforms in Egypt, such as tariff and tax reductions, helped pave the way for entry by foreign non-
grocery retailers. In 2010, Marks & Spencer opened its first Egyptian store in conjunction with UAE-based
franchise partner Al-Futtaim Group, while Debenhams (one of Al Arafa customers) expanded into Africa
with its first store in the Alexandria City Centre mall. Regional stability will attract more retail investments—
as both local and international retailers were forced to shut down temporarily in Cairo and Alexandria due to
the violent protests early in 2011. Since 2005, international retailers such as Zara, Paul & Shark,Lacoste and
Benetton have entered the market as malls opened in the capital Cairo and are adding competitive pressures.
US: US is considered to be one of the most consuming markets in the whole world that the best and most
profitable retail stores in the U.S. retail industry are also some of the largest retailers in the world. Spending
in the apparel sector of the retail industry has declined every quarter since the third quarter of 2008. In 2010,
a recovery has been observed. (See Figure 13)
The U.S retail clothing industry includes approximately 100,000 stores nationwide and accumulates a
combined $150 billion in revenues each year. The retail clothing industry is very concentrated and the 50
largest companies bring in 65% of the total industry revenue. JC Penny, Macy‘s, Kohl‘s, Abercrombie &
Fitch and Nordstrom are among the leading retailers in U.S.
Each of the 3 product-based segments (casual, formal and luxury) has its own key drivers that will determine
the competitive position of each firm in that segment.
-For the casual wear segment, most of the targeted consumers are aged form 15-35 years which forces price
and fashion to be the main drivers of this segment.
-For the formal wear segment, prices and quality are the main drivers. The tough competition -especially in
Europe – is leading to downward trend in prices while maintaining the level of quality.
- Finally the luxury wear segment; it targets the high-end consumers, where price represents less priority.
The key drivers of this segment are brand and quality.
There are several factors that affect the competition trend in the retail segment, such as:-
6. CFA Institute Research Challenge 31/1/2012
6
-Quality: referring to the fabrics and quality of materials used especially in the formal and high end market.
Recently, Al Arafa is successfully acquiring the European garment quality and know-how as they are taking
benefits from their joint ventures in Portugal and Italy while producing them locally, which gives them
acceleration in their quality while maintaining their advantage of low production cost.
-Price: referring to its selling price abroad and the factors that affect it such as labor costs, trade agreements,
and government intensives. Lately, Arafa is setting up its facilities in the Beni Sweif, giving it a cutting edge
as a high quality producer with reasonable prices, as Egypt is ranked the 10th lowest labor cost in textile
production worldwide. Also when it comes to prices, Arafa‘s main competitors would be the Southeast Asian
countries such as Vietnam, China, Bangladesh, India, and Indonesia, who also export their textile and
garments production to the Europe and the US for good quality with reasonable or low prices.
-Brands: referring to the suppliers exporting to international and well-known brand names. Arafa, through its
joint ventures, exports to brands like Zara, Marks & Spencer, Macy‘s, PALZILERI, GAP, and others
-Lead time: refers to the time it takes from the shipment of the garments by the supplier to the receipt by the
customer. Al Arafa, as it is positioned in Egypt, has the upper hand in the delivery lead-time, since Egypt has
a very close proximity to the European market as mentioned previously. In fact, it takes china and other
Southeast Asian countries fifteen days or more for the garments to reach their customers in Europe, while it
takes Egypt two days and a half only. As a result, Al Arafa has a very high potential to serve the European
market which is always looking for cheaper and faster delivery time.
-Fashion: refers to the ability to know and produce the latest fashion designs. Arafa has benefited from its
joint venture, Egyptian Portuguese, to have access to the Spanish fashion and through its partially acquired
partner in Italy, Forall group to be on the top of the latest fashions and styles as those are some of the most
internationally renowned markets in fashion. (See Appendix 5, Table 10)
For Al Arafa‘s competitive positioning among the world players (See Appendix 6).
Investment Summary
Our estimated target price for Al Arafa is $0.60 which offers a 54 % upside from the current stock price. Al
Arafa is the only fully integrated apparel manufacturer and retailer in the Middle East. Al Arafa‘s main
growth driver is retail expansion in high growth markets. During Q2 2011, the companies‘ subsidiaries
achieved high growth rates despite the extraordinary events in Egypt.
In 2010, Al Arafa divested its two loss making subsidiaries MELKA & SRG (which had very high selling
and administrative expenses). This caused a recovery in the retail‘s segment EBITDA margin.
Retail segment is the main growth driver of Al-Arafa's top line, the percentage of this segment‘s sales of total
sales will increase to reach 67.5% in FY 2016 compared to 60% in the FY 2010. Investing in FORALL group
opens the luxury market to Al-Arafa, taking the company to totally new level, so higher margin are expected.
As a result of the top line growth, the OCF is expected to recover and reach $29.7m in FY 2016. Compared
to $ -13.2m in FY 2010.
We valued Al Arafa by applying two techniques, which are: Discounted Cash Flows (DCF) and Multiple
Analysis. The DCF valuation is based on the sum-of-the-parts approach for the company‘s main investments.
We believe that this approach is relevant to Al Arafa‘s reporting nature, which does not include all equity
investments as part of operations. In addition, using SoTP is justified as segments have different levels of
cash flows and margins. Therefore, valuing the parent company on a standalone basis would underestimate
its Enterprise value. In the Multiple Analysis, we used a combination of P/E and EV/EBITDA multiples.
Risk exposure can be divided into currency, country, and competitive risks. The currency risk refers to the
exchange rate fluctuations, specifically, the devaluation of the EGP, EUR, and GBP against the dollar. Even
though, the government of Egypt has managed to keep the EGP value stable through the sale of foreign
currency reserves, such an exposure to the depletion of this foreign reserve will certainly hit the company.
Although such EGP depreciation is in favor of the company, whose major costs are in EGP and whose stock
is denominated in USD, further devaluation would hurt the entire economy and, thereby the company. (See
Figure 14)
The country risks refers to the risks on the Egyptian economy‘s performance due to current political and
economic events, the risks on the EU market due to the debt crisis, and the US market being affected by that
debt crisis as US economy is closely attached to the EU, which all pose risks on the company‘s exports. The
competitive risks refer to the company‘s unsuccessful expansion into new markets mainly, luxury market,
and the quotas removal in EU with which it may face a fierce competition against cheaper, and older players
in the market.
7. CFA Institute Research Challenge 31/1/2012
7
Figure15. Al Arafa share price and news flow in the last 2years.
Valuation
We valued Al Arafa by applying two techniques, which are: Discounted Cash Flows (DCF) and Multiple
Analysis. The DCF valuation is based on the sum-of-the-parts approach for the company’s main investments.
We believe that this approach is relevant to Al Arafa’s reporting nature, which does not include all equity
investments as part of operations. In addition, using SoTP is justified as segments have different levels of
cash flows and margins. Therefore, valuing the parent company on a standalone basis would underestimate
its Enterprise value.
In the Multiple Analysis, we used a combination of P/E and EV/EBITDA multiples
The Discounted Cash Flow analysis:
Our estimated SOTP value for Al Arafa is USD 0.68 per share. We reached this value through the separate
DCF valuation of the Retail, A&T, and Textile operations, in addition to the book values of Al Arafa’s other
investments.
We based our top line forecasts on the following forecasted competitive scenario:
Al Arafa will experience top line and margin improvements driven by Retail expansion in general and
focusing on the luxury segment in particular. Growth will also be driven from entering high growth markets
like the Asian market. PAL ZELERIE is another major growth driver since Al Arafa holds the right to
acquire the remaining 65% stake in Forall Group through holding exercisable call options to be expired by
2013. Such expansion in the Retail segment will drive growth in both the A&T and the Textile segments of
Al Arafa. Thus, after 2013, the company will grow at higher rates than before. This will continue until the
company matures and starts facing more competitors, mainly from Egypt and other emerging markets;
therefore, slowing down its growth rates.
The retail expansion will drive growth in the A&T segment’s top line and margins. The Textile segment
expected growth in the top line for the next five years is mainly through maintaining the needs of the A&T
segment for fine wool fabrics.
We adopted three stages DCF model. The Analytic stage covers the period of varying growth rates from 2012
to 2016. The Convergence Stage covers the period of declining growth rates from 2017 to 2021. Then, the
stable growth rate is in perpetuity.
DCF Assumptions: Figures are broken down through the three segments based on the following
assumptions:
CAPEX: is divided across segments according to the segment’s contribution to sales.
Depreciation & Amortization: Being a fixed percentage of PP&E across segments, the PP&E is divided
across segments according to the segment’s contribution to sales.
Net working capital: Having almost similar sales growth rates, the change in net working capital is divided
across segments according to the segment’s contribution to sales.
Each business segment has its more detailed assumptions which are based on the forecasted competitive
scenario described above. (Also see the Financial Analysis section for more details).
8. CFA Institute Research Challenge 31/1/2012
8
For details on WACC and terminal value assumption, (See Appendix 10).
We performed sensitivity analysis to test the validity of our key assumptions, (See Appendix 11, Table 13&
Appendix 12, and Table 14).
We performed a volatility analysis for our target price; please see the risk section for more details.
Those other equity investments are represented by the Available for sale investments Worth mentioning is
that it includes the company’s investment in Forall Group (35% Stake), its 50% Stake in Querini-Italy, and
its 48.5% Stake in Middle East Tailoring Co. (METCO). Those Affiliates are not yet consolidated because Al
Arafa has no control over their financial and operating policies.
Multiple Analyses:
In this section, we estimate a target price of $ 0.56 for Al Arafa based on a combination of both PER and
EV/EBITDA analysis. The analysis depends on comparison with companies in the same sector, then
performing sector regression to correct for differences in fundamentals, mainly growth rates, and risk.
Initially, before regression, Al Arafa’s target price based on PER and EV/EBITDA was $0.85 and $0.67,
respectively. However, after the regression and correcting for the fundamental differences in growth and
risks, the company’s target price estimate is $0.62, and $0.51, respectively, to arrive to an average of $0.56.
(See Appendix 9)
PER: We apply an 11.8x multiple, 30% premium above Al Arafa’s 2012e PER of 9.07x, to our 2012 EPS
estimate of $0.053 to reach a $0.62 target price. We arrived to the 11.8x multiple after sector regression for
the EPS growth rates and Cost of Equity (representing risk) across peer companies. Thus, we believe that the
difference between the adjusted 11.8x PER and the company’s PER is corrected for fundamentals and we can
argue that its multiple is undervalued. (See Appendix 7, Table 11)
Before adjustment for fundamentals, the median PER for peer companies was 13.8x, 53% premium over Al
Arafa’s 2012e PER. However, we excluded the 23% that is explained by differences in growth and risk
across companies before our judgment that Al Arafa is undervalued.
EV/EBITDA: We apply a 6.83x multiple, 5% premium over Al Arafa’s 2012e EV/EBITDA of 6.49x, to our
2012e EBITDA of $30.5m to reach a $0.51 target price, after adjusting for $61m in cash, $42m in available
for sale investments, and $261 in debt. We arrived to the 6.83x multiple after sector regression for the growth
rates in operating income, and WACC (measure of risk) across peers. Similarly, the difference between the
adjusted 6.83x EV/EBITDA and the company’s EV/EBITDA is corrected for fundamentals’ differences and
we can argue its multiple is undervalued. (See Appendix 8, Table 12).
Before adjustment for fundamentals, the median EV/EBITDA for peer companies was 7.6x, 17% premium
over Al Arafa’s 2012e EV/EBITDA. However, we excluded the 12% that can be explained by differences in
growth and risk across companies before our judgment that Al Arafa is undervalued.
Choosing the multiples: We used both PER and EV/EBITDA multiples in valuation as each has its own
advantages which are not captured by the other. The first advantage of EV/EBITDA is that it is not affected
by the capital structure of the company. EV/EBITDA also strips out the effect of depreciation and
amortization. However, EV/EBITDA is harder to calculate than PE. It does not take into account the cost of
assets or the effects of tax. As it is used to look at the value of the business in EV terms it does not break this
value down into the value of the debt and the value of the equity. Therefore, we computed Al Arafa’s stock
price as the average of the prices resulting from both multiples’ analysis.
Conclusion: We estimate a target price of $0.60 that has been obtained from a weighted average of the prices
resulting from our DCF and our Multiple Analysis. Weights are 30% and 70% respectively. We assign a
lower weight to the DCF analysis because of its nature which involves massive assumptions bias; and even
slight changes in the underlying assumptions of the analysis can drastically alter the valuation results (see
sensitivity analysis, appendix 11).
Financial Analysis
This section presents the analysis of forecasted financial data. The analysis period is from JAN, 2011 to JAN,
2017. Analyzing each segment separately will provide a more comprehensive understanding of the data
analyzed.
Sales growth is driven by the retail expansion in luxury and casual wear markets. Management believes that
the top line will experience an increase of 2% & 5% for the next two years respectively, then, a constant
9. CFA Institute Research Challenge 31/1/2012
9
growth rate of 7% going forward. However, as the company matures and faces more competition, this rate
would gradually decline. The company‘s top line is broken down into 87% exports and 13% local sales. UK
constitutes 75% of exports, and then comes US with 16% and after that Germany, Italy, and Ireland with 6%,
2%, and 1%, respectively.
Retail segment: Declined Revenues & Recovered EBITDA.
The selling of UK based SRG& and Swedish based MELKA had a negative impact on this segment‘s top
line, as it declined from $252 M in 2009 to $195.5 M in 2010 (22.4%). But it caused the EBITDA margin to
recover from -2.58% in FY 2009 to be 2.20% in 2010.
Retail segment is the main growth driver of Al Arafa's top line, the percentage of this segment sales of total
sales will increase to reach 67.5% in FY 2016 compared to 60% in the FY 2010.The CAGR of this segment‘s
top line in the analysis period is 5.64%. Despite being the major growth driver of the top line (60% of the
consolidated revenues), the retail segment amounts by only 8% of the consolidated EBITDA in the FY 2010.
This segment EBITDA margin is expected to reach 7.73% in FY 2016 compared to 2.20% in FY 2010 with a
CAGR of 23.3%.
International retail operations: Nearly 78% of Al Arafa‘s products are exported to countries that were
unaffected by current developments in Egypt. Baird Group witnessed a double digit growth in revenues in Q2
as compared to Q1 2011. Moreover, Egyptian Portuguese Company, added to the retail segment top line
growth as its contributed revenues of USD10.4 million in H1 2011, which is more than 2.5x revenues of H1
2010.
Apparel Segment:
This segment has a large percentage of the consolidated sales as it amounts to 35% in FY 2010. This
percentage is expected to decline in the next 5 years despite the significant increase in the segment top line
which is expected to be $174 M in FY 2016. This decline is due to the expansion in the retail segment which
will drive the retail contribution to total revenues higher.
Apparel segment contributed by 80% to the consolidated EBITDA in the FY 2010. This segment EBITDA
margin is expected to achieve 16.08% in 2016 compared to 8.26% in FY 2011. Covering the period from
31/1/2012 to 31/1/2017, the CAGR of this segment‘s top line will be 14.25%. This growth is driven by the
retail expansion and the new joint ventures that will produce casual wear.
Textile segment:
In the fiscal year ending JAN, 2011, this segment contributed to the total sales by 5% and by 12% to the
consolidated EBITDA. This segment will maintain the contribution percentage in the top line which is 5%,
this means a flat growth scenario is expected for this segment in the next five years. The CAGR for 2012-
2017 period will be 3.25% for the segment‘s top line and 4.20% for the segment‘s EBITDA.
Operating Cash Flows: Back to the recovery track.
Driven by the growth in the company‘s top line and the divesture of loss making subsidiaries
(SRG&MELKA), OCF is expected to grow significantly in the next 5 years ($29.7 M in FY 2016 compared
to $ -13.2 M in FY 2010). When it comes to calculating the CAGR, we will not use the OCF of FY 2010 as it
is negative; instead, we use the OCF of the FY 2008 as it has the first positive value of OCF. On that basis,
the CAGR is 26.26% in the period from 2008 to 2016. Also, an increase is expected in the OCF/ Sales ratio
(from 1.18% in FY 2008 to 8.23% in FY 2016).
Higher Margins are expected: Al-Arafa is recently targeting the luxury wear market which enjoys high
margins.
For the analyzed Financial Statements and Key Financial Ratios (See Appendices from 12 to 22)
Corporate and Employee Responsibility
Corporate Social Responsibility: Al Arafa has a very high profile when it comes to its corporate social
responsibility through receiving internal audit reports from the Compliance and Health & Safety departments
and external reports from clients' compliance auditors. The company has already out performed its local
environmental laws, as it strives to comply with the international standards set forth by its clients. One of the
corporates aims to preserve energy through switching off its power during rest hours and after work hours. In
addition, for the sake of preserving water consumption, it set up a department to manage waste and to
improve recycling.
Employees’ Responsibility: When it comes to its employees, Al Arafa has a major impact on its
community through its medical contribution to help the poor children, raising its employees‘ standards of
living, provision and employment, and training and housing for its employees. Recently the company has
10. CFA Institute Research Challenge 31/1/2012
10
purchased 150 Acers within close proximity to its factories for housing its labor. (For the labor policy at the
company, see Appendix 29)
Investment Risk
Exchange rate risk:
Al Arafa is subject to exchange rate risk as 74% of its revenues are in the form of foreign currencies (15%
EGY, 15% EUR, and 44% GBP). The GBP is relatively stable over 2011 despite the Euro zone debt crisis.
So far this year, Euro has depreciated against US dollars by nearly 15% after the Euro zone debt crisis.
Similar and even tougher downward pressures on the EGP against the USD are occurring as a result of the
current economic and political distress in Egypt. Despite the ongoing intervention of the Central Bank of
Egypt in the foreign exchange market to limit the depreciation, through the sale of dollar reserves, a rapid
depletion of such reserves to nearly $ 18 billion (from $ 36 billion) poses a serious threat to the pound and
increases the likelihood of currency devaluation. Currency devaluation would benefit the company since most
of the manufacturing costs are denominated in EGP and only 15% of the top line is in EGP. However, further
devaluation would hurt Al Arafa by negatively affecting the whole Egyptian exports, as other countries
would impose some trade restrictions against the Egypt.
Such high foreign currency exposure would affect the company’s margins and the purchasing power of its
long term cash flows. Al Arafa hedges such risks using the forward exchange contracts.
Based on five years of average monthly data, we estimate a coefficient of variation of 6.02% for the
EUR/USD, of 3.21% for the EGP/USD, and of 11.94% for the GBP/USD. Over the last year, the coefficient
of variation of the EUR/USD was 3.72%, of the GBP/USD was 2.05%, and of the EGP/USD was 0.89%.
(See Appendices 23, 24 & 25)
Country Risk: Egypt: Since the Egyptian revolution broke out in 2011, the economy has been under great
pressure. Due to uncertainty about the future, it is very unclear whether the government will continue its
economic policies such as export subsidies and trade agreements with the US and other countries or not (For
more details about the uncertainty of the regulatory and investment environment in Egypt, See Appendix 27)
Europe: In 2011 most of the European countries such as Italy, Spain, France, and Portugal faced a huge debt
crisis (Figure 18). This crisis will lead to a tight credit policy by the banks in those countries and, in turn, job
losses and pay freezes. As a result of that and besides the psychological effects that will change the
customers’ behavior, Al Arafa’s business specially the luxury wear market will be negatively affected.
US: USA economy is expected to be affected negatively by the Euro Zone crisis. If the Greek contagion
reaches countries like Spain and Italy, it would hit the economies of the European core France and Germany,
who have Greek exposure of about $138 billion, where the US banks would be extremely subject to
exposure. The major US banks have exposure to the government debt, banks, and other facilities within those
two countries by about 61%.All these may lead to a recession in the US which will have direct effects on Al
Arafa’s exports to US, its second biggest market. Also the depreciation of the Euro against the US dollar
(already depreciated 15%) will have a negative impact on the US exports to the EU, the biggest trading
partner of the US. (See Appendix 28)
Stronger competition from emerging markets
Al Arafa is now facing fierce competition from its Asian peers since the multi-fiber agreement, which applied
the quota restrictions on the US and European markets, has been cancelled in 2005. This cancellation caused
the textile and garments exports of countries such as Bangladesh, Vietnam and China to increase in value by
about $ 500 million in 2006. China’s textiles exports increased by 100% in 2006 and as a result US and
Europe imposed restrictions on Chinese textiles in 2007. (See figure 4 &5, page 3)
Penetrating new markets
Al Arafa recently targets new markets (luxury wear market and casual wear market). Expansion in the luxury
wear market may pose risks on Al Arafa such as gaining a reasonable market share in the middle of the giants
who already possess and control the market, like Massimo Dutti, Ferragamo and LVMH, seems to be very
challenging. For the casual wear market, the competition is very tough with the world casual-wear leading
producers such as Canali, Gucci and D&G. Al Arafa will benefit from the JV with the leading shirt maker
(Ermenegildo Zegna),this JV (Camegit) will allow Al Arafa to make a successful penetration to the casual
wear market.
Volatility Analysis
We performed historical volatility analysis for the daily stock returns of Al Arafa over the past five years and
the result was an average 50-days volatility of 38.2% (See appendix 26, Figure 20, Table 29). We used the
historical stock prices to estimate the volatility of our $ 0.60 price estimate, and the outcome was a skewed-
platykurtotic probability distribution (Skewness of 0.85 and kurtosis of -0.82) with a standard deviation of $
0.28 around the $ 0.67 price. We estimate that Al Arafa’s stock price would fluctuate in the range of $0.32 to
$0.88 with a probability of 80%. (See Figure 19). (See Table 8 for detailed outcomes of the volatility analysis
for our target price).
11. CFA Institute Research Challenge 31/1/2012
11
Appendix 1.Company Structure-Source: Company Data.
Appendix 2.Fully Vertically Integrated Company-Source: Company Data.
13. CFA Institute Research Challenge 31/1/2012
13
Appendix 5.Table 10/ Leading Fashion Countries.
Appendix 6.Competitive Positioning
The figure shows how Al Arafa compares
against Italian brands, Emerging market
players, and other global brands in terms of
Quality, Price, brand, lead time, and fashion
across the casual, formal and luxury wear
segments.
0%
Casual 100%
Formal 100%
Luxury 100%
14. CFA Institute Research Challenge 31/1/2012
14
Appendix 7.Table 11/ PER Analysis-Source: ASU estimates.
PER Sector regression
Regression
Equation
Adjusted
PER
EPS
growth
rate
Cost of
equity constant
1.482 .688 2.554
t-statistic .488 1.157 .318
R^2 15.30%
The R^2 indicates the percentage of the difference in the PER that can be explained by the independent variables (EPS growth rate and
Cost of Equity).
15. CFA Institute Research Challenge 31/1/2012
15
Appendix 8.Table 12/ EV-EBITDA Analysis-Source: ASU estimates.
EV/EBITDA Sector regression
Regression
Equation
Adjusted
EV/EBITDA
Growth rate in
operating
income
Cost of
Capital constant
.018 .528 1.499
t-statistic .935 2.299 .669
R^2 43.50%
Note: EBITDA is excluded from the regression as values are not widely dispersed across peer companies.
The R^2 indicates the percentage of the difference in the EV/EBITDA that can be explained by the independent variables (Operating
income growth rate and Cost of Capital).
16. CFA Institute Research Challenge 31/1/2012
16
Appendix 9.Overview of Comparable companies-Source: companies’ data
FountainSet
(Holdings) Limited
one of the world‘s largest circular knitted fabric manufacturers and has long been a driving force in the
global market through its vertically integrated operations in spinning, knitting, dyeing, printing and
finishing. The Group‘s product range also includes dyed yarns, sewing threads and garments. The
company is a major fabric supplier to garment manufacturers in over 40 countries that supply to
internationally renowned retail brands. The Group‘s worldwide sales reached HK$7.6 billion (US$975
million) in the financial year 2011. Headquartered in Hong Kong. Have production facilities in the PRC
(china), Sri Lanka and Indonesia, with marketing and representative offices in 5 countries and a global
staff force of approximately 14,200. Established in 1981.Fountain Set Limited‘s clients including
garment manufacturers, the products range from underwear, T-shirts, jacket, sleeps wear, sportswear,
casual wear to formal wear for children and adults.
PERRY ELLIS
INTERNATIONAL
A leading designer, distributor and licensor of apparel and accessories for men and women. The
company, through its wholly owned subsidiaries, owns or licenses a portfolio of brands that includes 29
of the leading names in fashion such as (Perry Ellis®, Savane®, Jantzen)
its products are related to men‘s wear ,, produces blazers and vests only in the suits department and
bikini for women‘s wear.
Mainly working in USA and Canada and Mexico. In 2005 acquired South Pacific Apparel Pty Ltd (a
manufacturer and distributor for garments in Australia and newzeland and south pacific islands), which
produces men‘s and boy‘s dress and casual trousers and shorts.
ALOK
INDUSTRIES LTD
Indian company which is a diversified manufacturer of world-class home textiles, garments, apparel
fabrics and polyester yarns, selling directly to manufacturers, exporters, importers, retailers and to some
of the world‘s top brands, expanded into weaving, knitting, processing, home textiles and garments.
Integrated backward into cotton spinning and manufacturing partially oriented yarn through the
continuous polymerization route. Provide embroidered products through GrabalAlokImpex Ltd.,
associate company. Has a strong presence in the domestic retail segment through a wholly owned
subsidiary, Alok H&A Limited thatoffers garments and home textiles at attractive price points.
An international presence in the retail segment through its associate concern, GrabalAlok (UK) Limited.
This entity owns more than 200 outlets across England, Scotland and Whales vending value for money
ranges for menswear, women swear, children wear, footwear, homeward and accessories. Owns
overseas marketing offices in Sri Lanka, New York, Bangladesh, Dallas, and USA.
NINGBO
SHANSHAN CO
LTD-A
Engages in the manufacture and sale of garments. The company‘s garments include suits, leisurewear,
and shirts. The company was founded in 1992 and is based in Ningbo, China. Owns 20 brands in
different styles and at different market segments: 2 core brands - Shanshan (both Men‘s and Lady‘s) and
Shanshan Sports; 10 original brands - such as FIRS, MGB, Firs & Design, Elteno, LA Fancy, LeTuTu,
Rosew, Bellson, etc.; and 9 licensed or distributed brands - Marco Azzali, Renoma Paris, Lubiam 1911,
Le Coq Sportive, Callaway Golf Apparel, Pinky & Dianne, Munsingwear, Dunhill Sports, Smalto, Le
Coq Sportive Golf Collection, QUA, etc. In total the Group comprises of 2 listed companies, 24
factories, 19 fashion apparel companies and nearly 3000 franchising shops at home and abroad.
TEXWINCA
HOLDINGS LTD
An investment holding company, engages in the production, dyeing, and sale of knitted fabrics and
yarns. It offers finished knitted fabric products in single knit, double knit, velour and polar fleece,
jacquard, spandex, stripe, and flat knit. The company also offers dyed yarn products, such as ramie,
rayon, acrylic, and polyester/cotton blend yarn dyed products, as well as cotton yarn dyed products. In
addition, it retails and distributes casual apparel and accessories; provides franchise services; and offers
repair and maintenance services for motor vehicles. the company engages in the property holding
business; and provision of management services and sub-licensing of trademarks. Sells its products
primarily in the United States, China, Japan, and Hong Kong. The company was founded in 1975 and is
headquartered in Kwai Chung, Hong Kong.
PVH CORP
PVH Corp. designs and markets branded dress shirts, neckwear, sportswear, footwear, and other related
products worldwide. Owns Calvin Kline. Its Wholesale Dress Furnishings segment markets dress shirts
and neckwear principally under the ARROW, Calvin Klein, IZOD, Eagle, Sean John, and Donald J. Has
sportswear wholesalers such as Timberland, and Calvin Klein brands; and also women‘s sportswear. It‘s
Retail Apparel and Related Products segment provides men‘s t-shirts & women‘s suits & footwear. The
company was formerly known as Phillips-Van Heusen Corporation and changed its name to PVH Corp.
in June, 2011. The company was founded in 1881 and is headquartered in New York, New York.
CASUAL MALE
RETAIL GROUP
INC
A special retailer of men‘s apparel in the United States, Canada, and Europe.The company‘s retail stores
offer a range of basic sportswear, casual apparel, and dress wear and accessories, as well as a line of its
private label collections, such as Harbor Bay, 626 Blue-Vintage Surplus, Synergy, Oak Hill, and True
Nation; casual clothing for the big and tall customers; loungewear, dress shirts, suits, and jeans wear;
and luxury-oriented menswear. The company was formerly known as Designs, Inc. and changed its
name to Casual Male Retail Group, Inc. in August 2002 as a result of the acquisition of Casual Male
business from Casual Male Corp. Casual Male Retail Group was founded in 1976 and is headquartered
in Canton, Massachusetts.
17. CFA Institute Research Challenge 31/1/2012
17
J.C. PENNEY CO
INC
Operates through a network of department stores in the United States and Puerto Rico. The company
sells merchandise and services to consumers through its department stores and through the Internet
Website at jcp.com. As of January 29, 2011, the company operated 1,106 department stores. The
company sells family apparel and footwear, accessories, fine and fashion jewelry, beauty products
through Sephora inside jcpenney, and home furnishings. It was founded in 1902. In December 2011, J.
C. Penney Company, Inc. and Martha Stewart Living Omni media, Inc. announced that they have
entered into a strategic alliance and would join forces to create a unique and comprehensive retail
experience featuring Martha Stewart products, know-how and advice. History J.C. Penney Company.
ASHLEY (LAURA)
HOLDINGS PLC
Its core business is the design, manufacture, sourcing, distribution, sale, and licensing of clothing,
accessories, and home furnishings in the United Kingdom and internationally. Clothing includes
dresses, knitwear, tops, blouses, skirts, trousers, leggings, coats, jackets, swimwear, and shoes, as well
as accessories. The company sells its products through retail stores, online, and mail order. As of
January 29, 2011, it operated 217 stores, including 138 mixed product stores, 55 home stores, 22 home
concession stores, 1 gifts and accessories store, and 1 clearance outlet in the United Kingdom; and 240
franchised stores in 29 countries. The company is based in London, the United Kingdom.
ARVIND LTD
Manufactures and sells textiles and garments in India and internationally. The company offers yarns,
fabrics, and branded garments. Sells its products under its own brands, such as Excalibur Gant, Flying
Machine, Mainstream, and Ruff& Tuff. Was founded in 1931 and is based in Ahmadabad, India.
RAYMOND LTD
Manufactures and sells worsted fabric products in India. The company operates in three divisions:
Textiles, Engineering, and Aviation. The Textiles division produces pure-wool, wool-blended, and
premium polyester viscose worsted suiting, as well as blankets and shawls, finest suiting using wool,
polyester, and other specialty fibers, such as cashmere, angora, alpaca, pure silk, and linen. In addition,
this division produces and markets plush-velvet furnishing fabrics. The company also offers denim
fabric and cotton yarn products, readymade garments, and designer wear products. Raymond Limited
also exports its products. The company was founded in 1925 and is headquartered in Mumbai, India
VICTORY CITY
INTL HLDGS LTD
An investment holding company, engages in the production and sale of knitted fabric and dyed yarn,
and the provision of related subcontracting services. Provides fabric knitting, bleaching, dyeing, and
finishing services. The company is also involved in the production and sale of garment products. It
engages in the trade of knitted fabric, dyed yarn, and garment products; chemical mixing activities; and
property holding operations. Operations primarily in Hong Kong, the PRC, the United States, and
Canada. Was founded in 1983 and is headquartered in TuenMun, Hong Kong.
TED BAKER PLC
Engages in the design, wholesale, retail, and licensing of men‘s wear, women‘s wear, and related
accessories. It offers a range of collections, including formal, endurance, born, accessories. Distributes
products through its own and licensed retail outlets. As of 29 January 2011, it operated 33 stores, 165
concessions, and 10 outlet stores in the United Kingdom and rest of Europe; 13 stores and 2 outlets in
the United States; 23 stores in the Middle East, rest of Asia, and Australasia. Ted Baker PLC was
founded in 1987 and is headquartered in London, the United Kingdom.
LPP SA
Engages in the design, distribution, wholesale, and retail of clothes for women, men, and children. It
offers a range of clothing, including jackets, overcoats, jumpers, sweatshirts, trousers, dresses, blouses,
and shirts,as well as underwear and other accessories. Retailer brands such as Reserved, Cropp, House,
and Mohito. Operates in Poland, Estonia, the Czech Republic, Lithuania, Latvia, Hungary, Russia,
Ukraine, Romania, Bulgaria, and Slovakia. LPP S.A. has a chain of 921 stores. The company is
headquartered in Gdańsk, Poland.
BOMBAY RAYON
FASHIONS LTD
Engages in the manufacture, export, and retail of fabrics and apparel. It offers a range of fabrics, and
casual and formal wear apparel, as well as various accessories. Retails readymade garments and other
accessories in Europe and India through its GURU brand stores. The company sells its products in India,
the Middle East, Europe, the United States, and Japan. Bombay Rayon Fashions Limited was founded in
1986 and is based in Mumbai, India.
18. CFA Institute Research Challenge 31/1/2012
18
Appendix 11.Table 13/Sensitivity Analysis-Source: ASU estimates.
Appendix 10.DCF Assumptions
We used the 2.64 % risk free rate, which is the yield on the US 10-year treasury bonds.
For the Market risk premium, we used 4.31 % representing the mature market risk premium, which is the historical risk
premium for the United States (Estimated by Damodaran * as the geometric average premium for stocks over the treasury
bonds from 1928 to 2010). We added 3.58 % as a country risk premium*(assumed to be un-diversifiable), which is the
Credit Default SWAP spread for Egypt in February 2011 (Source: Bloomberg). This would give us a market risk premium
of 7.89%. The Beta used for Al Arafa’s stock is 0.843 in the Hermes Index (Source: Bloomberg).
For the Cost of Debt, we used the average historical effective interest rate on the company’s debt, which is 4.68%.
The target debt-to-equity ratio stated by Al Arafa and consistent with our DCF valuation is 1.1
The WACC applied for the first two stages is calculated at 6.29%.
Terminal value assumptions: For the terminal value, we assume a 2.92% perpetual growth rate, which is the average world GDP
growth rate for the eight years period from 2009 to 2016 (Source: IMF, WEO, September 2011). The period represents the average
economic cycle as stated by the US National Bureau of economic research. We used this rate because we expect that, in perpetuity,
Al Arafa will be exposed to the entire world’s Apparel Retail market, not just UK, Europe, US, and Egypt.
*Aswath Damodaran: Stern School of Business NYU.
19. CFA Institute Research Challenge 31/1/2012
19
Appendix 12.Table 14/ Balance Sheet-Consolidated.
Source: Company Financial data, ASU estimates.
Source: Company Financial data, ASU estimates.
Appendix 13.Table 15/ Income Statement-Consolidated.
Source: Company Financial data, ASU estimates.
Source: Company Financial data, ASU estimates.
20. CFA Institute Research Challenge 31/1/2012
20
Appendix 14.Table 16/ Cash Flow Statement-Consolidated.
Source: Company Financial data, ASU estimates.
Appendix 15.Table 17/ Income Statement-Textile Segment.
Source: Company Financial data, ASU estimates.
Appendix 16.Table 18/ FCFF-Textile Segment.
Source: Company Financial data, ASU estimates.
21. CFA Institute Research Challenge 31/1/2012
21
Appendix 17.Table 19/ Income Statement-Retail Segment.
Source: Company Financial data, ASU estimates.
Appendix 18.Table 20/ FCFF-Retail Segment.
Source: Company Financial data, ASU estimates.
22. CFA Institute Research Challenge 31/1/2012
22
Appendix 19.Table 21/ Income Statement-Garment Segment.
Source: Company Financial data, ASU estimates.
Appendix 20.Table 22/ FCFF-Garment Segment.
Source: Company Financial data, ASU estimates.
23. CFA Institute Research Challenge 31/1/2012
23
Appendix 21.Table 23/ Per Share Ratio.
Source: Company Financial data, ASU estimates.
Appendix 22.Table 24/ Fact Sheet.
Source: Company Financial data, ASU estimates.
24. CFA Institute Research Challenge 31/1/2012
24
Appendix 23.Table 25/ Exchange Rate EGP/USD-Source: ASU estimates.
Appendix 24.Table 26/ Exchange Rate GBP/USD-Source: ASU estimates.
25. CFA Institute Research Challenge 31/1/2012
25
Appendix 25.Table 27/ Exchange Rate EUR/USD- Source: ASU estimates.
Appendix 26. Figure 20/ Volatility Analysis-Source: Bloomberg, ASU estimates.
Table28.
26. CFA Institute Research Challenge 31/1/2012
26
Appendix 27. Uncertainty about the regulatory and investment environment in Egypt.
Egypt has experienced a high rate of growth in its foreign direct investment that reached from 2.1 million
dollars to 6.8 million dollars since its economic reform in 2002 to 2010.however ever since the outbreak of
the revolution on the 25th of January, its value of foreign direct investment took a sharp drop from 6.8
billion to 1.6 billion dollars in the first quarter alone of the year 2011. The number of the newly established
companies in the financial year 2009-2010 recorded 7269 companies; however from 2010 till mid 2011 it
also dropped to 3245 companies only. Total investments in Egypt dropped from 25 billion EGP in 2010 to
8.8 billion. All these reflect uncertainty about Egypt‘s economic performance, and so Al Arafa‘s economic
performance in the upcoming years.
Al Arafa is an export-oriented business with 78% of its garment manufacturing is exported, thus the
greatest part of Al Arafa‘s operations is dependent on Egypt‘s foreign trade policies and agreements.
Currently, Al Arafa is taking advantage of 4%-7% of export subsidies, depending on the degree of local
inputs in the exported product. AL Arafa also enjoys Egyptian textiles tariff free access to the European
Union through Egypt- EU partnership, EU-Egypt action plan, and TIFA. Adding to that, the Egyptian
exports tax free access to the US market through the QIZ agreement. However the future of such incentives
and trade agreements is unclear with the current future political ambiguity.
Appendix 28.US exposure to the Euro Zone Debt Crisis.
Appendix 29.Labor Policy at Al Arafa Holding
The company has a very strict labor policy which states the following:-
We are an equal opportunity employer and we do not discriminate in hiring, compensation, training, promotion,
termination or retirement on the grounds of religion, race, ethnic origin, disability, health, gender or marital
status.
We do not use forced or involuntary labor.
Physical abuse, threatening behavior, sexual or other harassment is totally prohibited.
Workers are not required to lodge any papers or deposits and will be given a reasonable notice period.
Our working hours and wages comply with all legislation and industry sector standards.
All blue collar workers undergo a paid training period before assuming work.
27. CFA Institute Research Challenge 31/1/2012
27
Strengths ThreatsOpportunitiesWeakness
Operating through a
strong vertically integrated
business model.
Relatively low cost
environment for being
labor intensive in apparel
and tailoring segment.
Strong brands and
production lines.
Has a unique global
footprint provides access
to a diversified customer
base
Retail market acts as
distribution channel with a
wide network spinning
from Egypt through
Europe to the US in
additional to the extensive
distribution network of
PALZILERI which present
in more than 70 countries
worldwide.
Expansion of the retail
market on regional and
international levels creates
demand for products of
both apparel & tailoring
and the textiles segments.
Acquisition of Forall
group.
Replication of the wool
and wool based success
products in cotton based
products.
Uncertainty about the
political and economic
situation in Egypt which
could result in tough
governmental laws and
regulations.
The cut of transportation
due to the political
circumstances in Egypt.
Global economic
instability.
Depreciation of the GPB,
EUR and EGP against US
dollar.
Slow down in foreign
markets.
Intense competition from
nations, known for low
cost manufacturing such as
china.
The shrank of fibers and
Australian wool market.
Uncertainty about
demand in Egypt as a
result of current political
instability.
Expansion into fast
growing market such as
China and Japan in
additional to US and UK.
The expansion of luxury
market.
The growth of textile and
apparel market worldwide.
The advantage of Egypt
geographic location that
enables Arafa having short
lead time comparing with
its competitors.
Useful trade agreement
like QIZ and EU-Egypt
and other agreements.
Dependence on the
Australian wool in the
manufacturing.
Takes a lot of time
transferring the know how
to manufacture.
Low margins of main
provider of revenues, the
retail segment, given the
nature of the retail
business as well as the
dependence on the mature
UK market for retail sales.
Appendix 30.SWOT Analysis-Source: ASU estimates.
28. CFA Institute Research Challenge 31/1/2012
28
Disclosures:
Ownership and material conflicts of interest:
The author(s), or a member of their household, of this report [holds/does not hold] a financial interest in the securities of this company.
The author(s), or a member of their household, of this report [knows/does not know] of the existence of any conflicts of interest that might bias the content
or publication of this report. [The conflict of interest is…]
Receipt of compensation:
Compensation of the author(s) of this report is not based on investment banking revenue.
Position as an officer or director:
The author(s), or a member of their household, does [not] serves as an officer, director or advisory board member of the subject company.
Market making:
The author(s) does [not] act as a market maker in the subject company‘s securities.
Disclaimer:
The information set forth herein has been obtained or derived from sources generally available to the public and believed by the author(s) to be reliable, but
the author(s) does not make any representation or warranty, express or implied, as to its accuracy or completeness. The information is not intended to be
used as the basis of any investment decisions by any person or entity. This information does not constitute investment advice, nor is it an offer or a
solicitation of an offer to buy or sell any security. This report should not be considered to be a recommendation by any individual affiliated with [Society
Name], CFA Institute or the CFA Institute Research Challenge with regard to this company‘s stock.