
Recommended
Recommended
More Related Content
What's hot
What's hot (19)
Similar to Tactical HR: Turning Employee Experience Into Financial Strategy
Similar to Tactical HR: Turning Employee Experience Into Financial Strategy (20)
More from Aggregage
More from Aggregage (20)
Recently uploaded
Recently uploaded (20)
Tactical HR: Turning Employee Experience Into Financial Strategy
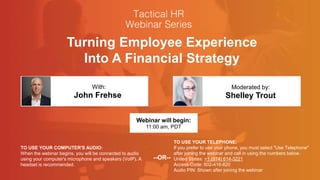
- 1. Turning Employee Experience Into A Financial Strategy John Frehse Shelley Trout With: Moderated by: TO USE YOUR COMPUTER'S AUDIO: When the webinar begins, you will be connected to audio using your computer's microphone and speakers (VoIP). A headset is recommended. Webinar will begin: 11:00 am, PDT TO USE YOUR TELEPHONE: If you prefer to use your phone, you must select "Use Telephone" after joining the webinar and call in using the numbers below. United States: +1 (914) 614-3221 Access Code: 602-416-820 Audio PIN: Shown after joining the webinar --OR--
- 2. We believe great businesses are powered by great people. Guided by decades of experience and innovation, Kronos® offers the industry’s most powerful suite of tools and services to manage and engage your entire workforce from pre-hire to retire. And because workforce needs are constantly changing, Kronos solutions are designed to evolve with you to help meet the challenges you face every day — regardless of your industry or where you do business.
- 3. About the Series 6 Education-packed sessions
- 4. 4 Click on the Questions panel to interact with the presenters www.recruitingbrief.com/webinar-series/tactical-hr www.humanresourcestoday.com/webinar-series/tactical-hr
- 5. About John Frehse John Frehse is a Senior Managing Director at Ankura, based in the New York office. He has more than 20 years of experience focused on labor and operations strategy. John has developed and implemented strategies for more than 100 companies, and he delivers to corporate leaders innovative labor solutions that incorporate solutions to employee needs. His work has spanned a wide range of industries, including food and beverage, automotive, chemical, electronics, pharmaceuticals, power, call centers, banking/insurance, distribution, telecommunications, mining, government and healthcare. John’s professional philosophy is that people are the most valuable resource of every company. His experience has proven that in order to create long-term success, a thoughtful and methodical approach to labor must be created. About Shelley Trout Shelley went to UC Berkeley and majored in Anthropology & Archaeology. After working at the Center of Digital Archaeology, she became fascinated with digital representations of personality and culture, and now leads Webinar Production at Aggregage, providing some of the most interesting thought-leaders across a wide variety of industries with a space to celebrate the diversity, depth, and experience of their professional cultures, personalities, and passions.
- 7. I Am The Smartest Pursen Hear!
- 8. (Only my mother thinks I am brilliant!!) I Am The Smartest Person Here!
- 9. “We believe employees are every organization’s most valuable resources.” REALLY?
- 10. Values ≠ Value
- 11. CHROCFO Small Fissure or Giant Chasm?? Finance Human Resources
- 12. Different Mindsets & Points-of-View CHROCFO Strategic partner to CEO Champion of employees Every employee a cost Every employee is valuable Compliance & reporting Compliance & reporting Deal maker Organization builder Financial gatekeeper Steward of culture Drive shareholder value Promote continuity & cohesion Quantitative (& qualitative) Qualitative (& quantitative)
- 13. 46% 71% 63% 0% 20% 40% 60% 80% We have implemented an enterprise-wide employee… Employee engagement metrics lack financial… Measuring employee engagement is not a priority. Organizational Performance Survey of CFOs 2016 Industry Agnostic Survey; n = 237; March 2016 Why Employee Engagement Measures May Be Necessary But Insufficient “I intuitively believe in improving employee commitment and engagement – what could be the counter-argument? But, the level of employee engagement we have here is not a business outcome our investors care about. The antecedents and consequences of employee engagement remain unclear. Third-party correlation analysis is insufficient for us. Until we can map (employee) engagement into our short- and longer-term financials, we view investments in employee engagement programs as second- or third-tier allocations.” − CFO, Public Industrial Services Company
- 14. New Times… Financial capital is abundant but carefully managed; human capital is scarce but not carefully managed. Why? In part, it’s because equity markets have historically measured and rewarded good management of financial capital. CEOs were held in high regard for their clever management and allocation of financial capital. But today’s best CEOs are equally great at managing financial, physical and talent capital. This will accelerate as the GAAP Gap continues to widen.
- 15. 13.0% 46.8% 25.2% 13.0% 2.2% 23.8% 41.3% 23.3% 9.0% 2.5% 0% 5% 10% 15% 20% 25% 30% 35% 40% 45% 50% Excellent place to work Better than most About the same Somewhat worse Worst company in the area Client Normative Database Survey Says! Compared to Other Companies…
- 17. I worked at Indeed.com full-time (Less than a year) Pros Benefits, catered lunches, nice building Cons I would have gladly traded every free lunch, every free snack, and every day of unlimited PTO for a genial, approachable team leader as opposed to the nongenial, wholly unsupportive, unapproachable, abrasive, snarky boss I had. This jerk could have written, produced, directed, and starred in Horrible Bosses 1 and 2 (and any other sequels). I understand she is no longer with the company. Good. I'm sure the office is more pleasant now. Too bad that she didn't leave before I got there.
- 18. What If You Don’t Care About Them At All?
- 19. 19 Getting there… Workforce Engagement as a Financial Strategy “Your employees come first. And if you treat your employees right, guess what? Your customers come back, and that makes your shareholders happy. Start with employees and the rest follows from that.” Herb Kelleher, Founder Southwest Airlines Purpose or Mission Customer Experience Employee Experience
- 20. World discovers a new hero
- 21. 21
- 23. Impact on the business • $25,000 to repack/fix the slide • 100 Passengers delayed • Other flights delayed • Airplane out of service while repairs took place 23 Steven was under stress • History of drug/alcohol abuse • Recently cared for his deceased father • Caring for his dying mother • Challenged by a passenger What’s the impact? Could it have been prevented?
- 24. 24
- 25. United Airlines Still Hasn’t Quite Gotten There… 25
- 26. 11 deaths, 184 injuries
- 27. Takata first said (before all the lawyers got involved) that propellant chemicals were mishandled and improperly stored during assembly, which supposedly caused the metal airbag inflators to burst open due to excessive pressure inside.
- 29. All Companies Say “Engagement Matters” Few Companies Believe This.
- 30. 30 How value is created in the contemporary economy During the past 4 decades, there has been a steady decline in market value attributable to tangible assets (on balance sheet), while there’s been a steady increase in market value attributable to intangible assets (off balance sheet). 83% 68% 32% 20% 16% 17% 32% 68% 80% 84% 0% 20% 40% 60% 80% 100% 1975 1985 1995 2005 2015 Components of S&P 500 Market Value Tangible Assets Intangible Assets TODAY *Generally Accepted Accounting Principles This we refer to as the GAAP* Gap
- 31. Because companies don’t understand how to invest in human capital, they make bad decisions and drive poor results.
- 33. In God we trust. Everyone else bring data. ~ Chief Financial Officer
- 34. HR has a seat at the table, but… …often doesn’t have enough to say.
- 35. “The head of HR at every company should be at least as important as the CFO.” − Jack Welch
- 36. Payroll Burden True Labor Cost Straight Time Overtime Double Time Health/Other 21.20% Retirement Contribution 7.36% 7.36% 7.36% Social Security 6.20% 6.20% 6.20% Unemployment 1.10% 401K 4.85% 4.85% 4.85% Life/LTD 1.59% Medicare 1.45% 1.45% 1.45% Total 43.75% 19.86% 19.86%
- 37. Payroll Ratio True Labor Cost Hours Worked Hours Paid Scheduled Hours 2,080 Hours Worked: 1,702.4 Less: Plus: Vacation 144.0 Vacation 144.0 Holiday 127.5 Holiday 127.5 Sick 44.1 Sick 44.1 FMLA 53.0 FMLA 53.0 Mat/Pat 5.1 Mat/Pat 5.1 Work Injury 2.0 Work Injury 2.0 Personal-Unpaid 1.8 Personal-Unpaid 0.0 Unexcused-Unpaid 0.1 Unexcused-Unpaid 0.0 Total Hours Worked 1,702.4 Total Hours Paid 2,078.2 2,078.2 (Total Hours Paid) / 1,702.4 (Total Hours Worked) Hours Paid to Hours Worked Ratio = 1.221
- 38. Calculation Base Wage*: Straight Time Burden: Pay Ratio: Calculations: Straight Time: True Labor Cost: = Overtime: x 1.5000 Adverse Cost of Idle Time: Adverse True Labor Cost: Adverse Cost of Overtime: Overtime Burden: Double Time Burden: Double Time: x 2.0000 Adverse Cost of Double Time: Adverse Cost of Straight Time:$0.00 $31.16 $31.16 $31.16 $31.16 43.75% x 1.4375 19.86% 19.86% x 1.1986 x 1.1986 1.22 x 1.221 $54.67 $56.01= $54.67 $54.67$56.01 $54.67$74.69 - - = $1.34 = $20.02 $74.69= Idle Time is 40.69 Times More Expensive Than Overtime True Labor Cost
- 39. The Tale of Two Companies…. Company A Company B Fully Loaded Cost of Straight Time: $54.67 $17.22 Compared to other Companies Pay/Benefits Are Good: 96.0% 77.8% Management Really Cares About Employees: 15.9% 98.5% I Feel Like I Am Part of the Company: 53.2% 90.8% The Management Team Focuses More On Office Workers: 78.2% 21.2% The Management Team Communicates Will With the Employees: 35.6% 69.2%
- 40. Did You Know There Is More Than One Currency? 1. Cash 2. Fringe Benefits 3. Time Off 4. The chance to make a positive impact 5. Investments in training 6. Visibility 7. Structured mentoring 8. Flexibility 9. Public recognition for performance 10.Leadership enabled success 11.Merit based promotions 12.Etc…………….
- 41. Time Off FMLA/Sick – 7% of Employees Responsible for 60% of FMLA/Sick
- 42. Let’s Look at the True Cost of Absenteeism: OT Fill-In: 400 ee * 3% unplanned absence * $1.34 * 2080 hours/year = $33,446 Person Absent: 400 ee * 3% unplanned absence * $18.00 in benefits * 2080 hours/year = $449,280 Total Cost: $482,726
- 43. Work Days 260 Days Off 104 Weekends Off (Full) 52 Longest Break 2 days (52x) Max. Number of Shifts in a Row 5 120-40, Balanced, 1 X 3 Crew, 8-Hour, Fixed, Fixed, Every Weekend Off Crew/ Week Mon Tue Wed Thu Fri Sat Sun Totals 1 8 8 8 8 8 - - 40 Avg. 40 8-Hour Shifts - 5 Day Coverage
- 44. Work Days 173 Days Off 191 Weekends Off (Full) 52 Longest Break 6 days (17x) Max. Number of Shifts in a Row 3 120-40, Balanced, 3 X 2-Crew, 12-Hour, Fixed, Rotating, Long Weekend Crew/ Week Mon Tue Wed Thu Fri Sat Sun Totals 1 12 12 12 - - - - 36 2 - - 12 12 12 - - 36 3 12 12 - 12 12 - - 48 Avg. 40 12-Hour Shifts - 5 Day Coverage
- 45. 168-42, Balanced, 4 X 3-Crew, 8-Hour, Fixed, Rotating Model Work Days 273 Days Off 91 Weekends Off (Full) 13 Longest Break 3 days (13x) Max. Number of Shifts in a Row 7 Crew/ Week Mon Tue Wed Thu Fri Sat Sun Totals 1 - 8 8 8 8 8 8 48 2 8 - - 8 8 8 8 40 3 8 8 8 - - 8 8 40 4 8 8 8 8 8 - - 40 Avg. 42 8-Hour Shifts - 7 Day Coverage
- 46. 168-42, Balanced, 2 X 2-Crew, 12-Hour, Fixed, Rotating EOWO Work Days 182 Days Off 182 Weekends Off (Full) 26 Longest Break 3 days (26x) Max. Number of Shifts in a Row 3 Crew/ Week Mon Tue Wed Thu Fri Sat Sun Totals 1 - 12 12 - - 12 12 48 2 12 - - 12 12 - - 36 Avg. 42 12-Hour Shifts - 7 Day Coverage
- 47. Human Equity Valuation™ & Reporting is Inevitable
- 48. But If You Do Want To Change….. Homework: (for which I have no authority to assign!) 1. Take Inventory of Leveraged Currencies 2. Do True Labor Cost Calculation 3. Start With Simple: Cost Out Absenteeism
- 49. 49 Q&A Shelley Trout With: Moderated by: Senior Managing Director, Ankura Linkedin page: linkedin.com/in/johnfrehse/ Twitter ID: @ScheduleDoctor Website: www.ankura.com/ Webinar Production, Aggregage Linkedin page: /in/shelleytrout/ Twitter ID: @hrposts / @recruitingbrief Website: www.aggregage.com www.recruitingbrief.com/webinar-series/tactical-hr www.humanresourcestoday.com/webinar-series/tactical-hr John Frehse