
Recommended
More Related Content
What's hot
What's hot (20)
Viewers also liked
Viewers also liked (20)
Similar to Historian presentation – simpsonville ky
Similar to Historian presentation – simpsonville ky (20)
Recently uploaded
Recently uploaded (20)
Historian presentation – simpsonville ky
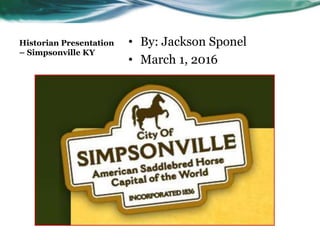
- 1. Historian Presentation – Simpsonville KY • By: Jackson Sponel • March 1, 2016
- 2. Presentation Overview • Wolf Adventure: Council Fire Belt Loop # 3A • Learn about the changes in your community (history), and create a project to show your den how the community has changed
- 3. Population in Decades 0 250 500 750 1000 1250 1500 1750 2000 2250 2500 2750 3000 Year 1830 1850 1860 1870 1880 1890 1900 1910 1920 1930 1940 1950 1960 1970 1980 1990 2000 2010 Simpsonville Population Population Simpsonville is a city
- 4. Population in Decades 0 250 500 750 1000 1250 1500 1750 2000 2250 2500 2750 3000 Year 1830 1850 1860 1870 1880 1890 1900 1910 1920 1930 1940 1950 1960 1970 1980 1990 2000 2010 Simpsonville Population Population • In 1833 – There were about 77 people in Simpsonville • From 1850 until 1950 population stayed the same • Starting in 1960, the population started to grow Simpsonville is a city
- 5. Simpsonville KY ~ Civil War Facts:
- 6. Simpsonville KY ~ Civil War Facts: West of Simpsonville on US 60 are white headstones next to the road, this sign tell us about them.
- 7. Simpsonville KY ~ Civil War Facts: January 25, 1865 ~ Company E in the 5Th Colored Calvary were on their way to Louisville with 900 cattle, when they were ambushed by Confederate Soldiers. 22 Colored Soldiers were killed. Most of the colored soldiers were slaves. The dead men were buried in a big grave. Most of the soldiers are still listed as MIA (Missing In Action) The headstones to the left were placed to remind us of these soldiers.
- 8. Old Stone Inn – Simpsonville KY Was built in 1800’s (1817 was finished) It has been a carriage stop It was a home It was an Inn (hotel) It is now a restaurant
- 9. NEW Additions – Simpsonville KY New sidewalks Downtown Stop Light at Todd’s Point Rd. The Outlet Mall – The Outlet Shoppes of the Bluegrass
- 10. QUESTIONS ????
Editor's Notes
- This template can be used as a starter file to give updates for project milestones. Sections Right-click on a slide to add sections. Sections can help to organize your slides or facilitate collaboration between multiple authors. Notes Use the Notes section for delivery notes or to provide additional details for the audience. View these notes in Presentation View during your presentation. Keep in mind the font size (important for accessibility, visibility, videotaping, and online production) Coordinated colors Pay particular attention to the graphs, charts, and text boxes. Consider that attendees will print in black and white or grayscale. Run a test print to make sure your colors work when printed in pure black and white and grayscale. Graphics, tables, and graphs Keep it simple: If possible, use consistent, non-distracting styles and colors. Label all graphs and tables.
- What is the project about? Define the goal of this project Is it similar to projects in the past or is it a new effort? Define the scope of this project Is it an independent project or is it related to other projects? * Note that this slide is not necessary for weekly status meetings
- Year /Population 183077 1850 225 1860 169 1870 239 1880 253 1890 290 1900 203 1910 185 1920 189 1930 181 1940 220 1950 247 1960 220 1970 628 1980 642 1990 907 2000 1,281 2 010 2,484 2014 2,655
- Year /Population 183077 1850 225 1860 169 1870 239 1880 253 1890 290 1900 203 1910 185 1920 189 1930 181 1940 220 1950 247 1960 220 1970 628 1980 642 1990 907 2000 1,281 2 010 2,484 2014 2,655
- Duplicate this slide as necessary if there is more than one issue. This and related slides can be moved to the appendix or hidden if necessary.
- Duplicate this slide as necessary if there is more than one issue. This and related slides can be moved to the appendix or hidden if necessary.
- Duplicate this slide as necessary if there is more than one issue. This and related slides can be moved to the appendix or hidden if necessary.
- The following slides show several examples of timelines using SmartArt graphics. Include a timeline for the project, clearly marking milestones, important dates, and highlight where the project is now.
- The following slides show several examples of timelines using SmartArt graphics. Include a timeline for the project, clearly marking milestones, important dates, and highlight where the project is now.
- The following slides show several examples of timelines using SmartArt graphics. Include a timeline for the project, clearly marking milestones, important dates, and highlight where the project is now.
- The following slides show several examples of timelines using SmartArt graphics. Include a timeline for the project, clearly marking milestones, important dates, and highlight where the project is now.