SlideShare a Scribd company logo
1 of 48
HKS727
Case Number 1973.0
This case was written by Albert L Nichols, Adjunct Lecturer in
Public Policy, and Anjani Datla, Case Writer, at the John F.
Kenne-
dy School of Government, Harvard University. HKS cases are
developed solely as the basis for class discussion. Cases are not
intended to serve as endorsements, sources of primary data, or
illustrations of effective or ineffective management. (January
2012)
Funding for this case was provided by the Joseph B. Tompkins,
Jr. Fund for Case Study and Research.
Copyright © 2012 President and Fellows of Harvard College.
No part of this publication may be reproduced, revised,
translated,
stored in a retrieval system, used in a spreadsheet, or
transmitted in any form or by any means without the express
written
consent of the Case Program. For orders and copyright
permission information, please visit our website at
http://www.ksgcase.harvard.edu/ or send a written request to
Case Program, John F. Kennedy School of Government, Harvard
University, 79 John F. Kennedy Street, Cambridge, MA 02138.
Corporate Average Fuel Economy Standards 2017-2025
Introduction
In December 2011, the United States National Highway Traffic
Safety Administration (NHTSA) and the En-
vironmental Protection Agency (EPA) issued a joint proposal to
dramatically increase fuel economy and reduce
greenhouse gas emissions of passenger cars and light trucks
sold between Model Years (MY) 2017 and 2025. 1 The
joint proposal was an important step in implementing President
Obama’s 2010 memorandum calling for both
agencies to build on a national program that would “produce a
new generation of clean vehicles.” 2 The national
program, created in 2009, relied on both the Corporate Average
Fuel Economy (CAFE) rules administered by the
NHTSA and EPA’s authority to regulate carbon dioxide
emissions from vehicles and other sources.
The heightened activity on fuel economy standards reflected
national concerns about dependence on im-
ported oil as well as global climate change. By 2010, Congress
had rejected the creation of a cap-and-trade system
to reduce carbon dioxide emissions. But many observers saw
increasing energy efficiency as a win-win alternative
that more than paid for itself in fuel savings. A New York
Times article described hearings on the proposed MY
2017-2025 fuel economy standards held in Detroit in early 2012
as “more than 90 people who spoke… asserted
that the stricter fuel economy requirements would create jobs,
reduce oil consumption, create cleaner air and save
drivers money, all while helping automakers increase their
profits.” 3
As part of the national program, the NHTSA and EPA had
promulgated new CAFE standards in 2010 and
2011 to substantially raise the combined average fuel economy
of new cars and light trucks to 34 miles per gallon
1
74859 Federal Register / Vol. 76, No. 231/ Thursday,
December 1, 2011.
2 “Presidential Memorandum Regarding Fuel Efficiency
Standards,” May 21, 2010, http://www.whitehouse.gov/the-
press-
office/presidential-memorandum-regarding-fuel-efficiency-
standards, (accessed August 14, 2012). Found under
Whitehouse.gov, the Press Office.
3 Bunkley, N, “New Gas Economy Rules Generate Wide
Support,” New York Times, January 17, 2012.
This document is authorized for use only by Hameeda Lamb in
Business & Economic Policy Graduate Online Fall 2018-2019 at
Northwood University, 2018.
http://www.whitehouse.gov/the-press-office/presidential-
memorandum-regarding-fuel-efficiency-standards
http://www.whitehouse.gov/the-press-office/presidential-
memorandum-regarding-fuel-efficiency-standards
HKS Case Program 2 of 16 Case Number 1973.0
(mpg) by MY 2016, and had, for the first time, imposed
standards on heavy duty trucks. 4 Under the new joint pro-
posal, the NHTSA estimated that by MY 2025, new cars and
light trucks would achieve even greater average fuel
economy of nearly 50 mpg. The NHTSA and EPA predicted that
the improvement in fuel economy would reduce
national fuel consumption by 4 billion barrels of oil and cut
greenhouse gas emissions by 2 billion metric tons of
carbon dioxide over the lifetimes of the new vehicles. 5 Overall,
the NHTSA concluded that the national program
would generate substantial benefits—primarily in the form of
savings in fuel costs for vehicle owners—amounting
to four times the cost. The present value of the estimated net
benefits of the program was about $323 billion at a
discount rate of 3 percent, as shown in Table 1. 6
Environmental groups had long called for higher fuel economy
standards and welcomed the government’s
proposed tightening of the standards. The Environment Defense
Fund strongly endorsed the regulation and said it
would "help provide energy security, economic security and
climate security.” 7 The Union of Concerned Scientists
believed the standards would “help spur investments in new
automotive technology, which will create jobs and
sustain the recovery of the American auto industry.”8 Several
consumer groups also hailed the proposal, with the
4 25324 Federal Register / Vol. 75, No. 88 / Friday, May 7,
2010; and 57106 Federal Register / Vol. 76, No. 179 / Thursday,
Sep-
tember 15, 2011.
5
“NHTSA and EPA Propose to Extend the National Program to
Improve Fuel Economy and Greenhouse Gases for Passenger
Cars
and Light Trucks,” NHTSA CAFE 2017-2025 Notice of
Proposed Rulemaking Factsheet, http://www.nhtsa.gov/fuel-
economy,(accessed July 2, 2011). Found under NHTSA.gov,
CAFE-Fuel Economy.
6
The NHTSA estimated all costs and benefits in constant 2009
dollars. Based on Office of Management and Budget guidelines,
the NHTSA calculated present values of all costs and benefits at
both 3 and 7 percent discount rates. This case reports figures
based on a 3 percent discount rate, which the NHTSA appears to
have favored. The NHTSA’s results with a discount rate of 7
percent were very similar in relative terms; e.g., at both
discount rates, the ratio of benefits to costs was 4.0. See
Appendix 1 for
a brief introduction to discounting.
7
“Environmental Defense Fund Statement on U.S.
Environmental Protection Agency and National Highway
Transportation Safe-
ty Administration ‘Proposed Rule 2017- and Later Model Years
Light Duty Vehicle Greenhouse Gas Emissions and Corporate
Average Fuel Economy Standards’,” Mark MacLeod, Public
Hearing, Philadelphia, Pennsylvania, January 19, 2012.
8
“Important Step Towards Cleaner More Fuel Efficient Cars and
Trucks,” Union of Concerned Scientists, 2011,
http://www.ucsusa.org, (accessed August 13, 2012).
Table 1. Estimated Benefits and Costs of Proposed CAFE
Standards for Model Years (MY) 2017-2025
Notes: Entries are in billions of 2009 dollars.
Entries are sums over lifetimes of vehicles sold during model
years 2017-2025, discounted to the start of MY 2017
at 3 percent real discount rate.
Source: Preliminary Regulatory Impact Analysis: Corporate
Average Fuel Economy for MY 2017-2025 Passenger Cars and
Light Trucks, Department of Transportation, National Highway
Traffic Safety Administration, Table 13,
http://www.nhtsa.gov/fuel-economy, (accessed May 1, 2012).
Item Present Value ($billions)
Technology costs $109
Total benefits $432
Net benefits $323
This document is authorized for use only by Hameeda Lamb in
Business & Economic Policy Graduate Online Fall 2018-2019 at
Northwood University, 2018.
http://www.nhtsa.gov/fuel-economy
http://www.ucsusa.org/
http://www.nhtsa.gov/fuel-economy
HKS Case Program 3 of 16 Case Number 1973.0
Consumer Federation of America calling the stringent targets
“one of the most important consumer protection
measures to be adopted on the federal level in decades.” 9
A few skeptics, however, believed the proposed rule was
fundamentally misguided. Although the majority
of auto manufacturers agreed to meet the higher fuel economy
targets, the National Association of Auto Dealers
voiced opposition. The association stated that vehicle prices
would go up more than $3,000 on average (signifi-
cantly more than NHTSA’s estimates) to achieve the higher
CAFE standards and that "seven million licensed drivers
would be priced out of the new-car market.” It added that “real
life fuel economy improvements cannot be
achieved, and related policy benefits cannot be realized, unless
and until consumers actually buy and use those
new vehicles.” 10
History of the Corporate Average Fuel Economy Program
In 1973, the Arab oil embargo plunged the United States into a
large-scale energy crisis. For almost six
months, between October 1973 and March 1974, the Arab
members of the Organization of Petroleum Exporting
Countries (OPEC) shut down oil supply to the U.S. in
retaliation for its military support to Israel during the Arab-
Israeli war. The embargo led to an unparalleled fuel shortage in
the country, marked by sky-rocketing fuel prices
and long lines of cars waiting at gas stations. In the aftermath,
oil shortages became a rallying cry for energy inde-
pendence.
Acting on the belief that improving the fuel economy of cars
would go a long way toward lowering petro-
leum imports, Congress passed the Energy Policy and
Conservation Act of 1975, which gave birth to the Corporate
Average Fuel Economy program—the country’s first ever fuel
economy regulation for cars and trucks. The NHTSA,
under the Department of Transportation, was assigned
responsibility for administering the CAFE program and im-
plementing annual vehicle fuel economy standards starting with
MY 1978. In 1979, the NHTSA also began setting
CAFE standards for light trucks, separate from passenger cars.
11
The CAFE legislation specified fuel efficiency minimum
standards for passenger cars that started at 18
mpg in MY 1978 and rose up to 27.5 mpg by MY 1985. With no
further increases, fuel economy for passenger cars
and light trucks hovered at 27.5 mpg and 20 mpg respectively,
for more than twenty years. 12 Although the stand-
ards remained constant, the overall average fuel efficiency of
new vehicles declined as minivans, pickup trucks,
and Sport Utility Vehicles (SUVs)—most of which were
classified as light trucks and thus subject to less stringent
CAFE limits—became increasingly popular.
9 “A Key Step to Ending America’s Oil Addiction: Policy
Makers, Consumers and Automakers are Shifting New Vehicles
to Higher
Fuel Economy,” Mark Cooper, Jack Gillis, Consumer Federation
of America, July 2012.
10 National Association of Auto Dealers comments letter,
February 13, 2012, Re: 2017 and Later Model Year Light-Duty
Vehicle
Greenhouse Gas (GHG) Emissions and Corporate Average Fuel
Economy (CAFE); 49 CFR Parts 523, 531, 533, 536, and 537
and
40 CFR Parts 85, 86 and 600; Doc. Nos. NHTSA–2010–0131
and EPA–HQ–OAR–2010–0799.
11 “History of Fuel Economy: One Decade of Innovation, Two
Decades of Inaction,” The Pew Environment Group, April 2011.
12 Ibid.
This document is authorized for use only by Hameeda Lamb in
Business & Economic Policy Graduate Online Fall 2018-2019 at
Northwood University, 2018.
HKS Case Program 4 of 16 Case Number 1973.0
Under the CAFE program, auto manufacturers did not have to
meet the minimum required fuel efficiency
target for each vehicle they sold, but could average across
vehicles in a particular class. 13 Manufacturers also were
awarded credits if they over complied with the standard in a
given year, which they could transfer or carry forward
or backward, with limited flexibility. Automakers could pay a
penalty rather than meet the standard, but only a few
relatively small makers of imported luxury cars (such as Jaguar,
Mercedes and Porsche) chose to pay the fines in-
stead of complying with fuel economy targets. 14
In 2007, Congress passed the Energy Independence and Security
Act (EISA), which had numerous provi-
sions related to energy efficiency, including new CAFE targets
for motor vehicles. EISA required that the NHTSA
increase the average fuel economy of cars and light trucks to 35
mpg by 2020. 15 In 2008, the NHTSA proposed
standards for cars and light trucks manufactured during MY
2011-2015. In 2004, California had legislated even
tighter fuel economy standards, in the form of limits on carbon
dioxide emissions. 16 The EPA rejected California’s
request for a waiver to impose emissions rules in 2007, citing
federal stipulations under the CAFE and EISA legisla-
tions, which precluded independent action by states. 17 But
within days of assuming office in 2009, President Barack
Obama urged the EPA to reconsider California’s waiver request.
In March 2009, the NHTSA promulgated the final rule for MY
2011 and announced that it would propose
revised fuel efficiency standards for 2012-2016. 18 In May of
the same year, President Obama directed the EPA and
NHTSA to work together to establish coordinated national fuel
efficiency and carbon emissions standards, and to
move up fuel efficiency targets set in EISA from 2020 to 2016
(which would also be consistent with California’s
proposed carbon emissions standards). As part of the
negotiations leading up to the directive, California agreed to
follow the federal standards for 2012-2016 and auto
manufacturers agreed not to pursue further legal efforts to
block California from setting its own emissions standards for
later years. The EPA issued California’s waiver in June
13
The average mpg for a group of vehicles is computed using a
harmonic mean rather than a regular arithmetic mean. See Ap-
pendix 2 for a discussion of the differences between the two
types of means.
14 The level of the fine has varied over time and currently
adjusts with inflation. At the time of the proposal, the rate was
$5.50/0.1 mpg per vehicle (74900 Federal Register/ Vol. 76, No.
231/ Thursday, December 1, 2011). Thus, for example, if a
manufacturer’s fleet averaged 5 mpg more than allowed, it
would pay 5 x 10 x $5.50 = $275/vehicle. The EPA, however,
had
authority to charge dramatically higher penalties under the
Clean Air Act (74902 Federal Register/ Vol. 76, No. 231/
Thursday,
December 1, 2011).
15 “History of Fuel Economy: One Decade of Innovation, Two
Decades of Inaction,” The Pew Environment Group, April 2011.
16 Under the Clean Air Act California was allowed to set its
own tighter emission standards for vehicles in recognition of the
fact
that it had started setting standards long before the Act’s
passage in 1970. The CAFE legislation, however, explicitly
ruled out
state standards. Standards for carbon dioxide emissions were
nominally like standards for other pollutants, such as hydrocar-
bons, stated in emissions per mile, but were effectively
equivalent to fuel economy standards because the only practical
way to
reduce carbon dioxide emissions per mile meant reducing fuel
consumption per mile.
17 See full timeline of California Greenhouse Gas Waiver
Request at http://www.epa.gov/otaq/climate/ca-waiver.htm, (ac-
cessed October 12, 2012). Found under EPA.gov,
Transportation and Air Quality, Transportation and Climate,
Regulations and
Standards.
18 “DOT Posts New Fuel Economy Standards for Model Year
2011 Cars and Lights Trucks,” NHTSA Press Release, March
27, 2009,
http://www.nhtsa.gov/About+NHTSA/Press+Releases/2009/DO
T+Posts+New+Fuel+Economy+Standards+for+Model+Year+201
1+Cars+and+Light+Trucks, (accessed October 11, 2012). Found
Under NHTSA.gov, About NHTSA, Press Releases.
This document is authorized for use only by Hameeda Lamb in
Business & Economic Policy Graduate Online Fall 2018-2019 at
Northwood University, 2018.
http://www.nhtsa.gov/About+NHTSA/Press+Releases/2009/DO
T+Posts+New+Fuel+Economy+Standards+for+Model+Year+201
1+Cars+and+Light+Trucks
http://www.nhtsa.gov/About+NHTSA/Press+Releases/2009/DO
T+Posts+New+Fuel+Economy+Standards+for+Model+Year+201
1+Cars+and+Light+Trucks
http://www.epa.gov/otaq/climate/ca-waiver.htm
HKS Case Program 5 of 16 Case Number 1973.0
2009. In September 2009, the NHTSA and EPA formally
proposed new rules to implement the negotiated targets,
which were made final in 2010. 19
In January 2011, the NHTSA, EPA, and the State of California
announced their intent to develop coordi-
nated rules for MY 2017-2025. Negotiations among the two
federal agencies, the State of California, automobile
manufacturers, auto industry unions, and environmental groups
proceeded.
In the CAFE rulemakings of 2008 and earlier years, auto
manufacturers had vociferously opposed tighter
limits and had submitted detailed technical and economic
critiques against higher fuel economy standards. Having
lost their effort to block action by the State of California,
however, auto manufacturers were deeply concerned
that without a national agreement that satisfied California, the
state would set tighter standards, requiring the
production of different vehicle versions for different parts of
the country. The potential challenges of complying
with heterogeneous emissions standards were compounded by
the fact that several other states typically adopted
California’s requirements. In addition, two of the “big three”
manufacturers (General Motors and Chrysler) were
under pressure to cooperate during negotiations because they
had received “bailouts” from the federal govern-
ment. Under these circumstances and in light of widespread
support for energy efficiency regulations in general,
and CAFE in particular, most automakers felt it necessary to
agree to the more stringent fuel economy standards.
On July 29, 2011, President Barack Obama, accompanied by the
heads of 13 major automobile manufac-
turers that accounted for 90 percent of all vehicles sold in the
U.S., announced an “historic agreement” to increase
the average fuel efficiency standard of cars to 54.5 mpg by the
year 2025. 20 To implement the agreement and in
keeping with federal rulemaking guidelines, the NHTSA and
EPA published a “Notice of Proposed Rulemaking”
(NPRM) in the Federal Register and opened it up for public
comments in December 2011. Following standard prac-
tice, the agencies would promulgate the final rule (possibly
modified from the proposal) or withdraw the proposal
after analyzing public comments and possibly conducting
additional analysis. Ultimately, in August 2012, the pro-
posed CAFE standards for MY 2017-2025 were adopted as the
final rule. 21
Estimated Costs and Benefits of Proposed Standards for MY
2017-2025
As required by presidential orders dating back to the late 1970s,
the NHTSA and EPA each issued a Regula-
tory Impact Analysis (RIA) to accompany the NPRM. 22 The
NHTSA’s RIA, more than 800 pages long, provided an
19 25323-25728/ Federal Register / Vol. 75, No. 88 / Friday,
May 7, 2010.
20
“President Obama Announces Historic 54.5 mpg Fuel
Efficiency Standard,” White House Press Release, July 29,
2011,
http://www.whitehouse.gov/the-press-
office/2011/07/29/president-obama-announces-historic-545-
mpg-fuel-efficiency-
standard, (accessed July 2, 2012), found under Whitehouse.gov,
the Press Office. Note that mpg figures are calculated under
different sets of assumptions depending on the purpose (e.g., to
measure compliance under the CAFE legislation as opposed to
predicting actual performance). As a result, apparent differences
in mpg figures may not reflect real differences.
21 “Obama Administration Finalizes Historic 54.5 mpg Fuel
Efficiency Standards,” NHTSA Press Release, August 28, 2012,
http://www.nhtsa.gov/About+NHTSA/Press+Releases/2012/Oba
ma+Administration+Finalizes+Historic+54.5+mpg+Fuel+Efficie
n
cy+Standards, (accessed October 12, 2012). Found Under
NHTSA.gov, About NHTSA, Press Releases.
22
The estimates in the NPRM and the RIA were often slightly
different because of differences in assumptions (and in some
cas-
es inadvertent errors). This case relies primarily on the RIA
because NHTSA officials have informed the authors that its
esti-
This document is authorized for use only by Hameeda Lamb in
Business & Economic Policy Graduate Online Fall 2018-2019 at
Northwood University, 2018.
http://www.nhtsa.gov/About+NHTSA/Press+Releases/2012/Oba
ma+Administration+Finalizes+Historic+54.5+mpg+Fuel+Efficie
ncy+Standards
http://www.nhtsa.gov/About+NHTSA/Press+Releases/2012/Oba
ma+Administration+Finalizes+Historic+54.5+mpg+Fuel+Efficie
ncy+Standards
http://www.whitehouse.gov/the-press-
office/2011/07/29/president-obama-announces-historic-545-
mpg-fuel-efficiency-standard
http://www.whitehouse.gov/the-press-
office/2011/07/29/president-obama-announces-historic-545-
mpg-fuel-efficiency-standard
HKS Case Program 6 of 16 Case Number 1973.0
elaborate benefit-cost analysis of the proposed rule. The agency
reported estimates of costs and benefits for nine
alternative sets of CAFE standards including options both less
and more stringent than the proposed rule. This case
reports results for the “preferred alternative” (the proposed
standard).
Vehicle Footprints and Fuel Economy Standards
The Energy Independence and Security Act of 2007 stipulated
that the NHTSA would determine fuel
economy targets for new cars and trucks based on a
mathematical function of vehicle “attributes”. After consider-
ing various alternatives, the NHTSA decided to use a vehicle’s
“footprint” (length of the vehicle multiplied by its
width) as the sole attribute. The fuel economy target for a
vehicle was calculated as a linear function of the foot-
print, with both lower and upper cutoffs. The functions differed
for cars and light trucks and rose progressively
higher with each model year, thereby increasing fuel efficiency.
Based on forecasts of sales of cars and light trucks
by footprint, the NHTSA estimated the average fuel efficiency
that would be achieved by manufacturers’ fleets
each model year, as shown in Figure 1. Less stringent functions
were specified for light trucks than for cars. The
NHTSA predicted that the proposed rule would raise average
fuel economy of passenger cars from 37.5 MPG in MY
2016 to 52.7 mpg in MY 2025 and save 4 billion barrels of oil
over the lifetimes of the cars and light trucks sold dur-
ing the CAFE program. 23 The average mpg ultimately realized
for new vehicles, however, would depend on the mix
of vehicles actually sold.
Cost Estimates: Technology Costs
The largest cost of the CAFE program was for new technologies
that would increase fuel efficiency in vehi-
cles manufactured between MY 2017 and MY 2025. To
calculate these costs, the NHTSA identified the types of
mates are intended to represent “real-world” expectations,
whereas the NPRM applies some assumptions about compliance
specified in the legislation that are unlikely to occur.
23
These figures are for tested mpg and do not account for the 20-
25 percent lower mpg achieved on-road.
Figure 1. Estimated Fuel Efficiency Achieved by LDVs under
NHTSA's Proposal for MY 2017-2025
Note: Values are estimated mpg achieved by cars and light
trucks combined based on the proposed functions and pro-
jected vehicle sales.
Value for 2016 reflects existing CAFE rules while those for
other years reflect proposed limits.
Source: 74888 Federal Register/ Vol. 76, No. 231/ Thursday,
December 1, 2011.
0
10
20
30
40
50
60
A
ve
ra
ge
m
pg
Passenger Cars
Light trucks
Combined
This document is authorized for use only by Hameeda Lamb in
Business & Economic Policy Graduate Online Fall 2018-2019 at
Northwood University, 2018.
HKS Case Program 7 of 16 Case Number 1973.0
technologies manufacturers would likely use to improve the fuel
economy of vehicles and how much they would
cost. The agency assumed that manufacturers would choose the
least expensive combinations of technologies
needed to achieve the higher standards. The NHTSA’s cost
estimates also assumed that manufacturers would not
reduce safety, comfort or performance in meeting the CAFE
standards. In addition to direct costs, the NHTSA also
included associated indirect costs (such as research and
development, corporate operations, and sales). 24 The
agency’s total predicted technology costs ranged from $1.7
billion for MY 2017 to $29.9 billion for MY 2025, when
the proposed standards would be most stringent. When the costs
for all model years were discounted at 3 percent
back to the start of MY 2017, they totaled $109 billion, as
shown in the top row of Table 2. 25
Benefit Estimates
Before estimating the overall benefits of the national program,
the NHTSA had to account for the fact that
increasing fuel efficiency reduced the cost per mile of driving,
which provided incentives for vehicle owners to
drive more. Econometric studies indicated that this increase in
driving—known as the “rebound” effect—was sig-
24 The indirect cost multipliers applied to direct costs varied
from 1.2 to 1.7 depending on the “complexity” of the
technology
and whether the analysis was for the short or long-term.
25 Table 2 numbers are based on discount rate of 3 percent. The
NHTSA also provided calculations based on a discount rate of 7
percent.
Table 2. Estimated Present Values of Benefits and Costs of
Proposed CAFE Standards for MY 2017-2025 Based on
Discount Rate of 3 Percent
Notes: Entries are in billions of 2009 dollars.
Entries for individual model year are discounted (at 3 percent)
to the beginning of the model year.
The “Total” column is the sum of the values for individual
model years discounted (at 3 percent) back to the start of
MY 2017. Parentheses indicate negative benefits (costs rather
than benefits from rule).
“Lifetime fuel expenditures (pretax)” do not include a reduction
in the present value total tax payments of about
$39.2 billion.
Source: Adapted from Preliminary Regulatory Impact Analysis:
Corporate Average Fuel Economy for MY 2017-2025 Passen-
ger Cars and Light Trucks, Department of Transportation,
National Highway Traffic Safety Administration, Table 13,
http://www.nhtsa.gov/fuel-economy, (accessed May 1, 2012).
Component 2017 … 2025 Total
Technology costs $1.7 $29.9 $108.9
Benefits (other costs)
Li feti me fuel expendi tures (pretax) $7.1 $86.5 $345.3
Cons umer s urpl us from addi ti onal dri vi ng $0.1 $2.6 $7.4
Refuel i ng ti me val ue $0.4 $2.6 $12.8
Petrol eum market external i ti es $0.4 $4.4 $17.9
CO2 reducti ons $0.7 $9.7 $37.8
Reducti ons i n "conventi onal " pol l utants $0.3 $2.5 $11.1
Increas ed conges ti on, acci dents and noi s e ($0.8) ($9.2)
($37.2)
Subtotal $8.1 $99.0 $395.0
Net total benefits $6.3 $69.1 $286.0
Present Values ($billions)
This document is authorized for use only by Hameeda Lamb in
Business & Economic Policy Graduate Online Fall 2018-2019 at
Northwood University, 2018.
http://www.nhtsa.gov/fuel-economy
HKS Case Program 8 of 16 Case Number 1973.0
nificant, though its magnitude was uncertain. 26 The NHTSA,
based on research presented in these studies, assumed
that the elasticity of miles driven with respect to the cost of fuel
per mile was -0.1; for example, if fuel economy
doubled, thus reducing fuel cost per mile by 50 percent,
vehicles would be driven 5 percent more miles per year.
Savings in Fuel Expenditures
The single biggest estimated benefit of the national program
was reduction in fuel costs. The NHTSA’s cal-
culations of fuel savings reflected both the rebound effect and
the fact that real-world fuel economy was approxi-
mately 20 percent less than the official stated mpg. The agency
used estimates of miles traveled and survival rates
by vehicles of different ages to determine fuel savings over the
lifetimes of vehicles sold in each model year. 27 Us-
ing projected fuel prices from the Department of Energy, the
NHTSA valued the reductions in fuel use and dis-
counted the savings back to the time of original sale. 28As
shown in Table 2, the NHTSA estimated that vehicle own-
ers would save nearly $345 billion in the present value of fuel
expenditures over the lifetime of vehicles purchased
between 2017 and 2025—more than three times the estimated
technology costs. Moreover, the reduction in fuel
costs shown did not include savings of approximately $39.2
billion in fuel taxes because that additional benefit to
vehicle owners would be offset by equal losses in tax revenues
to federal, state, and local governments.
Other Benefits for Vehicle Owners
The NHTSA used the concept of consumer surplus to gauge how
much value drivers would gain from the
extra miles driven as a result of the rebound effect. The
personal benefit of additional driving was estimated at
$7.5 billion. In addition, with higher fuel economy, vehicles
would be able to travel further on the same fuel-tank
capacity. The agency predicted that fewer refuels would save
drivers time and the cost of driving off course to find
a fuel station. The cumulative savings for consumers both while
searching for fuel stations and at the pump would
amount to $13 billion.
Petroleum Market Impacts
The CAFE program was expected to have wider social
consequences than those experienced by vehicle
owners and manufacturers. The NHTSA believed that higher
fuel efficiency would lower consumption of oil and
decrease U.S. petroleum imports. Given that the U.S. imported
nearly half of the petroleum it consumed in 2010,
the proposed CAFE standard could help make the country more
resilient to unexpected price hikes in international
petroleum markets, which disrupted the macroeconomy. 29
Based on an updated analysis by a team of researchers
at Oak Ridge National Laboratory, the NHTSA used a benefit of
approximately $13 per barrel reduction in imported
26 “Preliminary Regulatory Impact Analysis: Corporate
Average Fuel Economy for MY 2017-2025 Passenger Cars and
Light
Trucks,” Department of Transportation, National Highway
Traffic Safety Administration, pp. 613-620.
27 As vehicles age, they are driven fewer miles and more and
more of them are junked or destroyed in accidents, resulting in
declining survival rates.
28 For passenger cars, the NHTSA assumed a maximum lifetime
of 26 years so that the fuel savings for cars manufactured in MY
2025 included savings till 2051. Because light trucks typically
lasted longer, the NHTSA conducted the analysis for a lifetime
of
42 years, or to 2077 for trucks cars manufactured in MY 2025
29 “Draft Joint Technical Support Document,” Proposed
Rulemaking for 2017-2025 Light Duty Vehicle Greenhouse Gas
Emission
Standards and Corporate Average Fuel Economy Standards,
EPA and NHTSA, pp. 4-29.
This document is authorized for use only by Hameeda Lamb in
Business & Economic Policy Graduate Online Fall 2018-2019 at
Northwood University, 2018.
HKS Case Program 9 of 16 Case Number 1973.0
oil.30 The total petroleum market external benefits for the
duration of the program were estimated at approxi-
mately $18 billion.
Environmental Benefits
Lower fuel consumption also reduced environmental pollution,
which in turn would yield health and eco-
logical benefits. The NHTSA estimated reductions in damages
from two types of pollutants, carbon dioxide and
“criteria” pollutants. For carbon dioxide, the agency used
findings from an interagency working group that had
been explicitly created to develop estimates of the value of
reductions in carbon dioxide emissions for use by fed-
eral regulatory agencies. 31 The working group’s estimates
varied depending on certain assumptions but had a “cen-
tral value” of $22 per metric ton in 2009 dollars. This value
used a 3 percent discount rate and included damages
worldwide. 32 The program’s estimated benefit in reduced
carbon pollution was nearly $38 billion.
The proposed rule was also expected to reduce emissions of
“criteria” pollutants associated with ozone,
fine particles and other ambient pollutants regulated by air-
quality standards under the Clean Air Act. Higher fuel
economy would reduce demand for fuel, which would in turn
reduce emissions associated with fuel production
and distribution (for example, combustion of oil to generate
heat used in refining processes). The fuel economy
standard would not affect tailpipe emissions of criteria
pollutants from vehicles directly because vehicle emission
standards were stated per mile, not per gallon of fuel. The
rebound effect, however, would increase miles driven
and thereby increase tailpipe emissions, eating into the net
reductions in criteria pollutants. The NHTSA valued the
net reductions using the same estimates of damages per ton
adopted by the EPA in rulemakings concerning these
criteria pollutants. Virtually all of the monetized benefits were
for reduced fatalities associated with fine particles. 33
30 "Preliminary Regulatory Impact Analysis: Corporate Average
Fuel Economy for MY 2017-2025 Passenger Cars and Light
Trucks,” Department of Transportation, National Highway
Traffic Safety Administration, p. 647. The NHTSA did not
include two
other types of potential benefits associated with reduced oil
imports. The first of these was based on the notion that reduced
oil imports would reduce military expenditures. However, the
NHTSA, like other agencies, judged the evidence to support
such
an effect to be inadequate. The second type of benefit the
NHTSA rejected was the “monopsony” effect. Based on the
notion
that if the United States, a large enough consumer, reduced its
demand, the world price of oil would be driven down. This ef-
fect had been included in some other federal analyses. Gains to
net importers (such as the United States), however, would be
offset by losses to net exporters. In its analysis of damages from
carbon dioxide emissions, the NHTSA had adopted a global
perspective that weighted damages the same regardless of where
they occurred. It would have been inconsistent to count mo-
nopsony benefits in the United States but not offsetting losses
elsewhere in the world.
31 “Technical Support Document: Social Cost of Carbon for
Regulatory Impact Analysis – Under Executive Order 12866,”
Inter-
agency Working Group on Social Cost of Carbon, United States
Government, February 2010,
http://www.epa.gov/oms/climate/regulations/scc-tsd.pdf,
(accessed May 22, 2012).
32 If the value were limited to effects in the United States,
which is common practice in benefit-cost analyses of proposed
feder-
al regulations, it would be only 7 to 23 percent as large,
depending on the method used to scale down the global damages
to
U.S.-only values. Ibid., p. 11.
33 Fine particles are emitted directly and are formed in the
atmosphere from reactions involving other pollutants (such as
sulfur
and nitrogen oxides).
This document is authorized for use only by Hameeda Lamb in
Business & Economic Policy Graduate Online Fall 2018-2019 at
Northwood University, 2018.
http://www.epa.gov/oms/climate/regulations/scc-tsd.pdf
HKS Case Program 10 of 16 Case Number 1973.0
The EPA valued changes in direct emissions of fine particles at
$300,000 per ton. 34 The estimated total benefit from
lowered emissions of criteria pollutants was $11 billion.
Costs of Increased Accidents, Congestion and Noise due to
Rebound Effect
Finally, the NHTSA also recognized that the increased driving
associated with the rebound effect would
have negative impacts such as damages associated with greater
accidents, congestion, and noise, all of which were
functions of miles driven rather than fuel consumption. 35 The
costs of increased accidents, congestion, and noise
were valued at $37 billion.
Summary of Social Costs and Benefits
The NHTSA’s detailed benefit-cost analysis indicated that
between 2017 and 2025, the $432 billion in
benefits accrued from the new fuel economy standard would
dwarf the $109 billion in technology costs by more
than $323 billion (as shown in Table 2). The estimated net
benefits were dominated by savings in fuel costs. For
the consumer, these savings would vastly outweigh the
anticipated costs in higher vehicle prices.
Why Does the Market Fail to Provide More Fuel Efficient Cars?
Following common practice in benefit-cost analyses, the
NHTSA’s primary analysis did not consider the
distribution of costs and benefits among different parties. In a
relatively short section toward the end of the RIA,
however, the NHTSA reported on an analysis of costs and
benefits from the perspective of vehicle owners. Table 3
summarizes that analysis. Under the program, vehicle owners
would receive savings in fuel expenditures (including
lower payments of fuel taxes, which were not included in the
social benefit-cost analysis), savings in refueling time,
and the consumer surplus from additional driving. Vehicle
owners would also bear the technology costs. The
NHTSA estimated that those costs were only slightly more than
one-quarter of the private benefits, leaving large
net benefits from the perspective of individual vehicle owners.
NHTSA analysts recognized that these findings presented an
apparent paradox that merited
some discussion. If there were large net gains for vehicle
owners (and for manufacturers who better met
buyers’ preferences) from vehicles with higher mpg, why was
the market not generating more fuel-
efficient vehicles on its own? The NHTSA asked the following
questions in the regulatory impact analysis:
Assuming these comparisons [of private costs and benefits] are
accurate, they raise the
question of why current vehicle purchasing patterns do not
result in average fuel econ-
omy levels approaching those that this rule would require, and
why stricter CAFE stand-
ards should be necessary to increase the fuel economy of new
cars and light trucks.…
More specifically, why would potential buyers of new vehicles
hesitate to make invest-
34 “Preliminary Regulatory Impact Analysis: Corporate
Average Fuel Economy for MY 2017-2025 Passenger Cars and
Light
Trucks,” Department of Transportation, National Highway
Traffic Safety Administration, Table VIII-16.
35 The NHTSA’s estimates for accidents were limited to
damages and injuries suffered by the occupants of other
vehicles or
pedestrians under the assumption that driving decisions by
individual owners already reflect the costs borne by the
vehicle’s
own occupants.
This document is authorized for use only by Hameeda Lamb in
Business & Economic Policy Graduate Online Fall 2018-2019 at
Northwood University, 2018.
HKS Case Program 11 of 16 Case Number 1973.0
ments in vehicles with higher fuel economy that would produce
the substantial econom-
ic returns? And why would manufacturers voluntarily forego
opportunities to increase
the attractiveness, value, and competitive positioning of their
car and light truck models
by improving their fuel economy?
36
The NHTSA proceeded to offer several potential reasons for
this paradox, including what it called “stand-
ard market failures” and inconsistencies in consumer behavior
patterns that could be explained by behavioral eco-
nomics. 37
1. The agency acknowledged that the underlying assumptions it
used to estimate the economic impacts of
the program might not be in line with consumers’ evaluations of
the costs and benefits of higher mpg. For
instance, vehicle buyers might discount future fuel savings at a
greater rate than used by the agency. In its
explanation, the NHTSA noted that, “combinations of a shorter
time horizon or higher discount rate could
reduce or even eliminate the difference between the value of
fuel savings and the agency’s estimates of
increase in vehicle prices.”
2. The NHTSA recognized the possibility that its estimates of
the costs of incorporating fuel efficient tech-
nologies were too low, and did not adequately reflect the full
costs of preserving other vehicle features
(such as safety or performance) while improving fuel efficiency.
36 “Preliminary Regulatory Impact Analysis: Corporate
Average Fuel Economy for MY 2017-2025 Passenger Cars and
Light
Trucks,” Department of Transportation, National Highway
Traffic Safety Administration, p. 699.
37 The summaries below are derived from discussion in ibid.,
pp. 699-723.
Table 3. Benefits and Costs from the Perspective of Vehicle
Owners
Notes: Entries are in billions of 2009 dollars.
Entries for individual model year are discounted sum (at 3
percent) over lifetimes of vehicles sold in that model
year.
Entries for “Total” are further discounted to MY 2017 and
summed across model years.
Parentheses indicate negative values (costs rather than benefits
from rule).
Source: Values for individual components from Table 2.
Classification of “private costs and benefits” adapted from
Prelimi-
nary Regulatory Impact Analysis: Corporate Average Fuel
Economy for MY 2017-2025 Passenger Cars and Light
Trucks, Department of Transportation, National Highway
Traffic Safety Administration, Table VIII-27.
Component 2017 … 2025 Total
Technology costs $1.7 $29.9 $108.9
Benefits (other costs)
Li feti me fuel expendi tures (i ncl udi ng tax) $8.0 … $96.1
$384.5
Cons umer s urpl us from addi ti onal dri vi ng $0.1 $2.6 $7.4
Refuel i ng ti me val ue $0.4 $2.6 $12.8
Subtotal benefi ts (other cos ts ) $8.4 $101.2 $404.7
Net total benefits $6.7 $71.3 $295.7
Present Values ($billions)
This document is authorized for use only by Hameeda Lamb in
Business & Economic Policy Graduate Online Fall 2018-2019 at
Northwood University, 2018.
HKS Case Program 12 of 16 Case Number 1973.0
3. Improvements in fuel efficiency could be used to increase
MPG or to yield improvements in other attrib-
utes, such as better performance or larger vehicles. Consumers
may prefer cars that use technology im-
provements to achieve better performance (e.g. engines with
higher horsepower) or more room, not just
higher MPG. 38
4. In the face of uncertainty about future fuel prices, the
NHTSA suggested that buyers might exhibit “loss
aversion,” a tendency to give much more weight to potential
losses than to potential gains. Faced with
uncertainty about future fuel prices and hence savings, vehicle
buyers might give too much weight to the
scenarios in which low prices led to net losses from spending
more on fuel-efficient vehicles.
39
5. Imperfect competition among manufacturers could reduce
their incentives to supply vehicle attributes for
which consumers were willing to pay. For example, the NHTSA
considered the likelihood that manufac-
turers intentionally did not invest in fuel-efficient technologies
for larger vehicles such as minivans and
SUVs because they believed that prospective consumers were
unlikely to pay more for higher fuel econ-
omy in this vehicle range.
6. The NHTSA also suggested that the market for vehicle fuel
economy might not work efficiently because
buyers lacked sufficient information on the fuel efficiency of
vehicles, or had difficulty comparing ongoing
fuel-cost savings with higher upfront prices, reducing their
willingness to pay for greater mpg. 40
After discussing these possible explanations, the agency
concluded that:
[NHTSA]- has been unable to reach a conclusive answer to the
question of why the ap-
parently large differences between its estimates of benefits from
requiring higher fuel
economy and the costs of supplying it do not result in higher
average fuel economy for
new cars and light trucks.
41
38 An article published in 2011 estimated that if horsepower,
weight and torque had remained at their 1980 levels, fuel econo-
my would have increased by 60 percent, rather than the 15
percent actually experienced between 1980 and 2006.
Christopher
R. Knittel, “Automobiles on Steroids: Product Attribute Trade-
Offs and Technological Progress in the Automobile Sector,”
Amer-
ican Economic Review, 101, (December 2011).
39 Studies by behavioral economists indicate that individuals
generally give much higher weight to potential losses than to
po-
tential gains.
40 Manufacturers had been required from the start of CAFE to
post fuel-economy information on labels placed in the windows
of all new cars. The EPA had revised the specifications of those
labels for MY 2008 and had already established new require-
ments to start with MY 2013 (see Exhibit A).
41 “Preliminary Regulatory Impact Analysis: Corporate
Average Fuel Economy for MY 2017-2025 Passenger Cars and
Light
Trucks,” Department of Transportation, National Highway
Traffic Safety Administration, p. 711.
This document is authorized for use only by Hameeda Lamb in
Business & Economic Policy Graduate Online Fall 2018-2019 at
Northwood University, 2018.
HKS Case Program 13 of 16 Case Number 1973.0
Exhibit A. Comparison of Current and New EPA-Required
Window Stickers for New Cars
Note:
Labels must be displayed in the windows of new cars.
Actual size of label is a minimum of 7” x 4.5”(40 CFR 600.307-
08, “Fuel economy label format requirements”).
Sticker for Model Years 2008-2012
Sticker for Model Years 2013-:
Source: 2008-2012 sticker from
http://www.fueleconomy.gov/feg/ratingsnewsticker.shtml,
(accessed October 10,
2012), found under Fueleconomy.gov, About EPA Ratings. 2013
and beyond sticker from
http://www.fueleconomy.gov/feg/Find.do?action=bt1, (accessed
October 10, 2012), found under Fuelecono-
my.gov, About EPA Ratings.
This document is authorized for use only by Hameeda Lamb in
Business & Economic Policy Graduate Online Fall 2018-2019 at
Northwood University, 2018.
http://www.fueleconomy.gov/feg/Find.do?action=bt1
http://www.fueleconomy.gov/feg/ratingsnewsticker.shtml
HKS Case Program 14 of 16 Case Number 1973.0
Appendix 1. Discounting and Present Values
When costs and benefits occur over multiple years, it is
standard practice to “discount” values for the var-
ious years to a common year (often the start of the project in
question). The sum of these discounted values is
their present value. For readers of the case who are not familiar
with discounting, this appendix provides a very
brief overview of the mechanics of and rationales for
discounting.
Rationale for and Mechanics of Discounting
The basic rationale for discounting is that benefits received now
are more valuable than those received
later. Conversely, it is generally better to incur costs later
rather than earlier. That is because there is an opportuni-
ty cost to spending money now, rather than investing it for
later. Even when the funds would not otherwise be
invested, but rather would be consumed now, there is an
opportunity cost because people generally prefer con-
sumption now to consumption later (as witness the many people
who take on debt through credit cards and other
forms of borrowing).
Suppose the opportunity cost of funds is that it could be
invested at an interest rate of r. Thus, $1 invest-
ed today will grow to $(1+r) next year, $(1+r)2 in two years,
and so forth. Alternatively, if you needed to spend $1
in two years, you would have to invest only $1/(1+r)2 today,
because it would grow to $1 in two years.
Assume we have a stream of benefits and costs, where Bt are Ct
are the values in year t. The net benefits
in a given year are Nt = Bt – Ct. If the benefits and/or costs
happen “now” and then over a period of T years, the Net
Present Value (NPV) of that stream is:
T
T
r
N
r
N
r
N
NNPV
)1(
...
)1(1 2
21
0
+
++
+
+
+
+= .
If the analysis is done in constant rather than nominal dollars,
as most benefit-costs analyses are, the discount rate
used should be a real one (net of inflation). For example, if the
relevant nominal rate is 10 percent and inflation is
expected to be 2 percent, the corresponding real discount rate is
a little less than 8 percent.
42
For example, suppose the extra cost of a car under a proposed
rule is $500, but it yields savings of $70 per
year over the next 10 years. Thus, the annual cash flow is -$500
in year 0 and +$70 for each of the next 10 years.
The total savings will be $700 compared to costs of $500, but
the costs are incurred now and the benefits are re-
ceived later. Simply adding up the costs and benefits over time
implicitly uses a zero discount rate. With a positive
discount rate, the present value of benefits may not exceed
costs.
42 Strictly speaking, if the relevant nominal interest rate is n
and the inflation rate is i, the corresponding real rate is 1
1
1
−
+
+
=
i
n
r .
For n = 10% and i =2%, r = 0.078. = 7.8%, slightly less than the
8% we get by subtracting the inflation rate from the nominal in-
terest rate.
This document is authorized for use only by Hameeda Lamb in
Business & Economic Policy Graduate Online Fall 2018-2019 at
Northwood University, 2018.
HKS Case Program 15 of 16 Case Number 1973.0
Choice of Discount Rate
If the temporal distributions of costs and benefits differ
substantially, the discount rate used to compute
present values can have a very large impact on whether a
project yields positive or negative estimated net bene-
fits. For example, at a discount rate of 7 percent, $1 received
each year for 10 years is equivalent to $7.02 received
now. At a discount rate of 3%, the present value is significantly
higher at $8.58. However, at 12 percent, the pre-
sent value is only $5.65.
The discount rate(s) used to calculate present values for
government projects or regulations have been
the subject of considerable controversy over many years. The
Office of Management and Budget (OMB), which
reviews RIAs and issues guidelines for conducting them,
recommends that agencies report results for rates of both
7 percent and 3 percent. 43 According to OMB, the higher rate
reflects estimates of the long-term average real re-
turn on private capital in the U.S. economy (before taxes). The
lower rate reflects the lower after-tax average re-
turns that investors have received over the long-term. 44
43 “Circular A-4 Regulatory Analysis,” Guidelines and
Discount Rates for Benefit-Cost Analysis of Federal Programs,”
Office of
Management and Budget, September 17, 2003,
http://www.whitehouse.gov/sites/default/files/omb/assets/regula
tory_matters_pdf/a-4.pdf, (accessed August 24, 2012).
44 After-tax rates of return are reduced from pre-tax rates by
corporate and individual income taxes at the federal, state, and
local levels.
This document is authorized for use only by Hameeda Lamb in
Business & Economic Policy Graduate Online Fall 2018-2019 at
Northwood University, 2018.
http://www.whitehouse.gov/sites/default/files/omb/assets/regula
tory_matters_pdf/a-4.pdf
HKS Case Program 16 of 16 Case Number 1973.0
Appendix 2. Harmonic Means Used to Compute Average MPG
The average mpg for a group of vehicles is computed using a
harmonic mean rather than a regular arith-
metic mean. The arithmetic mean of mpgs implicitly assumes
that each vehicle uses the same amount of gasoline
per year. It is much more plausible to think that vehicles will
drive the same numbers of miles per year (before
accounting for the rebound effect).
Suppose we have two cars, one that gets m1 mpg and one that
gets m2 mpg. The arithmetic mean of those
two numbers is:
.
2
21 mmmeanArithmetic +=
In contrast, the harmonic mean is:
+= 2/
11
/1
21 mm
meanHarmonic
To see the difference, consider an example where the two cars
get 10 and 40 mpg, respectively. The arithmetic
mean is 25 mpg. However, the harmonic mean is much lower:
16]2/)40/110/1/[(1 =+ . To see why the harmonic
mean is a more useful measure in this context, suppose each car
travels 10,000 miles per year. Total consumption
of fuel will be 10,000/10 + 10,000/40 = 1,000 + 250 = 1,250
gallons. Because they travel a combined 20,000 miles,
their average mpg will be 20,000/1,250 = 16 mpg, the harmonic
mean of 10 and 40 mpg.
In Europe, fuel efficiency is measured in liters/100 km and a
smaller number means greater fuel efficien-
cy. When the measure is fuel volume per distance traveled, a
simple sales-weighted average gives the correct
overall average for a fleet of vehicles. For example, if we
converted our mpg figures to gallons/100 miles they
would be 10 gallons per 100 miles and 2.5 gallons per 100
miles. Their simple average would be (10 + 2.5)/2 = 6.25
gallons per 100 miles, which is equivalent to 100/6.25 = 16
mpg.
The use of mpg can also confuse one’s intuition about the
relative impacts of changes in fuel economy.
For example, suppose we increase fuel economy for vehicle 1 (a
minivan) from 15 mpg to 20 mpg and for vehicle 2
(a small size sedan) from 30 to 60 mpg. Which change saves
more fuel? It is tempting to say vehicle 2, where we
have increase fuel economy by 30 mpg compared to only 5 mpg
for vehicle 1. Moreover, for vehicle 1 the percent-
age improvement is only 33 percent, compared to 100 percent
for vehicle 2. However, if we work out the actual
savings in fuel consumption if each vehicle travels 10,000 miles
per year, they are exactly the same:
Vehicle 1: 10,000 miles/15mpg – 10,000 miles/20mpg = 667
gallons - 500 gallons = 167 gallons
Vehicle 2: 10,000 miles/30mpg – 10,000 miles/60mpg = 333
gallons – 167 gallons = 167 gallons.
As this example illustrates, increasing mpg is much more
valuable when the base is low than when it is relatively
high.
This document is authorized for use only by Hameeda Lamb in
Business & Economic Policy Graduate Online Fall 2018-2019 at
Northwood University, 2018.
Corporate Average Fuel Economy Standards 2017-2025Exhibit
A. Comparison of Current and New EPA-Required Window
Stickers for New CarsAppendix 1. Discounting and Present
Values
Principles of Business Management
Week 5 Assignment
Motivation
Research and discuss the basic theories of motivation as well as
a description of what
they are.
The requirements below must be met for your paper to be
accepted and graded:
– 750 words (approximately 2 – 3 pages)
using Microsoft Word.
from references.
st two references from outside the course material,
preferably from
EBSCOhost. Text book, lectures, and other materials in the
course may be used,
but are not counted toward the two reference requirement.
Reference material (data, dates, graphs, quotes, paraphrased
words, values, etc.) must
be identified in the paper and listed on a reference page.
Reference material (data,
dates, graphs, quotes, paraphrased words, values, etc.) must
come from sources such
as, scholarly journals found in EBSCOhost, online newspapers
such as The Wall Street
Journal, government websites, etc. Sources such as Wikis,
Yahoo Answers, eHow, etc.
are not acceptable.

More Related Content

Similar to HKS727 Case Number 1973.0 This case was written by .docx

Perspectives on Automotive Policy and Fuel Economy
Perspectives on Automotive Policy and Fuel EconomyPerspectives on Automotive Policy and Fuel Economy
Perspectives on Automotive Policy and Fuel Economyjmdecicco
 
General Overview and Forecasting of Factors Affecting the Use of Electric Veh...
General Overview and Forecasting of Factors Affecting the Use of Electric Veh...General Overview and Forecasting of Factors Affecting the Use of Electric Veh...
General Overview and Forecasting of Factors Affecting the Use of Electric Veh...ijtsrd
 
Executive Summary (5 page paper)· Research any of following Webs.docx
Executive Summary (5 page paper)· Research any of following Webs.docxExecutive Summary (5 page paper)· Research any of following Webs.docx
Executive Summary (5 page paper)· Research any of following Webs.docxrhetttrevannion
 
A Fuel Efficiency Horizon for U.S. Automobiles
A Fuel Efficiency Horizon for U.S. AutomobilesA Fuel Efficiency Horizon for U.S. Automobiles
A Fuel Efficiency Horizon for U.S. Automobilesjmdecicco
 
CALSTART Electric Utility Fleet Managers Conference
CALSTART Electric Utility Fleet Managers ConferenceCALSTART Electric Utility Fleet Managers Conference
CALSTART Electric Utility Fleet Managers ConferenceCALSTART
 
ACV des véhicules électriques et thermiques aux US - MIT
ACV des véhicules électriques et thermiques aux US - MITACV des véhicules électriques et thermiques aux US - MIT
ACV des véhicules électriques et thermiques aux US - MITGhislain Delabie
 
Ev charging infrastructure market
Ev charging infrastructure marketEv charging infrastructure market
Ev charging infrastructure marketSoniaJain56
 
Decarbonization Methods in Vermont Report 2019 1 to 146 pages
Decarbonization Methods in Vermont Report 2019 1 to 146 pagesDecarbonization Methods in Vermont Report 2019 1 to 146 pages
Decarbonization Methods in Vermont Report 2019 1 to 146 pagesE.S.G. JR. Consulting, Inc.
 
air_08030301a
air_08030301aair_08030301a
air_08030301aMatt Peak
 
Total Cost of Ownership: A Gas vs. Diesel Comparison
Total Cost of Ownership: A Gas vs. Diesel ComparisonTotal Cost of Ownership: A Gas vs. Diesel Comparison
Total Cost of Ownership: A Gas vs. Diesel ComparisonCameron Hill
 
MEMORANDUM TO​ Oregon Assembly for Trucking Electrificati
MEMORANDUM TO​ Oregon Assembly for Trucking ElectrificatiMEMORANDUM TO​ Oregon Assembly for Trucking Electrificati
MEMORANDUM TO​ Oregon Assembly for Trucking ElectrificatiAbramMartino96
 
Natural Gas Vehicle Infrastructure business models
Natural Gas Vehicle Infrastructure business modelsNatural Gas Vehicle Infrastructure business models
Natural Gas Vehicle Infrastructure business modelspiersfrench
 
WRI - Seeing is Believing: Creating a New Climate Economy in the United States
WRI - Seeing is Believing: Creating a New Climate Economy in the United StatesWRI - Seeing is Believing: Creating a New Climate Economy in the United States
WRI - Seeing is Believing: Creating a New Climate Economy in the United StatesMarcellus Drilling News
 
Science and Policy
Science and PolicyScience and Policy
Science and Policyestrahle
 
Where Were the Auditors and Attorneys during the Sustainabilit.docx
Where Were the Auditors and Attorneys during the Sustainabilit.docxWhere Were the Auditors and Attorneys during the Sustainabilit.docx
Where Were the Auditors and Attorneys during the Sustainabilit.docxtroutmanboris
 
PowerPoint_3E_Garden_Instructions.docxGrader - InstructionsPP.docx
PowerPoint_3E_Garden_Instructions.docxGrader - InstructionsPP.docxPowerPoint_3E_Garden_Instructions.docxGrader - InstructionsPP.docx
PowerPoint_3E_Garden_Instructions.docxGrader - InstructionsPP.docxpauline234567
 

Similar to HKS727 Case Number 1973.0 This case was written by .docx (19)

PLS_LNG_Study
PLS_LNG_StudyPLS_LNG_Study
PLS_LNG_Study
 
Perspectives on Automotive Policy and Fuel Economy
Perspectives on Automotive Policy and Fuel EconomyPerspectives on Automotive Policy and Fuel Economy
Perspectives on Automotive Policy and Fuel Economy
 
General Overview and Forecasting of Factors Affecting the Use of Electric Veh...
General Overview and Forecasting of Factors Affecting the Use of Electric Veh...General Overview and Forecasting of Factors Affecting the Use of Electric Veh...
General Overview and Forecasting of Factors Affecting the Use of Electric Veh...
 
Executive Summary (5 page paper)· Research any of following Webs.docx
Executive Summary (5 page paper)· Research any of following Webs.docxExecutive Summary (5 page paper)· Research any of following Webs.docx
Executive Summary (5 page paper)· Research any of following Webs.docx
 
A Fuel Efficiency Horizon for U.S. Automobiles
A Fuel Efficiency Horizon for U.S. AutomobilesA Fuel Efficiency Horizon for U.S. Automobiles
A Fuel Efficiency Horizon for U.S. Automobiles
 
CALSTART Electric Utility Fleet Managers Conference
CALSTART Electric Utility Fleet Managers ConferenceCALSTART Electric Utility Fleet Managers Conference
CALSTART Electric Utility Fleet Managers Conference
 
ACV des véhicules électriques et thermiques aux US - MIT
ACV des véhicules électriques et thermiques aux US - MITACV des véhicules électriques et thermiques aux US - MIT
ACV des véhicules électriques et thermiques aux US - MIT
 
The Electric Car Tipping Point
The Electric Car Tipping PointThe Electric Car Tipping Point
The Electric Car Tipping Point
 
Ev charging infrastructure market
Ev charging infrastructure marketEv charging infrastructure market
Ev charging infrastructure market
 
Decarbonization Methods in Vermont Report 2019 1 to 146 pages
Decarbonization Methods in Vermont Report 2019 1 to 146 pagesDecarbonization Methods in Vermont Report 2019 1 to 146 pages
Decarbonization Methods in Vermont Report 2019 1 to 146 pages
 
air_08030301a
air_08030301aair_08030301a
air_08030301a
 
Total Cost of Ownership: A Gas vs. Diesel Comparison
Total Cost of Ownership: A Gas vs. Diesel ComparisonTotal Cost of Ownership: A Gas vs. Diesel Comparison
Total Cost of Ownership: A Gas vs. Diesel Comparison
 
Vehicle fuel economy standards and feebates
Vehicle fuel economy standards and feebatesVehicle fuel economy standards and feebates
Vehicle fuel economy standards and feebates
 
MEMORANDUM TO​ Oregon Assembly for Trucking Electrificati
MEMORANDUM TO​ Oregon Assembly for Trucking ElectrificatiMEMORANDUM TO​ Oregon Assembly for Trucking Electrificati
MEMORANDUM TO​ Oregon Assembly for Trucking Electrificati
 
Natural Gas Vehicle Infrastructure business models
Natural Gas Vehicle Infrastructure business modelsNatural Gas Vehicle Infrastructure business models
Natural Gas Vehicle Infrastructure business models
 
WRI - Seeing is Believing: Creating a New Climate Economy in the United States
WRI - Seeing is Believing: Creating a New Climate Economy in the United StatesWRI - Seeing is Believing: Creating a New Climate Economy in the United States
WRI - Seeing is Believing: Creating a New Climate Economy in the United States
 
Science and Policy
Science and PolicyScience and Policy
Science and Policy
 
Where Were the Auditors and Attorneys during the Sustainabilit.docx
Where Were the Auditors and Attorneys during the Sustainabilit.docxWhere Were the Auditors and Attorneys during the Sustainabilit.docx
Where Were the Auditors and Attorneys during the Sustainabilit.docx
 
PowerPoint_3E_Garden_Instructions.docxGrader - InstructionsPP.docx
PowerPoint_3E_Garden_Instructions.docxGrader - InstructionsPP.docxPowerPoint_3E_Garden_Instructions.docxGrader - InstructionsPP.docx
PowerPoint_3E_Garden_Instructions.docxGrader - InstructionsPP.docx
 

More from AASTHA76

(APA 6th Edition Formatting and St.docx
(APA 6th Edition Formatting and St.docx(APA 6th Edition Formatting and St.docx
(APA 6th Edition Formatting and St.docxAASTHA76
 
(a) Thrasymachus’ (the sophist’s) definition of Justice or Right o.docx
(a) Thrasymachus’ (the sophist’s) definition of Justice or Right o.docx(a) Thrasymachus’ (the sophist’s) definition of Justice or Right o.docx
(a) Thrasymachus’ (the sophist’s) definition of Justice or Right o.docxAASTHA76
 
(Glossary of Telemedicine and eHealth)· Teleconsultation Cons.docx
(Glossary of Telemedicine and eHealth)· Teleconsultation Cons.docx(Glossary of Telemedicine and eHealth)· Teleconsultation Cons.docx
(Glossary of Telemedicine and eHealth)· Teleconsultation Cons.docxAASTHA76
 
(Assmt 1; Week 3 paper) Using ecree Doing the paper and s.docx
(Assmt 1; Week 3 paper)  Using ecree        Doing the paper and s.docx(Assmt 1; Week 3 paper)  Using ecree        Doing the paper and s.docx
(Assmt 1; Week 3 paper) Using ecree Doing the paper and s.docxAASTHA76
 
(Image retrieved at httpswww.google.comsearchhl=en&biw=122.docx
(Image retrieved at  httpswww.google.comsearchhl=en&biw=122.docx(Image retrieved at  httpswww.google.comsearchhl=en&biw=122.docx
(Image retrieved at httpswww.google.comsearchhl=en&biw=122.docxAASTHA76
 
(Dis) Placing Culture and Cultural Space Chapter 4.docx
(Dis) Placing Culture and Cultural Space Chapter 4.docx(Dis) Placing Culture and Cultural Space Chapter 4.docx
(Dis) Placing Culture and Cultural Space Chapter 4.docxAASTHA76
 
(1) Define the time value of money.  Do you believe that the ave.docx
(1) Define the time value of money.  Do you believe that the ave.docx(1) Define the time value of money.  Do you believe that the ave.docx
(1) Define the time value of money.  Do you believe that the ave.docxAASTHA76
 
(chapter taken from Learning Power)From Social Class and t.docx
(chapter taken from Learning Power)From Social Class and t.docx(chapter taken from Learning Power)From Social Class and t.docx
(chapter taken from Learning Power)From Social Class and t.docxAASTHA76
 
(Accessible at httpswww.hatchforgood.orgexplore102nonpro.docx
(Accessible at httpswww.hatchforgood.orgexplore102nonpro.docx(Accessible at httpswww.hatchforgood.orgexplore102nonpro.docx
(Accessible at httpswww.hatchforgood.orgexplore102nonpro.docxAASTHA76
 
(a) The current ratio of a company is 61 and its acid-test ratio .docx
(a) The current ratio of a company is 61 and its acid-test ratio .docx(a) The current ratio of a company is 61 and its acid-test ratio .docx
(a) The current ratio of a company is 61 and its acid-test ratio .docxAASTHA76
 
(1) How does quantum cryptography eliminate the problem of eaves.docx
(1) How does quantum cryptography eliminate the problem of eaves.docx(1) How does quantum cryptography eliminate the problem of eaves.docx
(1) How does quantum cryptography eliminate the problem of eaves.docxAASTHA76
 
#transformation10EventTrendsfor 201910 Event.docx
#transformation10EventTrendsfor 201910 Event.docx#transformation10EventTrendsfor 201910 Event.docx
#transformation10EventTrendsfor 201910 Event.docxAASTHA76
 
$10 now and $10 when complete Use resources from the required .docx
$10 now and $10 when complete Use resources from the required .docx$10 now and $10 when complete Use resources from the required .docx
$10 now and $10 when complete Use resources from the required .docxAASTHA76
 
#MicroXplorer Configuration settings - do not modifyFile.Versio.docx
#MicroXplorer Configuration settings - do not modifyFile.Versio.docx#MicroXplorer Configuration settings - do not modifyFile.Versio.docx
#MicroXplorer Configuration settings - do not modifyFile.Versio.docxAASTHA76
 
#include string.h#include stdlib.h#include systypes.h.docx
#include string.h#include stdlib.h#include systypes.h.docx#include string.h#include stdlib.h#include systypes.h.docx
#include string.h#include stdlib.h#include systypes.h.docxAASTHA76
 
$ stated in thousands)Net Assets, Controlling Interest.docx
$ stated in thousands)Net Assets, Controlling Interest.docx$ stated in thousands)Net Assets, Controlling Interest.docx
$ stated in thousands)Net Assets, Controlling Interest.docxAASTHA76
 
#include stdio.h#include stdlib.h#include pthread.h#in.docx
#include stdio.h#include stdlib.h#include pthread.h#in.docx#include stdio.h#include stdlib.h#include pthread.h#in.docx
#include stdio.h#include stdlib.h#include pthread.h#in.docxAASTHA76
 
#include customer.h#include heap.h#include iostream.docx
#include customer.h#include heap.h#include iostream.docx#include customer.h#include heap.h#include iostream.docx
#include customer.h#include heap.h#include iostream.docxAASTHA76
 
#Assessment BriefDiploma of Business Eco.docx
#Assessment BriefDiploma of Business Eco.docx#Assessment BriefDiploma of Business Eco.docx
#Assessment BriefDiploma of Business Eco.docxAASTHA76
 
#include stdio.h#include stdint.h#include stdbool.h.docx
#include stdio.h#include stdint.h#include stdbool.h.docx#include stdio.h#include stdint.h#include stdbool.h.docx
#include stdio.h#include stdint.h#include stdbool.h.docxAASTHA76
 

More from AASTHA76 (20)

(APA 6th Edition Formatting and St.docx
(APA 6th Edition Formatting and St.docx(APA 6th Edition Formatting and St.docx
(APA 6th Edition Formatting and St.docx
 
(a) Thrasymachus’ (the sophist’s) definition of Justice or Right o.docx
(a) Thrasymachus’ (the sophist’s) definition of Justice or Right o.docx(a) Thrasymachus’ (the sophist’s) definition of Justice or Right o.docx
(a) Thrasymachus’ (the sophist’s) definition of Justice or Right o.docx
 
(Glossary of Telemedicine and eHealth)· Teleconsultation Cons.docx
(Glossary of Telemedicine and eHealth)· Teleconsultation Cons.docx(Glossary of Telemedicine and eHealth)· Teleconsultation Cons.docx
(Glossary of Telemedicine and eHealth)· Teleconsultation Cons.docx
 
(Assmt 1; Week 3 paper) Using ecree Doing the paper and s.docx
(Assmt 1; Week 3 paper)  Using ecree        Doing the paper and s.docx(Assmt 1; Week 3 paper)  Using ecree        Doing the paper and s.docx
(Assmt 1; Week 3 paper) Using ecree Doing the paper and s.docx
 
(Image retrieved at httpswww.google.comsearchhl=en&biw=122.docx
(Image retrieved at  httpswww.google.comsearchhl=en&biw=122.docx(Image retrieved at  httpswww.google.comsearchhl=en&biw=122.docx
(Image retrieved at httpswww.google.comsearchhl=en&biw=122.docx
 
(Dis) Placing Culture and Cultural Space Chapter 4.docx
(Dis) Placing Culture and Cultural Space Chapter 4.docx(Dis) Placing Culture and Cultural Space Chapter 4.docx
(Dis) Placing Culture and Cultural Space Chapter 4.docx
 
(1) Define the time value of money.  Do you believe that the ave.docx
(1) Define the time value of money.  Do you believe that the ave.docx(1) Define the time value of money.  Do you believe that the ave.docx
(1) Define the time value of money.  Do you believe that the ave.docx
 
(chapter taken from Learning Power)From Social Class and t.docx
(chapter taken from Learning Power)From Social Class and t.docx(chapter taken from Learning Power)From Social Class and t.docx
(chapter taken from Learning Power)From Social Class and t.docx
 
(Accessible at httpswww.hatchforgood.orgexplore102nonpro.docx
(Accessible at httpswww.hatchforgood.orgexplore102nonpro.docx(Accessible at httpswww.hatchforgood.orgexplore102nonpro.docx
(Accessible at httpswww.hatchforgood.orgexplore102nonpro.docx
 
(a) The current ratio of a company is 61 and its acid-test ratio .docx
(a) The current ratio of a company is 61 and its acid-test ratio .docx(a) The current ratio of a company is 61 and its acid-test ratio .docx
(a) The current ratio of a company is 61 and its acid-test ratio .docx
 
(1) How does quantum cryptography eliminate the problem of eaves.docx
(1) How does quantum cryptography eliminate the problem of eaves.docx(1) How does quantum cryptography eliminate the problem of eaves.docx
(1) How does quantum cryptography eliminate the problem of eaves.docx
 
#transformation10EventTrendsfor 201910 Event.docx
#transformation10EventTrendsfor 201910 Event.docx#transformation10EventTrendsfor 201910 Event.docx
#transformation10EventTrendsfor 201910 Event.docx
 
$10 now and $10 when complete Use resources from the required .docx
$10 now and $10 when complete Use resources from the required .docx$10 now and $10 when complete Use resources from the required .docx
$10 now and $10 when complete Use resources from the required .docx
 
#MicroXplorer Configuration settings - do not modifyFile.Versio.docx
#MicroXplorer Configuration settings - do not modifyFile.Versio.docx#MicroXplorer Configuration settings - do not modifyFile.Versio.docx
#MicroXplorer Configuration settings - do not modifyFile.Versio.docx
 
#include string.h#include stdlib.h#include systypes.h.docx
#include string.h#include stdlib.h#include systypes.h.docx#include string.h#include stdlib.h#include systypes.h.docx
#include string.h#include stdlib.h#include systypes.h.docx
 
$ stated in thousands)Net Assets, Controlling Interest.docx
$ stated in thousands)Net Assets, Controlling Interest.docx$ stated in thousands)Net Assets, Controlling Interest.docx
$ stated in thousands)Net Assets, Controlling Interest.docx
 
#include stdio.h#include stdlib.h#include pthread.h#in.docx
#include stdio.h#include stdlib.h#include pthread.h#in.docx#include stdio.h#include stdlib.h#include pthread.h#in.docx
#include stdio.h#include stdlib.h#include pthread.h#in.docx
 
#include customer.h#include heap.h#include iostream.docx
#include customer.h#include heap.h#include iostream.docx#include customer.h#include heap.h#include iostream.docx
#include customer.h#include heap.h#include iostream.docx
 
#Assessment BriefDiploma of Business Eco.docx
#Assessment BriefDiploma of Business Eco.docx#Assessment BriefDiploma of Business Eco.docx
#Assessment BriefDiploma of Business Eco.docx
 
#include stdio.h#include stdint.h#include stdbool.h.docx
#include stdio.h#include stdint.h#include stdbool.h.docx#include stdio.h#include stdint.h#include stdbool.h.docx
#include stdio.h#include stdint.h#include stdbool.h.docx
 

Recently uploaded

EPANDING THE CONTENT OF AN OUTLINE using notes.pptx
EPANDING THE CONTENT OF AN OUTLINE using notes.pptxEPANDING THE CONTENT OF AN OUTLINE using notes.pptx
EPANDING THE CONTENT OF AN OUTLINE using notes.pptxRaymartEstabillo3
 
Incoming and Outgoing Shipments in 1 STEP Using Odoo 17
Incoming and Outgoing Shipments in 1 STEP Using Odoo 17Incoming and Outgoing Shipments in 1 STEP Using Odoo 17
Incoming and Outgoing Shipments in 1 STEP Using Odoo 17Celine George
 
Roles & Responsibilities in Pharmacovigilance
Roles & Responsibilities in PharmacovigilanceRoles & Responsibilities in Pharmacovigilance
Roles & Responsibilities in PharmacovigilanceSamikshaHamane
 
Pharmacognosy Flower 3. Compositae 2023.pdf
Pharmacognosy Flower 3. Compositae 2023.pdfPharmacognosy Flower 3. Compositae 2023.pdf
Pharmacognosy Flower 3. Compositae 2023.pdfMahmoud M. Sallam
 
Biting mechanism of poisonous snakes.pdf
Biting mechanism of poisonous snakes.pdfBiting mechanism of poisonous snakes.pdf
Biting mechanism of poisonous snakes.pdfadityarao40181
 
Framing an Appropriate Research Question 6b9b26d93da94caf993c038d9efcdedb.pdf
Framing an Appropriate Research Question 6b9b26d93da94caf993c038d9efcdedb.pdfFraming an Appropriate Research Question 6b9b26d93da94caf993c038d9efcdedb.pdf
Framing an Appropriate Research Question 6b9b26d93da94caf993c038d9efcdedb.pdfUjwalaBharambe
 
Organic Name Reactions for the students and aspirants of Chemistry12th.pptx
Organic Name Reactions  for the students and aspirants of Chemistry12th.pptxOrganic Name Reactions  for the students and aspirants of Chemistry12th.pptx
Organic Name Reactions for the students and aspirants of Chemistry12th.pptxVS Mahajan Coaching Centre
 
CARE OF CHILD IN INCUBATOR..........pptx
CARE OF CHILD IN INCUBATOR..........pptxCARE OF CHILD IN INCUBATOR..........pptx
CARE OF CHILD IN INCUBATOR..........pptxGaneshChakor2
 
Hierarchy of management that covers different levels of management
Hierarchy of management that covers different levels of managementHierarchy of management that covers different levels of management
Hierarchy of management that covers different levels of managementmkooblal
 
Computed Fields and api Depends in the Odoo 17
Computed Fields and api Depends in the Odoo 17Computed Fields and api Depends in the Odoo 17
Computed Fields and api Depends in the Odoo 17Celine George
 
DATA STRUCTURE AND ALGORITHM for beginners
DATA STRUCTURE AND ALGORITHM for beginnersDATA STRUCTURE AND ALGORITHM for beginners
DATA STRUCTURE AND ALGORITHM for beginnersSabitha Banu
 
Presiding Officer Training module 2024 lok sabha elections
Presiding Officer Training module 2024 lok sabha electionsPresiding Officer Training module 2024 lok sabha elections
Presiding Officer Training module 2024 lok sabha electionsanshu789521
 
Crayon Activity Handout For the Crayon A
Crayon Activity Handout For the Crayon ACrayon Activity Handout For the Crayon A
Crayon Activity Handout For the Crayon AUnboundStockton
 
Alper Gobel In Media Res Media Component
Alper Gobel In Media Res Media ComponentAlper Gobel In Media Res Media Component
Alper Gobel In Media Res Media ComponentInMediaRes1
 
call girls in Kamla Market (DELHI) 🔝 >༒9953330565🔝 genuine Escort Service 🔝✔️✔️
call girls in Kamla Market (DELHI) 🔝 >༒9953330565🔝 genuine Escort Service 🔝✔️✔️call girls in Kamla Market (DELHI) 🔝 >༒9953330565🔝 genuine Escort Service 🔝✔️✔️
call girls in Kamla Market (DELHI) 🔝 >༒9953330565🔝 genuine Escort Service 🔝✔️✔️9953056974 Low Rate Call Girls In Saket, Delhi NCR
 
Software Engineering Methodologies (overview)
Software Engineering Methodologies (overview)Software Engineering Methodologies (overview)
Software Engineering Methodologies (overview)eniolaolutunde
 
ECONOMIC CONTEXT - LONG FORM TV DRAMA - PPT
ECONOMIC CONTEXT - LONG FORM TV DRAMA - PPTECONOMIC CONTEXT - LONG FORM TV DRAMA - PPT
ECONOMIC CONTEXT - LONG FORM TV DRAMA - PPTiammrhaywood
 

Recently uploaded (20)

EPANDING THE CONTENT OF AN OUTLINE using notes.pptx
EPANDING THE CONTENT OF AN OUTLINE using notes.pptxEPANDING THE CONTENT OF AN OUTLINE using notes.pptx
EPANDING THE CONTENT OF AN OUTLINE using notes.pptx
 
Incoming and Outgoing Shipments in 1 STEP Using Odoo 17
Incoming and Outgoing Shipments in 1 STEP Using Odoo 17Incoming and Outgoing Shipments in 1 STEP Using Odoo 17
Incoming and Outgoing Shipments in 1 STEP Using Odoo 17
 
Roles & Responsibilities in Pharmacovigilance
Roles & Responsibilities in PharmacovigilanceRoles & Responsibilities in Pharmacovigilance
Roles & Responsibilities in Pharmacovigilance
 
Model Call Girl in Tilak Nagar Delhi reach out to us at 🔝9953056974🔝
Model Call Girl in Tilak Nagar Delhi reach out to us at 🔝9953056974🔝Model Call Girl in Tilak Nagar Delhi reach out to us at 🔝9953056974🔝
Model Call Girl in Tilak Nagar Delhi reach out to us at 🔝9953056974🔝
 
Pharmacognosy Flower 3. Compositae 2023.pdf
Pharmacognosy Flower 3. Compositae 2023.pdfPharmacognosy Flower 3. Compositae 2023.pdf
Pharmacognosy Flower 3. Compositae 2023.pdf
 
OS-operating systems- ch04 (Threads) ...
OS-operating systems- ch04 (Threads) ...OS-operating systems- ch04 (Threads) ...
OS-operating systems- ch04 (Threads) ...
 
Biting mechanism of poisonous snakes.pdf
Biting mechanism of poisonous snakes.pdfBiting mechanism of poisonous snakes.pdf
Biting mechanism of poisonous snakes.pdf
 
Framing an Appropriate Research Question 6b9b26d93da94caf993c038d9efcdedb.pdf
Framing an Appropriate Research Question 6b9b26d93da94caf993c038d9efcdedb.pdfFraming an Appropriate Research Question 6b9b26d93da94caf993c038d9efcdedb.pdf
Framing an Appropriate Research Question 6b9b26d93da94caf993c038d9efcdedb.pdf
 
Organic Name Reactions for the students and aspirants of Chemistry12th.pptx
Organic Name Reactions  for the students and aspirants of Chemistry12th.pptxOrganic Name Reactions  for the students and aspirants of Chemistry12th.pptx
Organic Name Reactions for the students and aspirants of Chemistry12th.pptx
 
CARE OF CHILD IN INCUBATOR..........pptx
CARE OF CHILD IN INCUBATOR..........pptxCARE OF CHILD IN INCUBATOR..........pptx
CARE OF CHILD IN INCUBATOR..........pptx
 
Hierarchy of management that covers different levels of management
Hierarchy of management that covers different levels of managementHierarchy of management that covers different levels of management
Hierarchy of management that covers different levels of management
 
Computed Fields and api Depends in the Odoo 17
Computed Fields and api Depends in the Odoo 17Computed Fields and api Depends in the Odoo 17
Computed Fields and api Depends in the Odoo 17
 
DATA STRUCTURE AND ALGORITHM for beginners
DATA STRUCTURE AND ALGORITHM for beginnersDATA STRUCTURE AND ALGORITHM for beginners
DATA STRUCTURE AND ALGORITHM for beginners
 
ESSENTIAL of (CS/IT/IS) class 06 (database)
ESSENTIAL of (CS/IT/IS) class 06 (database)ESSENTIAL of (CS/IT/IS) class 06 (database)
ESSENTIAL of (CS/IT/IS) class 06 (database)
 
Presiding Officer Training module 2024 lok sabha elections
Presiding Officer Training module 2024 lok sabha electionsPresiding Officer Training module 2024 lok sabha elections
Presiding Officer Training module 2024 lok sabha elections
 
Crayon Activity Handout For the Crayon A
Crayon Activity Handout For the Crayon ACrayon Activity Handout For the Crayon A
Crayon Activity Handout For the Crayon A
 
Alper Gobel In Media Res Media Component
Alper Gobel In Media Res Media ComponentAlper Gobel In Media Res Media Component
Alper Gobel In Media Res Media Component
 
call girls in Kamla Market (DELHI) 🔝 >༒9953330565🔝 genuine Escort Service 🔝✔️✔️
call girls in Kamla Market (DELHI) 🔝 >༒9953330565🔝 genuine Escort Service 🔝✔️✔️call girls in Kamla Market (DELHI) 🔝 >༒9953330565🔝 genuine Escort Service 🔝✔️✔️
call girls in Kamla Market (DELHI) 🔝 >༒9953330565🔝 genuine Escort Service 🔝✔️✔️
 
Software Engineering Methodologies (overview)
Software Engineering Methodologies (overview)Software Engineering Methodologies (overview)
Software Engineering Methodologies (overview)
 
ECONOMIC CONTEXT - LONG FORM TV DRAMA - PPT
ECONOMIC CONTEXT - LONG FORM TV DRAMA - PPTECONOMIC CONTEXT - LONG FORM TV DRAMA - PPT
ECONOMIC CONTEXT - LONG FORM TV DRAMA - PPT
 

HKS727 Case Number 1973.0 This case was written by .docx

  • 1. HKS727 Case Number 1973.0 This case was written by Albert L Nichols, Adjunct Lecturer in Public Policy, and Anjani Datla, Case Writer, at the John F. Kenne- dy School of Government, Harvard University. HKS cases are developed solely as the basis for class discussion. Cases are not intended to serve as endorsements, sources of primary data, or illustrations of effective or ineffective management. (January 2012) Funding for this case was provided by the Joseph B. Tompkins, Jr. Fund for Case Study and Research. Copyright © 2012 President and Fellows of Harvard College. No part of this publication may be reproduced, revised, translated, stored in a retrieval system, used in a spreadsheet, or transmitted in any form or by any means without the express written consent of the Case Program. For orders and copyright permission information, please visit our website at http://www.ksgcase.harvard.edu/ or send a written request to Case Program, John F. Kennedy School of Government, Harvard University, 79 John F. Kennedy Street, Cambridge, MA 02138. Corporate Average Fuel Economy Standards 2017-2025 Introduction
  • 2. In December 2011, the United States National Highway Traffic Safety Administration (NHTSA) and the En- vironmental Protection Agency (EPA) issued a joint proposal to dramatically increase fuel economy and reduce greenhouse gas emissions of passenger cars and light trucks sold between Model Years (MY) 2017 and 2025. 1 The joint proposal was an important step in implementing President Obama’s 2010 memorandum calling for both agencies to build on a national program that would “produce a new generation of clean vehicles.” 2 The national program, created in 2009, relied on both the Corporate Average Fuel Economy (CAFE) rules administered by the NHTSA and EPA’s authority to regulate carbon dioxide emissions from vehicles and other sources. The heightened activity on fuel economy standards reflected national concerns about dependence on im- ported oil as well as global climate change. By 2010, Congress had rejected the creation of a cap-and-trade system to reduce carbon dioxide emissions. But many observers saw increasing energy efficiency as a win-win alternative that more than paid for itself in fuel savings. A New York Times article described hearings on the proposed MY 2017-2025 fuel economy standards held in Detroit in early 2012 as “more than 90 people who spoke… asserted
  • 3. that the stricter fuel economy requirements would create jobs, reduce oil consumption, create cleaner air and save drivers money, all while helping automakers increase their profits.” 3 As part of the national program, the NHTSA and EPA had promulgated new CAFE standards in 2010 and 2011 to substantially raise the combined average fuel economy of new cars and light trucks to 34 miles per gallon 1 74859 Federal Register / Vol. 76, No. 231/ Thursday, December 1, 2011. 2 “Presidential Memorandum Regarding Fuel Efficiency Standards,” May 21, 2010, http://www.whitehouse.gov/the- press- office/presidential-memorandum-regarding-fuel-efficiency- standards, (accessed August 14, 2012). Found under Whitehouse.gov, the Press Office. 3 Bunkley, N, “New Gas Economy Rules Generate Wide Support,” New York Times, January 17, 2012. This document is authorized for use only by Hameeda Lamb in Business & Economic Policy Graduate Online Fall 2018-2019 at Northwood University, 2018. http://www.whitehouse.gov/the-press-office/presidential- memorandum-regarding-fuel-efficiency-standards http://www.whitehouse.gov/the-press-office/presidential- memorandum-regarding-fuel-efficiency-standards
  • 4. HKS Case Program 2 of 16 Case Number 1973.0 (mpg) by MY 2016, and had, for the first time, imposed standards on heavy duty trucks. 4 Under the new joint pro- posal, the NHTSA estimated that by MY 2025, new cars and light trucks would achieve even greater average fuel economy of nearly 50 mpg. The NHTSA and EPA predicted that the improvement in fuel economy would reduce national fuel consumption by 4 billion barrels of oil and cut greenhouse gas emissions by 2 billion metric tons of carbon dioxide over the lifetimes of the new vehicles. 5 Overall, the NHTSA concluded that the national program would generate substantial benefits—primarily in the form of savings in fuel costs for vehicle owners—amounting to four times the cost. The present value of the estimated net benefits of the program was about $323 billion at a discount rate of 3 percent, as shown in Table 1. 6 Environmental groups had long called for higher fuel economy standards and welcomed the government’s proposed tightening of the standards. The Environment Defense Fund strongly endorsed the regulation and said it would "help provide energy security, economic security and climate security.” 7 The Union of Concerned Scientists believed the standards would “help spur investments in new
  • 5. automotive technology, which will create jobs and sustain the recovery of the American auto industry.”8 Several consumer groups also hailed the proposal, with the 4 25324 Federal Register / Vol. 75, No. 88 / Friday, May 7, 2010; and 57106 Federal Register / Vol. 76, No. 179 / Thursday, Sep- tember 15, 2011. 5 “NHTSA and EPA Propose to Extend the National Program to Improve Fuel Economy and Greenhouse Gases for Passenger Cars and Light Trucks,” NHTSA CAFE 2017-2025 Notice of Proposed Rulemaking Factsheet, http://www.nhtsa.gov/fuel- economy,(accessed July 2, 2011). Found under NHTSA.gov, CAFE-Fuel Economy. 6 The NHTSA estimated all costs and benefits in constant 2009 dollars. Based on Office of Management and Budget guidelines, the NHTSA calculated present values of all costs and benefits at both 3 and 7 percent discount rates. This case reports figures based on a 3 percent discount rate, which the NHTSA appears to have favored. The NHTSA’s results with a discount rate of 7 percent were very similar in relative terms; e.g., at both discount rates, the ratio of benefits to costs was 4.0. See Appendix 1 for a brief introduction to discounting. 7 “Environmental Defense Fund Statement on U.S. Environmental Protection Agency and National Highway Transportation Safe-
  • 6. ty Administration ‘Proposed Rule 2017- and Later Model Years Light Duty Vehicle Greenhouse Gas Emissions and Corporate Average Fuel Economy Standards’,” Mark MacLeod, Public Hearing, Philadelphia, Pennsylvania, January 19, 2012. 8 “Important Step Towards Cleaner More Fuel Efficient Cars and Trucks,” Union of Concerned Scientists, 2011, http://www.ucsusa.org, (accessed August 13, 2012). Table 1. Estimated Benefits and Costs of Proposed CAFE Standards for Model Years (MY) 2017-2025 Notes: Entries are in billions of 2009 dollars. Entries are sums over lifetimes of vehicles sold during model years 2017-2025, discounted to the start of MY 2017 at 3 percent real discount rate. Source: Preliminary Regulatory Impact Analysis: Corporate Average Fuel Economy for MY 2017-2025 Passenger Cars and Light Trucks, Department of Transportation, National Highway Traffic Safety Administration, Table 13, http://www.nhtsa.gov/fuel-economy, (accessed May 1, 2012). Item Present Value ($billions) Technology costs $109 Total benefits $432 Net benefits $323 This document is authorized for use only by Hameeda Lamb in Business & Economic Policy Graduate Online Fall 2018-2019 at Northwood University, 2018. http://www.nhtsa.gov/fuel-economy
  • 7. http://www.ucsusa.org/ http://www.nhtsa.gov/fuel-economy http://www.nhtsa.gov/fuel-economy HKS Case Program 3 of 16 Case Number 1973.0 Consumer Federation of America calling the stringent targets “one of the most important consumer protection measures to be adopted on the federal level in decades.” 9 A few skeptics, however, believed the proposed rule was fundamentally misguided. Although the majority of auto manufacturers agreed to meet the higher fuel economy targets, the National Association of Auto Dealers voiced opposition. The association stated that vehicle prices would go up more than $3,000 on average (signifi- cantly more than NHTSA’s estimates) to achieve the higher CAFE standards and that "seven million licensed drivers would be priced out of the new-car market.” It added that “real life fuel economy improvements cannot be achieved, and related policy benefits cannot be realized, unless and until consumers actually buy and use those new vehicles.” 10 History of the Corporate Average Fuel Economy Program In 1973, the Arab oil embargo plunged the United States into a large-scale energy crisis. For almost six
  • 8. months, between October 1973 and March 1974, the Arab members of the Organization of Petroleum Exporting Countries (OPEC) shut down oil supply to the U.S. in retaliation for its military support to Israel during the Arab- Israeli war. The embargo led to an unparalleled fuel shortage in the country, marked by sky-rocketing fuel prices and long lines of cars waiting at gas stations. In the aftermath, oil shortages became a rallying cry for energy inde- pendence. Acting on the belief that improving the fuel economy of cars would go a long way toward lowering petro- leum imports, Congress passed the Energy Policy and Conservation Act of 1975, which gave birth to the Corporate Average Fuel Economy program—the country’s first ever fuel economy regulation for cars and trucks. The NHTSA, under the Department of Transportation, was assigned responsibility for administering the CAFE program and im- plementing annual vehicle fuel economy standards starting with MY 1978. In 1979, the NHTSA also began setting CAFE standards for light trucks, separate from passenger cars. 11 The CAFE legislation specified fuel efficiency minimum standards for passenger cars that started at 18
  • 9. mpg in MY 1978 and rose up to 27.5 mpg by MY 1985. With no further increases, fuel economy for passenger cars and light trucks hovered at 27.5 mpg and 20 mpg respectively, for more than twenty years. 12 Although the stand- ards remained constant, the overall average fuel efficiency of new vehicles declined as minivans, pickup trucks, and Sport Utility Vehicles (SUVs)—most of which were classified as light trucks and thus subject to less stringent CAFE limits—became increasingly popular. 9 “A Key Step to Ending America’s Oil Addiction: Policy Makers, Consumers and Automakers are Shifting New Vehicles to Higher Fuel Economy,” Mark Cooper, Jack Gillis, Consumer Federation of America, July 2012. 10 National Association of Auto Dealers comments letter, February 13, 2012, Re: 2017 and Later Model Year Light-Duty Vehicle Greenhouse Gas (GHG) Emissions and Corporate Average Fuel Economy (CAFE); 49 CFR Parts 523, 531, 533, 536, and 537 and 40 CFR Parts 85, 86 and 600; Doc. Nos. NHTSA–2010–0131 and EPA–HQ–OAR–2010–0799. 11 “History of Fuel Economy: One Decade of Innovation, Two Decades of Inaction,” The Pew Environment Group, April 2011. 12 Ibid. This document is authorized for use only by Hameeda Lamb in Business & Economic Policy Graduate Online Fall 2018-2019 at Northwood University, 2018.
  • 10. HKS Case Program 4 of 16 Case Number 1973.0 Under the CAFE program, auto manufacturers did not have to meet the minimum required fuel efficiency target for each vehicle they sold, but could average across vehicles in a particular class. 13 Manufacturers also were awarded credits if they over complied with the standard in a given year, which they could transfer or carry forward or backward, with limited flexibility. Automakers could pay a penalty rather than meet the standard, but only a few relatively small makers of imported luxury cars (such as Jaguar, Mercedes and Porsche) chose to pay the fines in- stead of complying with fuel economy targets. 14 In 2007, Congress passed the Energy Independence and Security Act (EISA), which had numerous provi- sions related to energy efficiency, including new CAFE targets for motor vehicles. EISA required that the NHTSA increase the average fuel economy of cars and light trucks to 35 mpg by 2020. 15 In 2008, the NHTSA proposed standards for cars and light trucks manufactured during MY 2011-2015. In 2004, California had legislated even tighter fuel economy standards, in the form of limits on carbon dioxide emissions. 16 The EPA rejected California’s
  • 11. request for a waiver to impose emissions rules in 2007, citing federal stipulations under the CAFE and EISA legisla- tions, which precluded independent action by states. 17 But within days of assuming office in 2009, President Barack Obama urged the EPA to reconsider California’s waiver request. In March 2009, the NHTSA promulgated the final rule for MY 2011 and announced that it would propose revised fuel efficiency standards for 2012-2016. 18 In May of the same year, President Obama directed the EPA and NHTSA to work together to establish coordinated national fuel efficiency and carbon emissions standards, and to move up fuel efficiency targets set in EISA from 2020 to 2016 (which would also be consistent with California’s proposed carbon emissions standards). As part of the negotiations leading up to the directive, California agreed to follow the federal standards for 2012-2016 and auto manufacturers agreed not to pursue further legal efforts to block California from setting its own emissions standards for later years. The EPA issued California’s waiver in June 13 The average mpg for a group of vehicles is computed using a harmonic mean rather than a regular arithmetic mean. See Ap- pendix 2 for a discussion of the differences between the two types of means.
  • 12. 14 The level of the fine has varied over time and currently adjusts with inflation. At the time of the proposal, the rate was $5.50/0.1 mpg per vehicle (74900 Federal Register/ Vol. 76, No. 231/ Thursday, December 1, 2011). Thus, for example, if a manufacturer’s fleet averaged 5 mpg more than allowed, it would pay 5 x 10 x $5.50 = $275/vehicle. The EPA, however, had authority to charge dramatically higher penalties under the Clean Air Act (74902 Federal Register/ Vol. 76, No. 231/ Thursday, December 1, 2011). 15 “History of Fuel Economy: One Decade of Innovation, Two Decades of Inaction,” The Pew Environment Group, April 2011. 16 Under the Clean Air Act California was allowed to set its own tighter emission standards for vehicles in recognition of the fact that it had started setting standards long before the Act’s passage in 1970. The CAFE legislation, however, explicitly ruled out state standards. Standards for carbon dioxide emissions were nominally like standards for other pollutants, such as hydrocar- bons, stated in emissions per mile, but were effectively equivalent to fuel economy standards because the only practical way to reduce carbon dioxide emissions per mile meant reducing fuel consumption per mile. 17 See full timeline of California Greenhouse Gas Waiver Request at http://www.epa.gov/otaq/climate/ca-waiver.htm, (ac- cessed October 12, 2012). Found under EPA.gov, Transportation and Air Quality, Transportation and Climate, Regulations and Standards. 18 “DOT Posts New Fuel Economy Standards for Model Year 2011 Cars and Lights Trucks,” NHTSA Press Release, March 27, 2009, http://www.nhtsa.gov/About+NHTSA/Press+Releases/2009/DO
  • 13. T+Posts+New+Fuel+Economy+Standards+for+Model+Year+201 1+Cars+and+Light+Trucks, (accessed October 11, 2012). Found Under NHTSA.gov, About NHTSA, Press Releases. This document is authorized for use only by Hameeda Lamb in Business & Economic Policy Graduate Online Fall 2018-2019 at Northwood University, 2018. http://www.nhtsa.gov/About+NHTSA/Press+Releases/2009/DO T+Posts+New+Fuel+Economy+Standards+for+Model+Year+201 1+Cars+and+Light+Trucks http://www.nhtsa.gov/About+NHTSA/Press+Releases/2009/DO T+Posts+New+Fuel+Economy+Standards+for+Model+Year+201 1+Cars+and+Light+Trucks http://www.epa.gov/otaq/climate/ca-waiver.htm HKS Case Program 5 of 16 Case Number 1973.0 2009. In September 2009, the NHTSA and EPA formally proposed new rules to implement the negotiated targets, which were made final in 2010. 19 In January 2011, the NHTSA, EPA, and the State of California announced their intent to develop coordi- nated rules for MY 2017-2025. Negotiations among the two federal agencies, the State of California, automobile manufacturers, auto industry unions, and environmental groups proceeded. In the CAFE rulemakings of 2008 and earlier years, auto manufacturers had vociferously opposed tighter
  • 14. limits and had submitted detailed technical and economic critiques against higher fuel economy standards. Having lost their effort to block action by the State of California, however, auto manufacturers were deeply concerned that without a national agreement that satisfied California, the state would set tighter standards, requiring the production of different vehicle versions for different parts of the country. The potential challenges of complying with heterogeneous emissions standards were compounded by the fact that several other states typically adopted California’s requirements. In addition, two of the “big three” manufacturers (General Motors and Chrysler) were under pressure to cooperate during negotiations because they had received “bailouts” from the federal govern- ment. Under these circumstances and in light of widespread support for energy efficiency regulations in general, and CAFE in particular, most automakers felt it necessary to agree to the more stringent fuel economy standards. On July 29, 2011, President Barack Obama, accompanied by the heads of 13 major automobile manufac- turers that accounted for 90 percent of all vehicles sold in the U.S., announced an “historic agreement” to increase the average fuel efficiency standard of cars to 54.5 mpg by the year 2025. 20 To implement the agreement and in
  • 15. keeping with federal rulemaking guidelines, the NHTSA and EPA published a “Notice of Proposed Rulemaking” (NPRM) in the Federal Register and opened it up for public comments in December 2011. Following standard prac- tice, the agencies would promulgate the final rule (possibly modified from the proposal) or withdraw the proposal after analyzing public comments and possibly conducting additional analysis. Ultimately, in August 2012, the pro- posed CAFE standards for MY 2017-2025 were adopted as the final rule. 21 Estimated Costs and Benefits of Proposed Standards for MY 2017-2025 As required by presidential orders dating back to the late 1970s, the NHTSA and EPA each issued a Regula- tory Impact Analysis (RIA) to accompany the NPRM. 22 The NHTSA’s RIA, more than 800 pages long, provided an 19 25323-25728/ Federal Register / Vol. 75, No. 88 / Friday, May 7, 2010. 20 “President Obama Announces Historic 54.5 mpg Fuel Efficiency Standard,” White House Press Release, July 29, 2011, http://www.whitehouse.gov/the-press- office/2011/07/29/president-obama-announces-historic-545- mpg-fuel-efficiency- standard, (accessed July 2, 2012), found under Whitehouse.gov,
  • 16. the Press Office. Note that mpg figures are calculated under different sets of assumptions depending on the purpose (e.g., to measure compliance under the CAFE legislation as opposed to predicting actual performance). As a result, apparent differences in mpg figures may not reflect real differences. 21 “Obama Administration Finalizes Historic 54.5 mpg Fuel Efficiency Standards,” NHTSA Press Release, August 28, 2012, http://www.nhtsa.gov/About+NHTSA/Press+Releases/2012/Oba ma+Administration+Finalizes+Historic+54.5+mpg+Fuel+Efficie n cy+Standards, (accessed October 12, 2012). Found Under NHTSA.gov, About NHTSA, Press Releases. 22 The estimates in the NPRM and the RIA were often slightly different because of differences in assumptions (and in some cas- es inadvertent errors). This case relies primarily on the RIA because NHTSA officials have informed the authors that its esti- This document is authorized for use only by Hameeda Lamb in Business & Economic Policy Graduate Online Fall 2018-2019 at Northwood University, 2018. http://www.nhtsa.gov/About+NHTSA/Press+Releases/2012/Oba ma+Administration+Finalizes+Historic+54.5+mpg+Fuel+Efficie ncy+Standards http://www.nhtsa.gov/About+NHTSA/Press+Releases/2012/Oba ma+Administration+Finalizes+Historic+54.5+mpg+Fuel+Efficie ncy+Standards http://www.whitehouse.gov/the-press- office/2011/07/29/president-obama-announces-historic-545- mpg-fuel-efficiency-standard http://www.whitehouse.gov/the-press- office/2011/07/29/president-obama-announces-historic-545-
  • 17. mpg-fuel-efficiency-standard HKS Case Program 6 of 16 Case Number 1973.0 elaborate benefit-cost analysis of the proposed rule. The agency reported estimates of costs and benefits for nine alternative sets of CAFE standards including options both less and more stringent than the proposed rule. This case reports results for the “preferred alternative” (the proposed standard). Vehicle Footprints and Fuel Economy Standards The Energy Independence and Security Act of 2007 stipulated that the NHTSA would determine fuel economy targets for new cars and trucks based on a mathematical function of vehicle “attributes”. After consider- ing various alternatives, the NHTSA decided to use a vehicle’s “footprint” (length of the vehicle multiplied by its width) as the sole attribute. The fuel economy target for a vehicle was calculated as a linear function of the foot- print, with both lower and upper cutoffs. The functions differed for cars and light trucks and rose progressively higher with each model year, thereby increasing fuel efficiency. Based on forecasts of sales of cars and light trucks by footprint, the NHTSA estimated the average fuel efficiency that would be achieved by manufacturers’ fleets
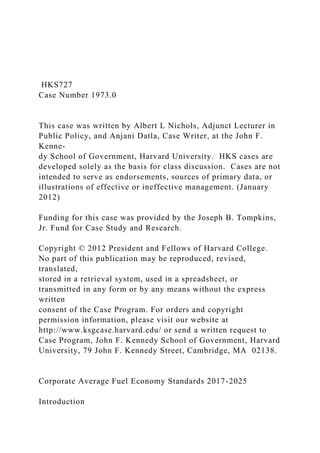
  • 18. each model year, as shown in Figure 1. Less stringent functions were specified for light trucks than for cars. The NHTSA predicted that the proposed rule would raise average fuel economy of passenger cars from 37.5 MPG in MY 2016 to 52.7 mpg in MY 2025 and save 4 billion barrels of oil over the lifetimes of the cars and light trucks sold dur- ing the CAFE program. 23 The average mpg ultimately realized for new vehicles, however, would depend on the mix of vehicles actually sold. Cost Estimates: Technology Costs The largest cost of the CAFE program was for new technologies that would increase fuel efficiency in vehi- cles manufactured between MY 2017 and MY 2025. To calculate these costs, the NHTSA identified the types of mates are intended to represent “real-world” expectations, whereas the NPRM applies some assumptions about compliance specified in the legislation that are unlikely to occur. 23 These figures are for tested mpg and do not account for the 20- 25 percent lower mpg achieved on-road. Figure 1. Estimated Fuel Efficiency Achieved by LDVs under NHTSA's Proposal for MY 2017-2025
  • 19. Note: Values are estimated mpg achieved by cars and light trucks combined based on the proposed functions and pro- jected vehicle sales. Value for 2016 reflects existing CAFE rules while those for other years reflect proposed limits. Source: 74888 Federal Register/ Vol. 76, No. 231/ Thursday, December 1, 2011. 0 10 20 30 40 50 60 A ve ra ge m pg Passenger Cars Light trucks
  • 20. Combined This document is authorized for use only by Hameeda Lamb in Business & Economic Policy Graduate Online Fall 2018-2019 at Northwood University, 2018. HKS Case Program 7 of 16 Case Number 1973.0 technologies manufacturers would likely use to improve the fuel economy of vehicles and how much they would cost. The agency assumed that manufacturers would choose the least expensive combinations of technologies needed to achieve the higher standards. The NHTSA’s cost estimates also assumed that manufacturers would not reduce safety, comfort or performance in meeting the CAFE standards. In addition to direct costs, the NHTSA also included associated indirect costs (such as research and development, corporate operations, and sales). 24 The agency’s total predicted technology costs ranged from $1.7 billion for MY 2017 to $29.9 billion for MY 2025, when the proposed standards would be most stringent. When the costs for all model years were discounted at 3 percent back to the start of MY 2017, they totaled $109 billion, as shown in the top row of Table 2. 25 Benefit Estimates
  • 21. Before estimating the overall benefits of the national program, the NHTSA had to account for the fact that increasing fuel efficiency reduced the cost per mile of driving, which provided incentives for vehicle owners to drive more. Econometric studies indicated that this increase in driving—known as the “rebound” effect—was sig- 24 The indirect cost multipliers applied to direct costs varied from 1.2 to 1.7 depending on the “complexity” of the technology and whether the analysis was for the short or long-term. 25 Table 2 numbers are based on discount rate of 3 percent. The NHTSA also provided calculations based on a discount rate of 7 percent. Table 2. Estimated Present Values of Benefits and Costs of Proposed CAFE Standards for MY 2017-2025 Based on Discount Rate of 3 Percent Notes: Entries are in billions of 2009 dollars. Entries for individual model year are discounted (at 3 percent) to the beginning of the model year. The “Total” column is the sum of the values for individual model years discounted (at 3 percent) back to the start of MY 2017. Parentheses indicate negative benefits (costs rather than benefits from rule). “Lifetime fuel expenditures (pretax)” do not include a reduction in the present value total tax payments of about $39.2 billion. Source: Adapted from Preliminary Regulatory Impact Analysis:
  • 22. Corporate Average Fuel Economy for MY 2017-2025 Passen- ger Cars and Light Trucks, Department of Transportation, National Highway Traffic Safety Administration, Table 13, http://www.nhtsa.gov/fuel-economy, (accessed May 1, 2012). Component 2017 … 2025 Total Technology costs $1.7 $29.9 $108.9 Benefits (other costs) Li feti me fuel expendi tures (pretax) $7.1 $86.5 $345.3 Cons umer s urpl us from addi ti onal dri vi ng $0.1 $2.6 $7.4 Refuel i ng ti me val ue $0.4 $2.6 $12.8 Petrol eum market external i ti es $0.4 $4.4 $17.9 CO2 reducti ons $0.7 $9.7 $37.8 Reducti ons i n "conventi onal " pol l utants $0.3 $2.5 $11.1 Increas ed conges ti on, acci dents and noi s e ($0.8) ($9.2) ($37.2) Subtotal $8.1 $99.0 $395.0 Net total benefits $6.3 $69.1 $286.0 Present Values ($billions) This document is authorized for use only by Hameeda Lamb in Business & Economic Policy Graduate Online Fall 2018-2019 at Northwood University, 2018. http://www.nhtsa.gov/fuel-economy HKS Case Program 8 of 16 Case Number 1973.0 nificant, though its magnitude was uncertain. 26 The NHTSA, based on research presented in these studies, assumed
  • 23. that the elasticity of miles driven with respect to the cost of fuel per mile was -0.1; for example, if fuel economy doubled, thus reducing fuel cost per mile by 50 percent, vehicles would be driven 5 percent more miles per year. Savings in Fuel Expenditures The single biggest estimated benefit of the national program was reduction in fuel costs. The NHTSA’s cal- culations of fuel savings reflected both the rebound effect and the fact that real-world fuel economy was approxi- mately 20 percent less than the official stated mpg. The agency used estimates of miles traveled and survival rates by vehicles of different ages to determine fuel savings over the lifetimes of vehicles sold in each model year. 27 Us- ing projected fuel prices from the Department of Energy, the NHTSA valued the reductions in fuel use and dis- counted the savings back to the time of original sale. 28As shown in Table 2, the NHTSA estimated that vehicle own- ers would save nearly $345 billion in the present value of fuel expenditures over the lifetime of vehicles purchased between 2017 and 2025—more than three times the estimated technology costs. Moreover, the reduction in fuel costs shown did not include savings of approximately $39.2 billion in fuel taxes because that additional benefit to
  • 24. vehicle owners would be offset by equal losses in tax revenues to federal, state, and local governments. Other Benefits for Vehicle Owners The NHTSA used the concept of consumer surplus to gauge how much value drivers would gain from the extra miles driven as a result of the rebound effect. The personal benefit of additional driving was estimated at $7.5 billion. In addition, with higher fuel economy, vehicles would be able to travel further on the same fuel-tank capacity. The agency predicted that fewer refuels would save drivers time and the cost of driving off course to find a fuel station. The cumulative savings for consumers both while searching for fuel stations and at the pump would amount to $13 billion. Petroleum Market Impacts The CAFE program was expected to have wider social consequences than those experienced by vehicle owners and manufacturers. The NHTSA believed that higher fuel efficiency would lower consumption of oil and decrease U.S. petroleum imports. Given that the U.S. imported nearly half of the petroleum it consumed in 2010, the proposed CAFE standard could help make the country more resilient to unexpected price hikes in international
  • 25. petroleum markets, which disrupted the macroeconomy. 29 Based on an updated analysis by a team of researchers at Oak Ridge National Laboratory, the NHTSA used a benefit of approximately $13 per barrel reduction in imported 26 “Preliminary Regulatory Impact Analysis: Corporate Average Fuel Economy for MY 2017-2025 Passenger Cars and Light Trucks,” Department of Transportation, National Highway Traffic Safety Administration, pp. 613-620. 27 As vehicles age, they are driven fewer miles and more and more of them are junked or destroyed in accidents, resulting in declining survival rates. 28 For passenger cars, the NHTSA assumed a maximum lifetime of 26 years so that the fuel savings for cars manufactured in MY 2025 included savings till 2051. Because light trucks typically lasted longer, the NHTSA conducted the analysis for a lifetime of 42 years, or to 2077 for trucks cars manufactured in MY 2025 29 “Draft Joint Technical Support Document,” Proposed Rulemaking for 2017-2025 Light Duty Vehicle Greenhouse Gas Emission Standards and Corporate Average Fuel Economy Standards, EPA and NHTSA, pp. 4-29. This document is authorized for use only by Hameeda Lamb in Business & Economic Policy Graduate Online Fall 2018-2019 at Northwood University, 2018. HKS Case Program 9 of 16 Case Number 1973.0 oil.30 The total petroleum market external benefits for the
  • 26. duration of the program were estimated at approxi- mately $18 billion. Environmental Benefits Lower fuel consumption also reduced environmental pollution, which in turn would yield health and eco- logical benefits. The NHTSA estimated reductions in damages from two types of pollutants, carbon dioxide and “criteria” pollutants. For carbon dioxide, the agency used findings from an interagency working group that had been explicitly created to develop estimates of the value of reductions in carbon dioxide emissions for use by fed- eral regulatory agencies. 31 The working group’s estimates varied depending on certain assumptions but had a “cen- tral value” of $22 per metric ton in 2009 dollars. This value used a 3 percent discount rate and included damages worldwide. 32 The program’s estimated benefit in reduced carbon pollution was nearly $38 billion. The proposed rule was also expected to reduce emissions of “criteria” pollutants associated with ozone, fine particles and other ambient pollutants regulated by air- quality standards under the Clean Air Act. Higher fuel economy would reduce demand for fuel, which would in turn reduce emissions associated with fuel production
  • 27. and distribution (for example, combustion of oil to generate heat used in refining processes). The fuel economy standard would not affect tailpipe emissions of criteria pollutants from vehicles directly because vehicle emission standards were stated per mile, not per gallon of fuel. The rebound effect, however, would increase miles driven and thereby increase tailpipe emissions, eating into the net reductions in criteria pollutants. The NHTSA valued the net reductions using the same estimates of damages per ton adopted by the EPA in rulemakings concerning these criteria pollutants. Virtually all of the monetized benefits were for reduced fatalities associated with fine particles. 33 30 "Preliminary Regulatory Impact Analysis: Corporate Average Fuel Economy for MY 2017-2025 Passenger Cars and Light Trucks,” Department of Transportation, National Highway Traffic Safety Administration, p. 647. The NHTSA did not include two other types of potential benefits associated with reduced oil imports. The first of these was based on the notion that reduced oil imports would reduce military expenditures. However, the NHTSA, like other agencies, judged the evidence to support such an effect to be inadequate. The second type of benefit the NHTSA rejected was the “monopsony” effect. Based on the notion that if the United States, a large enough consumer, reduced its demand, the world price of oil would be driven down. This ef- fect had been included in some other federal analyses. Gains to net importers (such as the United States), however, would be
  • 28. offset by losses to net exporters. In its analysis of damages from carbon dioxide emissions, the NHTSA had adopted a global perspective that weighted damages the same regardless of where they occurred. It would have been inconsistent to count mo- nopsony benefits in the United States but not offsetting losses elsewhere in the world. 31 “Technical Support Document: Social Cost of Carbon for Regulatory Impact Analysis – Under Executive Order 12866,” Inter- agency Working Group on Social Cost of Carbon, United States Government, February 2010, http://www.epa.gov/oms/climate/regulations/scc-tsd.pdf, (accessed May 22, 2012). 32 If the value were limited to effects in the United States, which is common practice in benefit-cost analyses of proposed feder- al regulations, it would be only 7 to 23 percent as large, depending on the method used to scale down the global damages to U.S.-only values. Ibid., p. 11. 33 Fine particles are emitted directly and are formed in the atmosphere from reactions involving other pollutants (such as sulfur and nitrogen oxides). This document is authorized for use only by Hameeda Lamb in Business & Economic Policy Graduate Online Fall 2018-2019 at Northwood University, 2018. http://www.epa.gov/oms/climate/regulations/scc-tsd.pdf HKS Case Program 10 of 16 Case Number 1973.0 The EPA valued changes in direct emissions of fine particles at $300,000 per ton. 34 The estimated total benefit from
  • 29. lowered emissions of criteria pollutants was $11 billion. Costs of Increased Accidents, Congestion and Noise due to Rebound Effect Finally, the NHTSA also recognized that the increased driving associated with the rebound effect would have negative impacts such as damages associated with greater accidents, congestion, and noise, all of which were functions of miles driven rather than fuel consumption. 35 The costs of increased accidents, congestion, and noise were valued at $37 billion. Summary of Social Costs and Benefits The NHTSA’s detailed benefit-cost analysis indicated that between 2017 and 2025, the $432 billion in benefits accrued from the new fuel economy standard would dwarf the $109 billion in technology costs by more than $323 billion (as shown in Table 2). The estimated net benefits were dominated by savings in fuel costs. For the consumer, these savings would vastly outweigh the anticipated costs in higher vehicle prices. Why Does the Market Fail to Provide More Fuel Efficient Cars? Following common practice in benefit-cost analyses, the NHTSA’s primary analysis did not consider the distribution of costs and benefits among different parties. In a
  • 30. relatively short section toward the end of the RIA, however, the NHTSA reported on an analysis of costs and benefits from the perspective of vehicle owners. Table 3 summarizes that analysis. Under the program, vehicle owners would receive savings in fuel expenditures (including lower payments of fuel taxes, which were not included in the social benefit-cost analysis), savings in refueling time, and the consumer surplus from additional driving. Vehicle owners would also bear the technology costs. The NHTSA estimated that those costs were only slightly more than one-quarter of the private benefits, leaving large net benefits from the perspective of individual vehicle owners. NHTSA analysts recognized that these findings presented an apparent paradox that merited some discussion. If there were large net gains for vehicle owners (and for manufacturers who better met buyers’ preferences) from vehicles with higher mpg, why was the market not generating more fuel- efficient vehicles on its own? The NHTSA asked the following questions in the regulatory impact analysis: Assuming these comparisons [of private costs and benefits] are accurate, they raise the question of why current vehicle purchasing patterns do not result in average fuel econ-
  • 31. omy levels approaching those that this rule would require, and why stricter CAFE stand- ards should be necessary to increase the fuel economy of new cars and light trucks.… More specifically, why would potential buyers of new vehicles hesitate to make invest- 34 “Preliminary Regulatory Impact Analysis: Corporate Average Fuel Economy for MY 2017-2025 Passenger Cars and Light Trucks,” Department of Transportation, National Highway Traffic Safety Administration, Table VIII-16. 35 The NHTSA’s estimates for accidents were limited to damages and injuries suffered by the occupants of other vehicles or pedestrians under the assumption that driving decisions by individual owners already reflect the costs borne by the vehicle’s own occupants. This document is authorized for use only by Hameeda Lamb in Business & Economic Policy Graduate Online Fall 2018-2019 at Northwood University, 2018. HKS Case Program 11 of 16 Case Number 1973.0 ments in vehicles with higher fuel economy that would produce the substantial econom- ic returns? And why would manufacturers voluntarily forego opportunities to increase
  • 32. the attractiveness, value, and competitive positioning of their car and light truck models by improving their fuel economy? 36 The NHTSA proceeded to offer several potential reasons for this paradox, including what it called “stand- ard market failures” and inconsistencies in consumer behavior patterns that could be explained by behavioral eco- nomics. 37 1. The agency acknowledged that the underlying assumptions it used to estimate the economic impacts of the program might not be in line with consumers’ evaluations of the costs and benefits of higher mpg. For instance, vehicle buyers might discount future fuel savings at a greater rate than used by the agency. In its explanation, the NHTSA noted that, “combinations of a shorter time horizon or higher discount rate could reduce or even eliminate the difference between the value of fuel savings and the agency’s estimates of increase in vehicle prices.” 2. The NHTSA recognized the possibility that its estimates of the costs of incorporating fuel efficient tech- nologies were too low, and did not adequately reflect the full costs of preserving other vehicle features
  • 33. (such as safety or performance) while improving fuel efficiency. 36 “Preliminary Regulatory Impact Analysis: Corporate Average Fuel Economy for MY 2017-2025 Passenger Cars and Light Trucks,” Department of Transportation, National Highway Traffic Safety Administration, p. 699. 37 The summaries below are derived from discussion in ibid., pp. 699-723. Table 3. Benefits and Costs from the Perspective of Vehicle Owners Notes: Entries are in billions of 2009 dollars. Entries for individual model year are discounted sum (at 3 percent) over lifetimes of vehicles sold in that model year. Entries for “Total” are further discounted to MY 2017 and summed across model years. Parentheses indicate negative values (costs rather than benefits from rule). Source: Values for individual components from Table 2. Classification of “private costs and benefits” adapted from Prelimi- nary Regulatory Impact Analysis: Corporate Average Fuel Economy for MY 2017-2025 Passenger Cars and Light Trucks, Department of Transportation, National Highway Traffic Safety Administration, Table VIII-27. Component 2017 … 2025 Total
  • 34. Technology costs $1.7 $29.9 $108.9 Benefits (other costs) Li feti me fuel expendi tures (i ncl udi ng tax) $8.0 … $96.1 $384.5 Cons umer s urpl us from addi ti onal dri vi ng $0.1 $2.6 $7.4 Refuel i ng ti me val ue $0.4 $2.6 $12.8 Subtotal benefi ts (other cos ts ) $8.4 $101.2 $404.7 Net total benefits $6.7 $71.3 $295.7 Present Values ($billions) This document is authorized for use only by Hameeda Lamb in Business & Economic Policy Graduate Online Fall 2018-2019 at Northwood University, 2018. HKS Case Program 12 of 16 Case Number 1973.0 3. Improvements in fuel efficiency could be used to increase MPG or to yield improvements in other attrib- utes, such as better performance or larger vehicles. Consumers may prefer cars that use technology im- provements to achieve better performance (e.g. engines with higher horsepower) or more room, not just higher MPG. 38 4. In the face of uncertainty about future fuel prices, the NHTSA suggested that buyers might exhibit “loss aversion,” a tendency to give much more weight to potential losses than to potential gains. Faced with
  • 35. uncertainty about future fuel prices and hence savings, vehicle buyers might give too much weight to the scenarios in which low prices led to net losses from spending more on fuel-efficient vehicles. 39 5. Imperfect competition among manufacturers could reduce their incentives to supply vehicle attributes for which consumers were willing to pay. For example, the NHTSA considered the likelihood that manufac- turers intentionally did not invest in fuel-efficient technologies for larger vehicles such as minivans and SUVs because they believed that prospective consumers were unlikely to pay more for higher fuel econ- omy in this vehicle range. 6. The NHTSA also suggested that the market for vehicle fuel economy might not work efficiently because buyers lacked sufficient information on the fuel efficiency of vehicles, or had difficulty comparing ongoing fuel-cost savings with higher upfront prices, reducing their willingness to pay for greater mpg. 40 After discussing these possible explanations, the agency concluded that: [NHTSA]- has been unable to reach a conclusive answer to the question of why the ap- parently large differences between its estimates of benefits from
  • 36. requiring higher fuel economy and the costs of supplying it do not result in higher average fuel economy for new cars and light trucks. 41 38 An article published in 2011 estimated that if horsepower, weight and torque had remained at their 1980 levels, fuel econo- my would have increased by 60 percent, rather than the 15 percent actually experienced between 1980 and 2006. Christopher R. Knittel, “Automobiles on Steroids: Product Attribute Trade- Offs and Technological Progress in the Automobile Sector,” Amer- ican Economic Review, 101, (December 2011). 39 Studies by behavioral economists indicate that individuals generally give much higher weight to potential losses than to po- tential gains. 40 Manufacturers had been required from the start of CAFE to post fuel-economy information on labels placed in the windows of all new cars. The EPA had revised the specifications of those labels for MY 2008 and had already established new require- ments to start with MY 2013 (see Exhibit A). 41 “Preliminary Regulatory Impact Analysis: Corporate Average Fuel Economy for MY 2017-2025 Passenger Cars and Light Trucks,” Department of Transportation, National Highway Traffic Safety Administration, p. 711. This document is authorized for use only by Hameeda Lamb in Business & Economic Policy Graduate Online Fall 2018-2019 at
  • 37. Northwood University, 2018. HKS Case Program 13 of 16 Case Number 1973.0 Exhibit A. Comparison of Current and New EPA-Required Window Stickers for New Cars Note: Labels must be displayed in the windows of new cars. Actual size of label is a minimum of 7” x 4.5”(40 CFR 600.307- 08, “Fuel economy label format requirements”). Sticker for Model Years 2008-2012 Sticker for Model Years 2013-: Source: 2008-2012 sticker from http://www.fueleconomy.gov/feg/ratingsnewsticker.shtml, (accessed October 10, 2012), found under Fueleconomy.gov, About EPA Ratings. 2013 and beyond sticker from http://www.fueleconomy.gov/feg/Find.do?action=bt1, (accessed October 10, 2012), found under Fuelecono- my.gov, About EPA Ratings. This document is authorized for use only by Hameeda Lamb in Business & Economic Policy Graduate Online Fall 2018-2019 at Northwood University, 2018. http://www.fueleconomy.gov/feg/Find.do?action=bt1
  • 38. http://www.fueleconomy.gov/feg/ratingsnewsticker.shtml HKS Case Program 14 of 16 Case Number 1973.0 Appendix 1. Discounting and Present Values When costs and benefits occur over multiple years, it is standard practice to “discount” values for the var- ious years to a common year (often the start of the project in question). The sum of these discounted values is their present value. For readers of the case who are not familiar with discounting, this appendix provides a very brief overview of the mechanics of and rationales for discounting. Rationale for and Mechanics of Discounting The basic rationale for discounting is that benefits received now are more valuable than those received later. Conversely, it is generally better to incur costs later rather than earlier. That is because there is an opportuni- ty cost to spending money now, rather than investing it for later. Even when the funds would not otherwise be invested, but rather would be consumed now, there is an opportunity cost because people generally prefer con- sumption now to consumption later (as witness the many people
  • 39. who take on debt through credit cards and other forms of borrowing). Suppose the opportunity cost of funds is that it could be invested at an interest rate of r. Thus, $1 invest- ed today will grow to $(1+r) next year, $(1+r)2 in two years, and so forth. Alternatively, if you needed to spend $1 in two years, you would have to invest only $1/(1+r)2 today, because it would grow to $1 in two years. Assume we have a stream of benefits and costs, where Bt are Ct are the values in year t. The net benefits in a given year are Nt = Bt – Ct. If the benefits and/or costs happen “now” and then over a period of T years, the Net Present Value (NPV) of that stream is: T T r N r N r N NNPV )1(
  • 40. ... )1(1 2 21 0 + ++ + + + += . If the analysis is done in constant rather than nominal dollars, as most benefit-costs analyses are, the discount rate used should be a real one (net of inflation). For example, if the relevant nominal rate is 10 percent and inflation is expected to be 2 percent, the corresponding real discount rate is a little less than 8 percent. 42 For example, suppose the extra cost of a car under a proposed rule is $500, but it yields savings of $70 per year over the next 10 years. Thus, the annual cash flow is -$500 in year 0 and +$70 for each of the next 10 years. The total savings will be $700 compared to costs of $500, but the costs are incurred now and the benefits are re- ceived later. Simply adding up the costs and benefits over time
  • 41. implicitly uses a zero discount rate. With a positive discount rate, the present value of benefits may not exceed costs. 42 Strictly speaking, if the relevant nominal interest rate is n and the inflation rate is i, the corresponding real rate is 1 1 1 − + + = i n r . For n = 10% and i =2%, r = 0.078. = 7.8%, slightly less than the 8% we get by subtracting the inflation rate from the nominal in- terest rate. This document is authorized for use only by Hameeda Lamb in Business & Economic Policy Graduate Online Fall 2018-2019 at Northwood University, 2018. HKS Case Program 15 of 16 Case Number 1973.0 Choice of Discount Rate
  • 42. If the temporal distributions of costs and benefits differ substantially, the discount rate used to compute present values can have a very large impact on whether a project yields positive or negative estimated net bene- fits. For example, at a discount rate of 7 percent, $1 received each year for 10 years is equivalent to $7.02 received now. At a discount rate of 3%, the present value is significantly higher at $8.58. However, at 12 percent, the pre- sent value is only $5.65. The discount rate(s) used to calculate present values for government projects or regulations have been the subject of considerable controversy over many years. The Office of Management and Budget (OMB), which reviews RIAs and issues guidelines for conducting them, recommends that agencies report results for rates of both 7 percent and 3 percent. 43 According to OMB, the higher rate reflects estimates of the long-term average real re- turn on private capital in the U.S. economy (before taxes). The lower rate reflects the lower after-tax average re- turns that investors have received over the long-term. 44 43 “Circular A-4 Regulatory Analysis,” Guidelines and Discount Rates for Benefit-Cost Analysis of Federal Programs,” Office of
  • 43. Management and Budget, September 17, 2003, http://www.whitehouse.gov/sites/default/files/omb/assets/regula tory_matters_pdf/a-4.pdf, (accessed August 24, 2012). 44 After-tax rates of return are reduced from pre-tax rates by corporate and individual income taxes at the federal, state, and local levels. This document is authorized for use only by Hameeda Lamb in Business & Economic Policy Graduate Online Fall 2018-2019 at Northwood University, 2018. http://www.whitehouse.gov/sites/default/files/omb/assets/regula tory_matters_pdf/a-4.pdf HKS Case Program 16 of 16 Case Number 1973.0 Appendix 2. Harmonic Means Used to Compute Average MPG The average mpg for a group of vehicles is computed using a harmonic mean rather than a regular arith- metic mean. The arithmetic mean of mpgs implicitly assumes that each vehicle uses the same amount of gasoline per year. It is much more plausible to think that vehicles will drive the same numbers of miles per year (before accounting for the rebound effect). Suppose we have two cars, one that gets m1 mpg and one that gets m2 mpg. The arithmetic mean of those two numbers is:
  • 44. . 2 21 mmmeanArithmetic += In contrast, the harmonic mean is: += 2/ 11 /1 21 mm meanHarmonic
  • 45. To see the difference, consider an example where the two cars get 10 and 40 mpg, respectively. The arithmetic mean is 25 mpg. However, the harmonic mean is much lower: 16]2/)40/110/1/[(1 =+ . To see why the harmonic mean is a more useful measure in this context, suppose each car travels 10,000 miles per year. Total consumption of fuel will be 10,000/10 + 10,000/40 = 1,000 + 250 = 1,250 gallons. Because they travel a combined 20,000 miles, their average mpg will be 20,000/1,250 = 16 mpg, the harmonic mean of 10 and 40 mpg. In Europe, fuel efficiency is measured in liters/100 km and a smaller number means greater fuel efficien- cy. When the measure is fuel volume per distance traveled, a simple sales-weighted average gives the correct overall average for a fleet of vehicles. For example, if we converted our mpg figures to gallons/100 miles they would be 10 gallons per 100 miles and 2.5 gallons per 100 miles. Their simple average would be (10 + 2.5)/2 = 6.25 gallons per 100 miles, which is equivalent to 100/6.25 = 16 mpg. The use of mpg can also confuse one’s intuition about the relative impacts of changes in fuel economy. For example, suppose we increase fuel economy for vehicle 1 (a minivan) from 15 mpg to 20 mpg and for vehicle 2
  • 46. (a small size sedan) from 30 to 60 mpg. Which change saves more fuel? It is tempting to say vehicle 2, where we have increase fuel economy by 30 mpg compared to only 5 mpg for vehicle 1. Moreover, for vehicle 1 the percent- age improvement is only 33 percent, compared to 100 percent for vehicle 2. However, if we work out the actual savings in fuel consumption if each vehicle travels 10,000 miles per year, they are exactly the same: Vehicle 1: 10,000 miles/15mpg – 10,000 miles/20mpg = 667 gallons - 500 gallons = 167 gallons Vehicle 2: 10,000 miles/30mpg – 10,000 miles/60mpg = 333 gallons – 167 gallons = 167 gallons. As this example illustrates, increasing mpg is much more valuable when the base is low than when it is relatively high. This document is authorized for use only by Hameeda Lamb in Business & Economic Policy Graduate Online Fall 2018-2019 at Northwood University, 2018. Corporate Average Fuel Economy Standards 2017-2025Exhibit A. Comparison of Current and New EPA-Required Window Stickers for New CarsAppendix 1. Discounting and Present Values Principles of Business Management Week 5 Assignment
  • 47. Motivation Research and discuss the basic theories of motivation as well as a description of what they are. The requirements below must be met for your paper to be accepted and graded: – 750 words (approximately 2 – 3 pages) using Microsoft Word. from references. st two references from outside the course material, preferably from EBSCOhost. Text book, lectures, and other materials in the course may be used, but are not counted toward the two reference requirement. Reference material (data, dates, graphs, quotes, paraphrased words, values, etc.) must
  • 48. be identified in the paper and listed on a reference page. Reference material (data, dates, graphs, quotes, paraphrased words, values, etc.) must come from sources such as, scholarly journals found in EBSCOhost, online newspapers such as The Wall Street Journal, government websites, etc. Sources such as Wikis, Yahoo Answers, eHow, etc. are not acceptable.