
Recommended
Recommended
More Related Content
Similar to See figure 18-14- which summarizes hypotheses for why species richness.pdf
Similar to See figure 18-14- which summarizes hypotheses for why species richness.pdf (20)
More from 3galokelectricalspvt
More from 3galokelectricalspvt (20)
Recently uploaded
Recently uploaded (20)
See figure 18-14- which summarizes hypotheses for why species richness.pdf
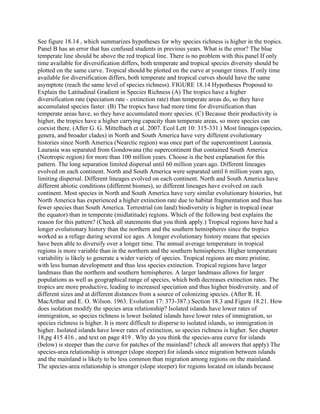
- 1. See figure 18.14 , which summarizes hypotheses for why species richness is higher in the tropics. Panel B has an error that has confused students in previous years. What is the error? The blue temperate line should be above the red tropical line. There is no problem with this panel If only time available for diversification differs, both temperate and tropical species diversity should be plotted on the same curve. Tropical should be plotted on the curve at younger times. If only time available for diversification differs, both temperate and tropical curves should have the same asymptote (reach the same level of species richness). FIGURE 18.14 Hypotheses Proposed to Explain the Latitudinal Gradient in Species Richness (A) The tropics have a higher diversification rate (speciation rate - extinction rate) than temperate areas do, so they have accumulated species faster. (B) The tropics have had more time for diversification than temperate areas have, so they have accumulated more species. (C) Because their productivity is higher, the tropics have a higher carrying capacity than temperate areas, so more species can coexist there. (After G. G. Mittelbach et al. 2007. Ecol Lett 10: 315-331.) Most lineages (species, genera, and broader clades) in North and South America have very different evolutionary histories since North America (Nearctic region) was once part of the supercontinent Laurasia. Laurasia was separated from Gondowana (the supercontinent that contained South America (Neotropic region) for more than 100 million years. Choose is the best explanation for this pattern. The long separation limited dispersal until 60 million years ago. Different lineages evolved on each continent. North and South America were separated until 6 million years ago, limiting dispersal. Different lineages evolved on each continent. North and South America have different abiotic conditions (different biomes), so different lineages have evolved on each continent. Most species in North and South America have very similar evolutionary histories, but North America has experienced a higher extinction rate due to habitat fragmentation and thus has fewer species than South America. Terrestrial (on land) biodiversity is higher in tropical (near the equator) than in temperate (midlatitude) regions. Which of the following best explains the reason for this pattern? (Check all statements that you think apply.) Tropical regions have had a longer evolutionary history than the northern and the southern hemispheres since the tropics worked as a refuge during several ice ages. A longer evolutionary history means that species have been able to diversify over a longer time. The annual average temperature in tropical regions is more variable than in the northern and the southern hemispheres. Higher temperature variability is likely to generate a wider variety of species. Tropical regions are more pristine, with less human development and thus less species extinction. Tropical regions have larger landmass than the northern and southern hemispheres. A larger landmass allows for larger populations as well as geographical range of species, which both decreases extinction rates. The tropics are more productive, leading to increased speciation and thus higher biodiversity. and of different sizes and at different distances from a source of colonizing species. (After R. H. MacArthur and E. O. Wilson. 1963. Evolution 17: 373-387.) Section 18.3 and Figure 18.21. How does isolation modify the species area relationship? Isolated islands have lower rates of immigration, so species richness is lower Isolated islands have lower rates of immigration, so species richness is higher. It is more difficult to disperse to isolated islands, so immigration in higher. Isolated islands have lower rates of extinction, so species richness is higher. See chapter 18,pg 415 416 , and text on page 419 . Why do you think the species-area curve for islands (below) is steeper than the curve for patches of the mainland? (check all answers that apply) The species-area relationship is stronger (slope steeper) for islands since migration between islands and the mainland is likely to be less common than migration among regions on the mainland. The species-area relationship is stronger (slope steeper) for regions located on islands because
- 2. migration among regions on the mainland (red points) is likely to be more common than migration between islands, or between the mainland and islands (blue points). There is a greater rate of increase in species richness with area sampled on islands than on mainland. There is a greater rate of increase in species richness with area sampled on the mainland than on islands. FIGURE 18.18 The Species-Area Relationship The first species-area curve, for British plants, was constructed by H. C. Watson in 1859. (After M. Rosenzweig. 1995. Species Diversity in Space and Time. Cambridge University Press: Cambridge; based on data in C. B. Williams. 1964. Patterns in the Balance of Nature. Academic Press: London; H. C. Watson. 1859. Cybele Britannica: or British Plants and Their Geographical Relations 4: 379. Longman and Company: United Kingdom.) Species area relationships are often plotted in log-log space (area and species richness are log transformed). The logarithm is generally base 10 , so you can convert back to species richness by using 1 0 x , where x is the Log number of species. See figure 18.18. How many plant species are in Surrey? See Analyzing data 18.1 for more practice. Which of the following are true of the results of the biological dynamics of forest fragments project? Select all that apply. Large fragments of forest ( 100 ha) prevented species losses. The size of habitat patches does not influence species richness biological dynamics of forest fragments project shows that most of the forest fragments created by human activities are too small to sustain biodiversity in the Amazon. Animals in the Amazon can easily migrate into forest patches The equilibrium theory of island biogeography mostly considers which two factors as the determinants of species richness? dispersal stochasticty diversification abiotic requirements biotic interactions equilibrium number predicted by MacArthur and Wilson's theory. Turnover, however, was five times higher than the theory had predicted. (C after R. H. MacArthur and E. O. Wilson. 1963. Evolution 17:373-387; based on data from K. W. Dammerman. 1948. The Fauna of Krakatau: 1883-1933. Noord-Hollandsche Uitg.-Mig.) Diversity increased from 1908 to 1934 because of immigration. By 1934, the species richness of birds on Krakatau had reached equilibriun Diversity of birds stayed pretty much the same from 1921 to 1934 All of same bird species were present in 1921 and 1934 See Ch 18. Case study (pg 418-419). Which of the following are consequences of humans creating island-like habitat patches that threaten biodiversity? (Select all that apply.) Some species that evolved in continguous habitat have poor ability to disperse between habitat islands. Habitat fragmentation reduces overall habitat area, so fewer individuals can be supported. Edge effects increase the prevalence of hazards such as fire, disease in habitat fragments. Habitat fragments usually continue to grow in size (recover) as species disperse away from forest edges.