Genome Informatics 2016 poster
•
0 likes•125 views

Identifying Structural Variation, component issues, and other sequence artifacts by integrating long range genome maps in a web-based genome browser.
Recommended

Recommended
More Related Content
Similar to Genome Informatics 2016 poster
Similar to Genome Informatics 2016 poster (20)
Recently uploaded
Recently uploaded (20)
Genome Informatics 2016 poster
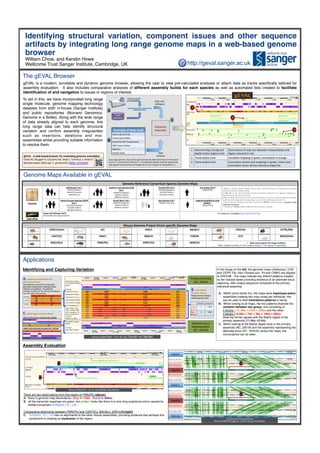
- 1. Identifying structural variation, component issues and other sequence artifacts by integrating long range genome maps in a web-based genome browser William Chow, and Kerstin Howe Wellcome Trust Sanger Institute, Cambridge, UK. Applications Identifying and Capturing Variation The Ashkenazim and CHS trio maps were generated using Bionano Haplotype Aware so;ware (unpublished). The poten@al inheritance paBern of the child can be deduced from the maps of the parents. Primary Assembly (NC_00018) Alternate Locus Representa@on (NT_187618) There are two nickase labeled groups seen. # blocks Total size Orange blocks 2 ~32kb Red blocks 4 ~38kb Allele 1 with Primary Assembly (NC_00018) Allele 2 with Alternate Assembly (NT_187618) Human (GRCh38) – Chr 18: 43,724,697-43,768,880 CAST/EiJ BALB/cJ GRCm38 PWK/PhJ PWK/PhJ Mouse (PWK/PhJ) – Chr 8: 106,309,962-‐106,509,961 Assembly Evaluation There are two observations from this region of PWK/PhJ (above): A. there is genome map discordance. (Mapà~10kb. BspQIà~60kb) B. all the transcript mappings are green, but pmfbp1 looks like there is a very long suspicious intron caused by middle component ScRybd3_121_120. Comparative alignments between PWK/PhJ and CAST/EiJ, BALB/cJ, GRCm38 (right): C. ScRybd3_121_120 has no alignments to the other mouse assemblies, providing evidence that perhaps this component is creating an expansion of the region. C CB A Compara@ve Assembly View: Mouse (PWK/PhJ) against 3 other Mouse Assemblies The gEVAL Browser gEVAL is a modern, scrollable and dynamic genome browser, allowing the user to view pre-calculated analyses or attach data as tracks specifically tailored for assembly evaluation. It also includes comparative analyses of different assembly builds for each species as well as automated lists created to facilitate identification of and navigation to issues or regions of interest. Public Repository DENOVO ASSEMBLY CONSENSUS MAPS Example of data used Clone Library Ends Transcripts/cDNAs Assembly Self Comparisons GRC Issues tracker Markers Pacbio reads Align with RefAligner Align Datasets Long range genome maps either generated by the Irys Instrument or from public sources (A) and genomic datasets (B) are aligned/mapped using the appropriate tools against the assembly and loaded into to the browser for visualiza@on (C). A B C 1 Genome Map Con@g and BspQI Insilico Digest track Discordance of map size between nickase/labels and digest coloured in red. 2 Transcript(s) track Complete mapping in green, incomplete in orange. 3 Clone end(s) track Concordant paired end mappings in green, insert size/ orienta@on issues will be colored orange/red. 1 2 3 Mouse Genome Project Strain-‐specific Genome Maps 129S1/SvImJ A/J AKR/J BALB/cJ C3H/HeJ C57BL/6NJ CAST/EiJ CBA/J DBA/2J FVB/NJ LP/J NOD/ShiLtJ NZO/HiLtJ PWK/PhJ SPRET/EiJ WSB/EiJ • Maps Generated by the Sanger Ins[tute. Mice Images courtesy of JAX creative division, The Jackson Laboratory Genome Reference Consor[um Species Genome Maps Human Ashkenazim Trio † NA24149 (father) NA24143 (mother) NA24385 (son) Southern Han Chinese (CHS) Trio ¤ HG00514 (daughter) HG00512 (father) HG00513 (mother) Yoruba (YRI) Trio ¤ NA19240 (daughter) NA19239 (father) NA19238 (mother) Yan Huang (YH) § PRJNA42199 † Zook, J., et al. Extensive sequencing of seven human genomes to characterize benchmark reference materials. BioRxiv (2015) ‡ Mak AC et al. Genome-‐Wide Structural Varia@on Detec@on by Genome Mapping on Nanochannel Arrays Gene@cs (2015) § Cao, H., et al. Rapid Detec@on of Structural Varia@on in a Human Genome using Nanochannel-‐ based Genome Mapping Technology. Giga Science (2014); 3(December 2014): 34 ¤ Human Genome Structural Varia@on Consor@um (HGSV) |1000 Genomes. Currently Under Publica[on Embargo. ^ Courtesy of T.Graves (MGI), E.Lam (Bionano Genomics). (2014) Central Europe Hapmap (CEPH) Trio ‡ NA12878 (daughter) NA12891 (father) NA12892 (mother) Puerto Rican Trio ¤ HG00733 (daughter) HG00731 (father) HG00732 (mother) Han Chinese Trio † NA24631 (son only) Haploid Hyda[dform mole (CHM1) ^ PRJNA176729 Zebrafish Sanger AB Tübingen (SAT) Generated by the Sanger Ins@tute A Trackhub is available:h,p://bit.ly/25b7Tqg Genome Maps Available in gEVAL To aid in this, we have incorporated long range single molecule, genome mapping technology datasets from both in-house (Sanger Institute) and public repositories (Bionano Genomics, Genome in a Bottle). Along with the wide range of data already aligned to each genome, this long range data can help identify structural variation and confirm assembly irregularities such as insertions, deletions and mis- assemblies whilst providing suitable information to resolve them. In the image on the left, the genome maps (Ashkenazi, CHS and CEPH Trio, Han Chinese son, YH and CHM1) are aligned to GRCh38. The maps indicate two distinct patterns created by the nickase labels providing evidence of an alternate locus capturing ~6kb unique sequence compared to the primary reference assembly. A. Within some family trio, the maps were haplotype-aware assembled creating two map contig per individual, this can be used to illicit inheritance patterns in family. B. When looking at all maps, the two patterns illustrate the variation between two group, one consisting of 2 blocks (~11.8kb + 21kb = 32kb) and the other, 4 blocks (~9.8kb + 7kb + 3kb + 18kb = 38kb). Note the former agrees with the BspQI digest of the primary assembly (11.8kb +21kb). C. When looking at the BspQI digest track in the primary assembly (NC_00018) and the assembly representing the alternate locus (NT_187618) versus the maps, the concordance can be seen. gEVAL -‐ A web based browser for evalua[ng genome assemblies Chow W, Brugger K, Caccamo M, Sealy I, Torrance J, Howe K Bioinforma@cs 2016 Apr 7. pii:btw159: PMID: 27153597 http://geval.sanger.ac.uk